
Market Overview
| Study Period | 2021 - 2031 |
|---|---|
| Market Volume (2026) | 1.08 Billion liters |
| Market Volume (2031) | 1.34 Billion liters |
| Growth Rate (2026 - 2031) | 4.38 % |
| Fastest Growing Market | Asia-Pacific |
| Largest Market | Asia-Pacific |
| Market Concentration | Medium |
Major Players *Disclaimer: Major Players sorted in no particular order Image © Mordor Intelligence. Reuse requires attribution under CC BY 4.0. | |
Marine Coatings Market Analysis by Mordor Intelligence
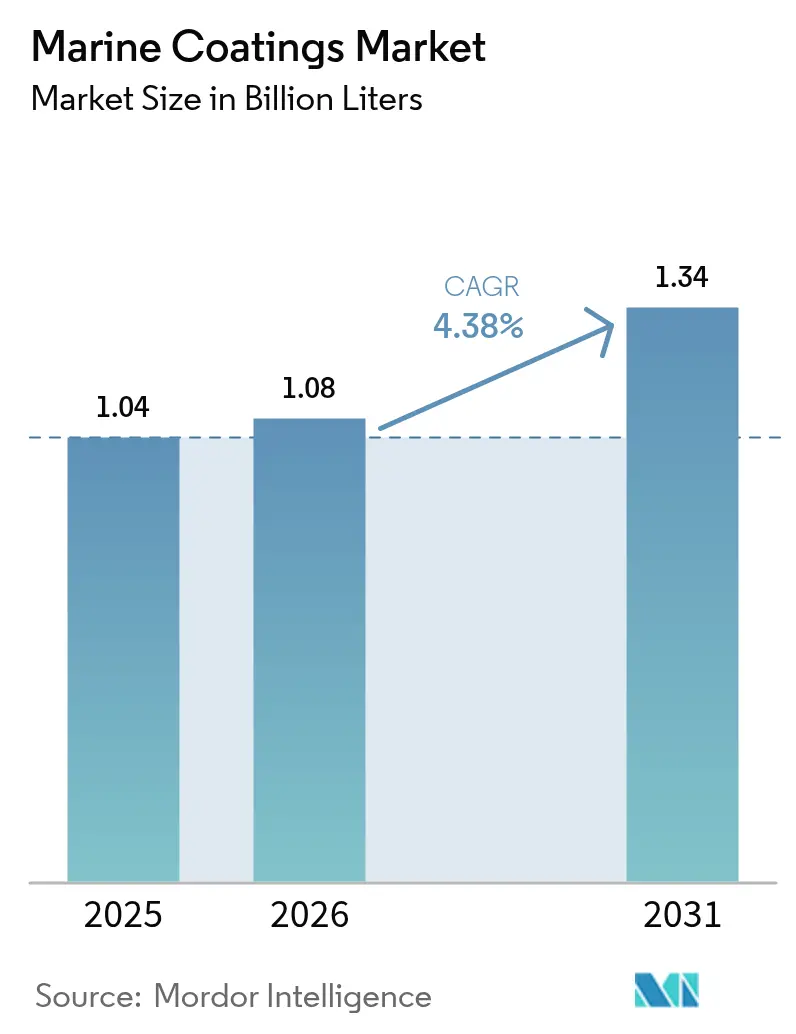
The Marine Coatings Market size is expected to increase from 1.04 billion liters in 2025 to 1.08 billion liters in 2026 and reach 1.34 billion liters by 2031, growing at a CAGR of 4.38% over 2026-2031. Improving fuel-efficiency mandates, the switch toward LNG propulsion, and the extra dry-dock cycles triggered by the IMO Carbon Intensity Indicator are the leading growth engines. Asia Pacific shipyards dominate coating demand because Chinese yards delivered 48.18 million dead-weight tonnes in 2024, while South Korean builders secured 61% of global LNG contracts the same year. Regulatory pressure is also steering buyers toward biocide-free foul-release systems after the European Chemicals Agency withdrew zinc pyrithione in 2024. Competitive differentiation now hinges on digital hull-performance platforms, as Jotun’s Hull Skating Solutions cut fuel use by up to 8% in early 2026 pilot fleets. Raw-material volatility, especially the 18% rise in titanium-dioxide prices during 1H 2025, remains the primary margin risk.
Key Report Takeaways
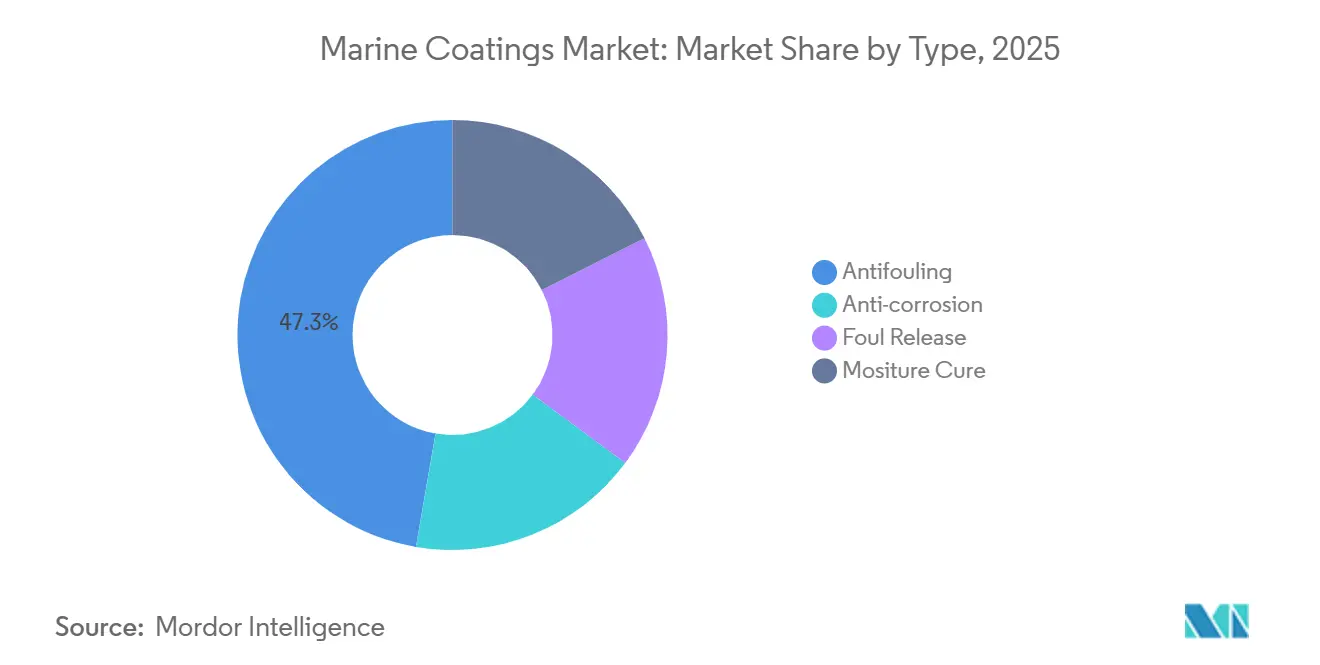
- Antifouling coatings led with 47.28% volume in 2025, while foul-release coatings are forecast to expand at a 4.75% CAGR through 2031.
- Alkyd resins commanded 54.79% share of the marine coatings market size in 2025, and polyurethane resins show the highest 4.52% CAGR to 203.
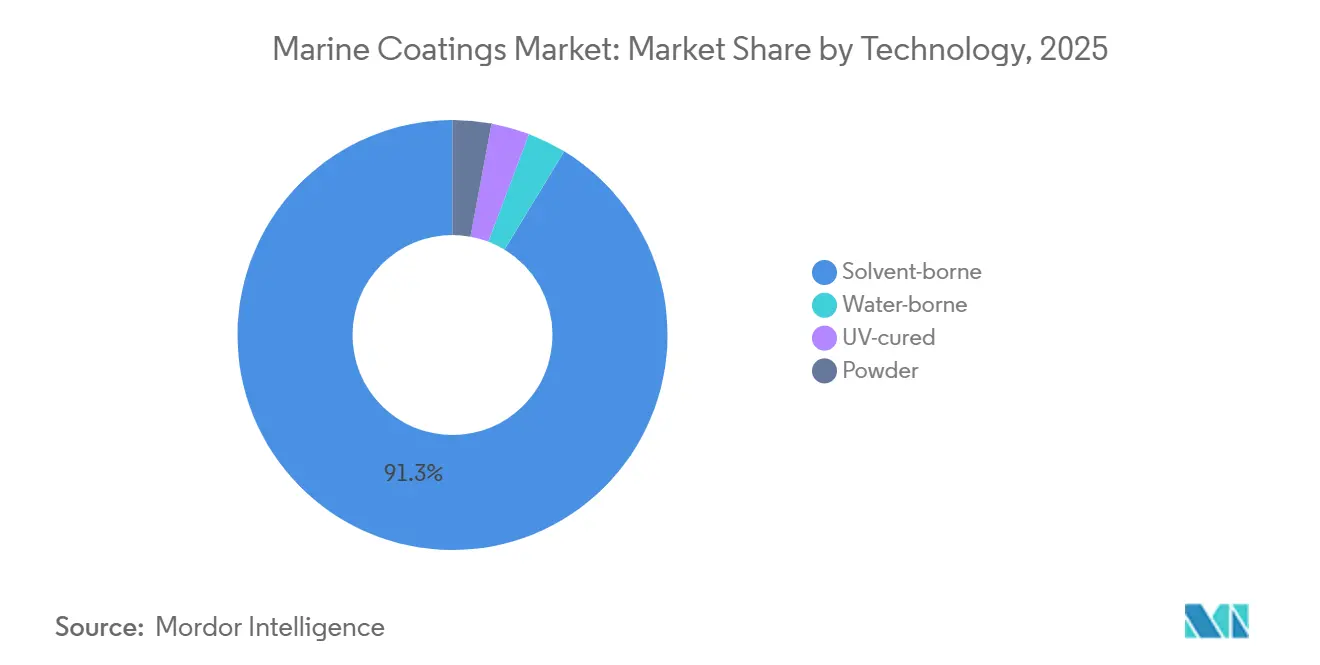
- Solvent-borne systems accounted for 91.31% of the 2025 marine coatings market share, whereas UV-cured systems are projected to grow at a 4.49% CAGR through 203.
- Marine OEM applications captured 58.84% volume in 2025, yet marine aftermarket demand is advancing at a 5.18% CAGR between 2026 and 2031.
- Asia Pacific held 72.17% volume in 2025 and is forecast to register a 4.82% CAGR through 2031.
Note: Market size and forecast figures in this report are generated using Mordor Intelligence’s proprietary estimation framework, updated with the latest available data and insights as of 2026.
Global Marine Coatings Market Trends and Insights
Drivers Impact Analysis*
| Drivers | (~) % Impact on CAGR Forecast | Geographic Relevance | Impact Timeline |
|---|---|---|---|
| Surge in newbuild orders for LNG-powered and hybrid vessels | +1.2% | Global, with concentration in Asia Pacific | Medium term (2-4 years) |
| Rising dry-docking frequency post-IMO CII ratings rollout | +0.9% | Global | Short term (≤ 2 years) |
| Accelerating cruise-fleet refurbishment cycles | +0.6% | North America and Europe | Medium term (2-4 years) |
| Expansion of offshore wind farm maintenance contracts | +0.4% | Europe, spill-over to Asia Pacific | Long term (≥ 4 years) |
| Growing ESG-linked ship-financing that rewards low-VOC coatings | +0.7% | Global, led by Europe and North America | Medium term (2-4 years) |
| Source: Mordor Intelligence | |||
Surge in Newbuild Orders for LNG-Powered and Hybrid Vessels
LNG propulsion is reshaping the marine coatings market as shipyards pivot toward dual-fuel and hybrid tonnage to meet IMO 2030 carbon targets[1]DNV, “Alternative Fuels Insight,” dnv.com. DNV logged 87 LNG-fueled vessels totaling 14.2 million gross tonnes ordered in 1H 2025, which raised demand for cryogenic-resistant epoxy tank linings. South Korean builders captured 61% of 2024 LNG contracts, consolidating regional volume. Operators are also specifying silicone foul-release finishes to minimize drag, exemplified by Chugoku Marine Paints’ BIOCLEAN PLUS that extends dry-dock intervals to 90 months. Early adopters report up to 5% fuel savings over five-year spans, reinforcing cost-of-ownership arguments. This momentum underpins a steady stream of orders that keeps the marine coatings market expanding through the medium term.
Rising Dry-Docking Frequency Post-IMO CII Ratings Rollout
The Carbon Intensity Indicator rates ships annually from A to E. Vessels graded D for three consecutive years or E for one face operational curbs, pushing owners to repaint more often. Aftermarket volumes are therefore rising 5.18% yearly, outpacing overall market growth. Singapore’s dry-dock throughput climbed 22% in 2025 as operators sought hull cleaning to retain A or B grades. Jotun’s digital Hull Skating robot enables real-time hull assessment and trims bunker burn by 8% across container fleets. These tools make predictive maintenance mainstream and amplify aftermarket pull for high-performance coatings that deliver smooth surfaces over longer cycles.
Accelerating Cruise-Fleet Refurbishment Cycles
Cruise lines are shortening refurbishment gaps to preserve premium aesthetics and comply with new port emission caps. Royal Caribbean ordered four vessels in 2025, each specifying polyurethane topcoats with 15-year gloss retention. Carnival advanced dry-dock schedules in 2024 to apply low-VOC hull systems ahead of FuelEU enforcement. Polyurethane demand is growing 4.52% annually because of its color stability and UV resistance, qualities critical on passenger decks. Hempel’s Hempaguard X7 hybrid formulation now lets cruise operators double docking intervals from 30 to 60 months. The cruise segment’s spending power, therefore, energizes the premium end of the marine coatings market.
Expansion of Offshore Wind Farm Maintenance Contracts
Offshore wind structures expose coatings to alternating seawater immersion and atmospheric corrosion. Hempel won a multi-year 2025 contract for North Sea turbine foundations that must last 25 years in harsh conditions. EU directives require 42.5% renewable energy by 2030, pushing installed offshore wind capacity past 76 GW. AkzoNobel is adapting Intertrac Vision for subsea cables where biofouling degrades efficiency. Sherwin-Williams introduced UV-curable topcoats that cure within minutes, enabling same-day turbine repair. These innovations create a fresh revenue lane that diversifies the marine coatings market beyond ship hulls.
Restraints Impact Analysis*
| Restraints | (~) % Impact on CAGR Forecast | Geographic Relevance | Impact Timeline |
|---|---|---|---|
| Tightening EU and US biocide approvals | -0.8% | Europe and North America, global spill-over | Short term (≤ 2 years) |
| Volatile titanium-dioxide and epoxy feedstock costs | -0.6% | Global | Short term (≤ 2 years) |
| Skilled applicator shortage inflating labor rates | -0.5% | Asia Pacific and Europe | Medium term (2-4 years) |
| Source: Mordor Intelligence | |||
Tightening EU and US Biocide Approvals
The European Chemicals Agency withdrew zinc pyrithione in 2024, removing a component found in roughly 40% of antifouling paints[2]European Chemicals Agency, “Zinc Pyrithione Non-Approval Decision,” echa.europa.eu. Reformulation typically needs up to two years, causing supply tension. The U.S. EPA Vessel Incidental Discharge Act further limits copper leach rates, effectively excluding many legacy products in certain waters. These dual rulings lift research and development outlays for silicone foul-release systems that are 30%–50% pricier than traditional coatings, a cost hurdle for owners in emerging markets. The potential PFAS phase-out would add another redesign cycle, extending the negative drag on the marine coatings market CAGR.
Volatile Titanium-Dioxide and Epoxy Feedstock Costs
Anti-dumping duties on Chinese titanium dioxide lifted EU prices 18% in 1H 2025. Epoxy input costs mirrored that volatility because bisphenol-A supply was disrupted in Asia Pacific. Major suppliers such as AkzoNobel hedge with long-term resin agreements, but smaller Asian formulators shoulder higher spot costs. Margin compression slows product innovation and can delay launches in the marine coatings industry. Price swings also complicate contract pricing with shipyards, injecting additional uncertainty into procurement cycles.
*Our forecasts treat driver/restraint impacts as directional, not additive. The impact forecasts reflect baseline growth, mix effects, and variable interactions.
Segment Analysis
By Type: Biocide-Free Systems Gain Momentum
Antifouling products captured 47.28% volume in 2025 within the marine coatings market size, confirming their central role in fuel-saving strategies. Regulatory pressure is pushing owners toward foul-release coatings, whose 4.75% CAGR makes them the fastest expanding sub-segment. Jotun’s Hull Skating platform combines silicone foul-release chemistry with sensors that optimize performance windows, illustrating the technology leap demanded by new efficiency rules. Anti-corrosion systems remain vital for LNG cargo tanks and container hulls, especially in Asian newbuild programs. Moisture-cure formulations are gaining share in dockside repairs because they cure via humidity, accelerating turnaround during tight docking slots.
The European Chemicals Agency ban on zinc pyrithione causes a split market. Premium fleets adopt silicone foul-release finishes for 5%-8% fuel savings, while cost-sensitive owners stick to copper systems still allowed in many routes. Advanced anti-corrosion lines now add nano-silica to extend service life. PPG’s self-smoothing Sigmaglide 2390 improves hull roughness by 6%, lifting efficiency gains. Moisture-cure coatings stay niche due to short pot life but solve critical spot-repair jobs, balancing the product mix in the marine coatings market.



By Resin: Polyurethane Gains on UV Stability
Alkyds secured 54.79% of the 2025 marine coatings market share because of their low price and compatibility with legacy equipment. Polyurethanes, however, post the highest 4.52% CAGR through 2031 by offering superior gloss retention on cruise topsides. Epoxies dominate primers and cryogenic tanks thanks to outstanding adhesion in saltwater immersion, while acrylics expand inside water-borne systems as regulators cap VOCs.
Cruise operators favor polyurethane despite its 20%–30% price premium because Royal Caribbean specifies 15-year cosmetic durability on newbuilds delivered from 2027 onward. Epoxy margins feel pressure from bisphenol-A volatility, but performance keeps demand steady. Niche fluoropolymer grades improve chemical resistance on chemical tankers, though looming PFAS restrictions could redirect research and development to ceramic-reinforced epoxies. These shifts ensure resin competition stays dynamic in the marine coatings market.
By Technology: Water-Borne Systems Inch Forward
Solvent-borne lines retained 91.31% volume in 2025, proving their reliability in humid yards across the Asia Pacific. AkzoNobel’s Intersleek 1100SR demonstrates that near-zero VOC water-borne fouling control can match solvent-borne performance. UV-cured finishes are expanding at a 4.49% CAGR by enabling one-day dock jobs.
Transition obstacles include slower dry times and humidity sensitivity, but Jotun’s broader-window Jotamastic 90 narrows the gap. Powder systems stay confined to interior fixtures given high bake temperatures. Sherwin-Williams’ UV-curable offshore wind range shows how project economics justify upfront lamp investment when downtime penalties are steep. These advances sustain a gradual shift in technology mix as the marine coatings market adopts cleaner chemistries.
By Application: Aftermarket Outpaces OEM
OEM projects absorbed 58.84% volume in 2025 as Chinese yards built 48.18 million DWT and Korean yards led LNG orders. Controlled yard conditions favor solvent-borne epoxies applied in blocks before assembly. Yet aftermarket demand is expanding at 5.18% CAGR because CII scoring pushes owners to repaint to retain efficiency ratings.
Rising fleet age, now averaging 21 years, inflates corrosion repair volumes. Singapore’s dock utilization spike of 22% in 2025 illustrates the pivot toward proactive maintenance. High-durability solutions like SEAFLO NEO CF PREMIUM extend docking gaps to 90 months, lowering lifecycle cost. OEM growth still correlates with orderbooks that climbed 58.8% year-on-year in 2025. However, regulatory and financing signals keep the aftermarket in the lead, reinforcing a structural turn in the marine coatings market.
Geography Analysis
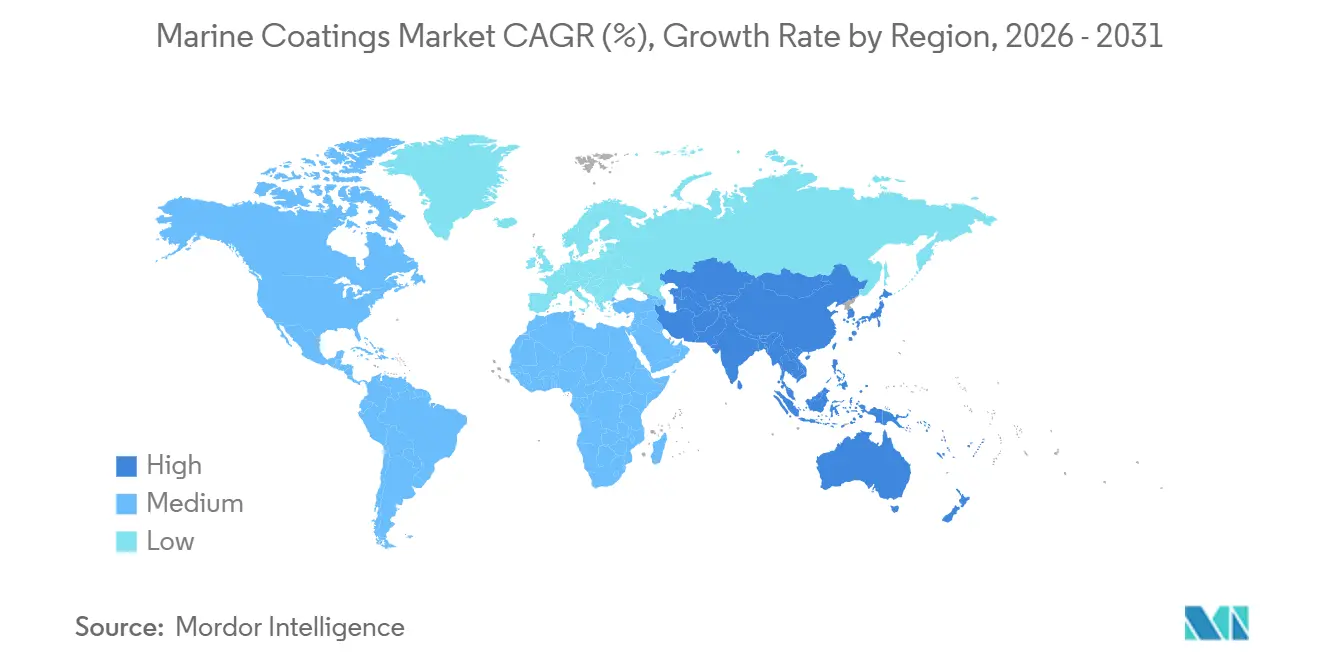
Asia Pacific accounted for 72.17% of the 2025 volume and is advancing at a 4.82% CAGR through 2031, as China retained 50.5% of global completions by compensated gross tonnage. South Korean yards specialize in LNG carriers, capturing the value-dense eco-ship niche that demands premium cryogenic tank coatings. Japanese builders, while smaller, remain pivotal for chemical tankers where coating reliability is paramount. Water-borne uptake is growing in China because local regulations now tax high-VOC finishes, a step that lifts regional demand for advanced formulations.
Europe’s demand profile is led by offshore wind foundations and cruise refurbishments. EU renewable directives keep turbine installations on track for 76 GW by 2030, spurring long-life anti-corrosion sales. Zinc-pyrithione withdrawal accelerated foul-release adoption to 38.4% penetration in 2025, triple China’s ratio. North America mirrors Europe on VOC pressure; VIDA implementation steers cruise lines to rapid-cure, low-solvent systems on Caribbean routes.
The Middle East invests in new yards to service oil tanker fleets, raising demand for high-temperature anti-corrosion epoxies. Africa remains nascent apart from South African repair docks. South America sees pockets of growth in Brazil’s offshore sector, but lags because of economic cycles. These geographic contrasts affirm divergent adoption curves in the marine coatings market.

Regulatory Landscape
Marine coatings demand is closely linked to the IMO framework for controlling harmful antifouling impacts and improving operational efficiency. The International Convention on the Control of Harmful Anti-fouling Systems on Ships (AFS Convention) requires surveys and certification for ships of 400 gross tonnage and above, with procedures set out in the 2022 Guidelines (Resolution MEPC.358(78)). Alongside AFS Convention restrictions on harmful organotin compounds, these compliance requirements keep owners and yards focused on approved systems and documented application records across global trading routes.
In Europe, environmental criteria and biocide decisions continue to shape product formulation and qualification. In February 2026, the European Commission released revised EU Ecolabel criteria for Paints and Varnishes with stricter VOC and SVOC limits, valid through 31 December 2032, which raises the bar for low-emission product lines used in marine-related applications. The UK Merchant Shipping (Anti-Fouling Systems) Regulations 2024 introduced a defined timeline for cybutryne-containing systems, requiring removal or a barrier coating by the earlier of the next scheduled renewal or 31 December 2027. In May 2026, the European Commission extended the approval of medetomidine (product type 21, antifouling biocides) to avoid market disruption during re-evaluation, highlighting how active-substance status and review timelines affect reformulation planning.
Value Chain Analysis
The marine coatings value chain covers upstream petrochemical and mineral inputs (resins such as epoxy and polyurethane intermediates, solvents, additives, and pigments including titanium dioxide), downstream formulation and manufacturing, and then multi-channel distribution through OEM shipyard supply contracts and aftermarket networks serving dry docks and repair yards. Large suppliers typically provide technical service alongside product supply at shipyards, while aftermarket delivery depends on local stock points and applicator capability to meet tight docking windows, making service execution a key part of delivered value.
Two constraints have become more visible along the chain: regulatory-driven compatibility demands and feedstock and logistics volatility. On the demand-side interface, IMO actions around biofouling management are shaping service requirements around coating durability and cleaning compatibility; for example, MEPC 83 (April 2025) approved Guidance on in-water cleaning of ships biofouling (MEPC.1/Circ.918), which increases the need for suppliers to provide product documentation aligned with in-water cleaning practices. On the supply side, disruptions affecting petrochemical-derived inputs and rerouting-related freight impacts have raised costs and extended lead times, pushing manufacturers and distributors to diversify sourcing and hold more buffer inventory, particularly for resin- and solvent-intensive systems used in newbuild and maintenance programs.
Competitive Landscape
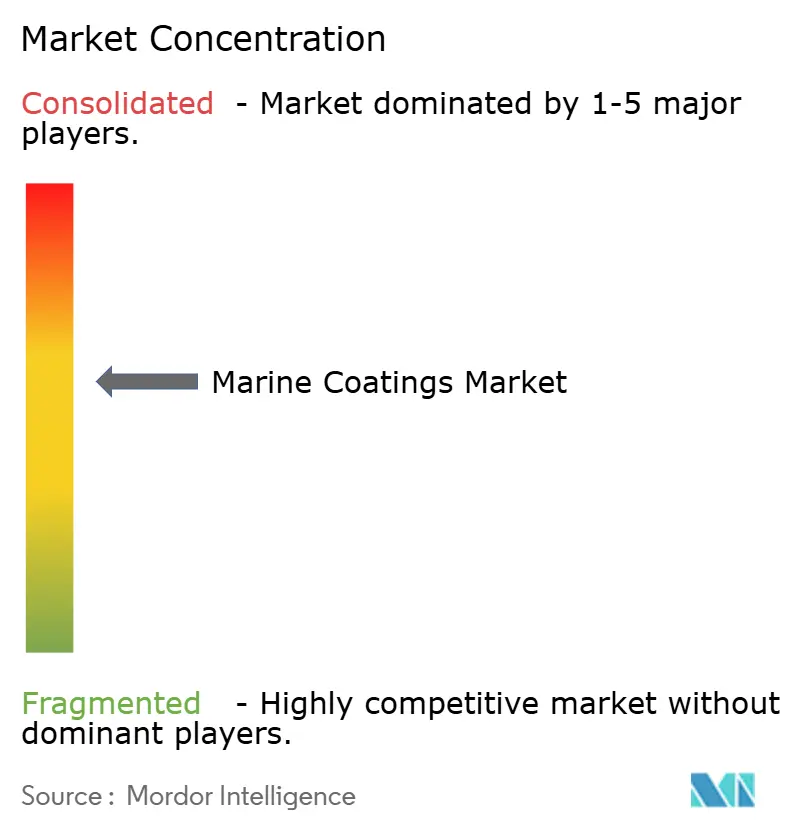
The marine coatings market is moderately consolidated. Jotun’s Hull Skating Solutions pairs coatings with analytics, locking in multiyear service bundles that cut bunker bills 8%. AkzoNobel’s sensor-enabled Intertrac Vision provides live degradation data, letting owners schedule just-in-time recoats. Regional formulators in Southeast Asia compete on quick turnaround but lack research and development heft for next-gen silicone systems.
Hempel’s 2025 North Sea wind-farm win showcases white-space in renewable infrastructure coatings. Chugoku’s November 2025 capacity alliance with a Korean partner aims to capture LNG newbuild volumes. Skilled applicator scarcity opens a niche for forgiving products such as Jotamastic 90 that tolerate high humidity without defects. ESG-linked finance advantages suppliers with ISO-certified low-VOC lines, reinforcing incumbent dominance. The marine coatings market, therefore, exhibits moderate concentration with sustained technology-led rivalry.
Marine Coatings Industry Leaders
AkzoNobel N.V.
Jotun
PPG Industries Inc.
Hempel A/S
Nippon Paint Marine Coatings Co. Ltd.
- *Disclaimer: Major Players sorted in no particular order

Market Opportunities and Future Outlook
A key whitespace is the rapid scale-up of biocide-managed or biocide-free performance solutions that meet tightening environmental screens while still delivering hull-efficiency gains demanded by CII-driven maintenance cycles. The UK anti-fouling compliance timeline for cybutryne (barrier coat or removal by the earlier of the next renewal or 31 December 2027) and the EU Ecolabel criteria update in February 2026 create practical procurement triggers for lower-emission and reformulated systems. In parallel, the IMO-approved guidance on in-water cleaning (MEPC.1/Circ.918, approved at MEPC 83 in April 2025) supports broader adoption of coating-and-service packages focused on cleaning compatibility and repeatable performance documentation, reinforcing the role of digital hull-performance platforms and in-service maintenance programs.
Another opportunity is the shift toward lower-embodied-carbon materials and certified bio-based inputs in high-volume epoxy and antifouling product families. In July 2025, Chugoku Marine Paints stated that its CMP NOVA 2000 (Bio), an ISCC PLUS certified bio-based epoxy resin coating, was adopted for a new liquefied ammonia tanker scheduled for completion in May 2026, signaling movement of mass-balance, certified bio-based resins from pilots to specified projects in advanced newbuild segments. Separately, in February 2026, Coppercoat (Aquarius Marine Coatings Ltd) introduced a 100% plant-based epoxy resin base for its antifouling system, indicating ongoing product redesign toward lower CO2 intensity materials. Together with shipowner focus on fuel and emissions accounting, these actions expand the addressable space for certified low-VOC and alternative-resin marine coatings beyond niche premium applications.
Recent Industry Developments
- June 2026: Jotun signed a memorandum of cooperation with COSCO SHIPPING Bulk covering 125 newbuilding bulk carriers. The agreement strengthens Jotun's access to high-volume newbuild demand and supports earlier specification of fouling-control systems during construction. It also increases competitive pressure on other suppliers to secure fleet-level frameworks with major Chinese operators and yards.
- October 2025: Hempel won a multi-year contract to coat North Sea offshore wind foundations using Hempadur Avantguard systems. The award reinforces the shift of marine-grade corrosion protection into renewable infrastructure where long-life performance requirements are tightly specified. It also broadens end-market exposure beyond ship hulls and dry-dock cycles.
- March 2024: The European Chemicals Agency withdrew zinc pyrithione, removing an active substance used in a large share of antifouling paints. The decision forced accelerated reformulation and qualification work across legacy antifouling portfolios, while supporting faster adoption of silicone foul-release systems in regulated waters. It also increased the importance of approved biocide pathways and supply continuity for shipowners operating across multiple jurisdictions.


Research Methodology Framework and Report Scope
Market Definition and Coverage
For this study, the marine coatings market covers protective and performance coatings used on marine vessels and related marine structures to reduce corrosion, fouling, and wear across new build and maintenance cycles.
Scope exclusions: This sizing excludes upstream raw materials and additives sold as inputs, along with non-marine industrial protective coatings that are not specified for marine exposure.
Segmentation Overview
- By Type
- Anti-corrosion
- Antifouling
- Foul Release
- Mositure Cure
- By Resin
- Epoxy
- Polyurethane
- Acrylic
- Alkyd
- Other (Fluoropolymer, Polyester etc)
- By Technology
- Water-borne
- Solvent-borne
- UV-cured
- Powder
- By Application
- Marine OEM
- Marine Aftermarket
- By Geography
- Asia Pacific
- China
- Japan
- South Korea
- India
- Malaysia
- Vietnam
- Rest of Asia Pacific
- North America
- United States
- Canada
- Mexico
- Europe
- Germany
- United Kingdom
- France
- Italy
- Spain
- Rest of Europe
- South America
- Brazil
- Argentina
- Rest of South America
- Middle East and Africa
- Saudi Arabia
- UAE
- South Africa
- Nigeria
- Rest of Middle east and Africa
- Asia Pacific
Data Sources, Market Sizing, and Validation
Desk Research
Desk research was used to set the demand context and to make sure the model tracks real marine activity instead of only coating industry claims. We referenced public sources such as IMO publications and notices, UNCTAD shipping reviews, World Bank macro indicators, and national statistics on shipbuilding and industrial output, which help explain where vessel supply and maintenance cycles are moving.
Alongside these, we reviewed annual reports, investor decks, and product literature to understand how marine OEM and aftermarket volumes behave across coating systems. To tighten cross-checks, we used a paid subscription for company financials and intelligence where relevant, and we reviewed patent databases for directional signals on antifouling and foul-release innovation. The sources listed here are illustrative, and other public documents and datasets were also used for data collection, validation, and clarification.
Primary Interviews and Surveys
Primary interviews and surveys were used to test real purchasing behavior and to close gaps that public data does not fully explain, such as repaint intervals, typical coating system builds, and the mix between newbuild and dry-dock demand. We spoke with a mix of manufacturers, distributors, shipyard-facing participants, applicator-side experts, and end users, and we balanced coverage across APAC, EMEA, and the Americas so regional shipbuilding and fleet maintenance patterns were not generalized beyond the evidence.
Distribution of primary research fieldwork respondents
| Company type | Respondent position | Region |
|---|---|---|
| Top tier: 29% | CXOs: 14% | APAC: 52% |
| Mid tier: 57% | Functional/Unit leaders: 28% | EMEA: 29% |
| Smaller Players: 14% | Managers: 58% | Americas: 19% |
Market-Sizing & Forecasting
The market model was built using a top-down approach where shipbuilding output and active fleet maintenance needs are translated into coating demand, and then converted into market value using realistic system mix and pricing. To keep totals grounded, we checked outputs with selective bottom-up approximations such as sampled supplier revenues, shipyard and dry-dock channel checks, and volume per vessel class assumptions multiplied by observed repaint frequency.
A few practical inputs were treated as key moving parts, including newbuild deliveries and orderbook direction, dry-dock frequency and typical repaint cycles, the share shift between antifouling and foul-release systems under environmental rules, the OEM versus aftermarket split, and resin and technology mix that changes the average selling price. Where direct volume or price points were not consistently available, we handled gaps by using proxy ranges from interviews and then narrowing those ranges through cross-region consistency checks.
For forecasting, scenario analysis was used with supporting trend models (exponential smoothing on stable series and step-changes where rules or fuel-efficiency pressures drive a technology switch). The final forecast direction was then aligned with what primary respondents expected for shipyard utilization, maintenance timing, and near-term pricing moves.
Data Validation & Update Cycle
Outputs were triangulated across independent signals, and then reviewed for variances that did not match known activity indicators such as ship deliveries, port throughput direction, and dry-dock scheduling trends. When a segment or region moved outside a reasonable band, we rechecked assumptions, followed by a second pass that looked for unit-conversion issues and mix errors before internal sign-off.
Reports are refreshed annually, and interim updates are done when a material event changes demand or pricing assumptions, such as a regulation shift or a sudden raw material price swing that impacts coatings ASP. Before delivery, a fresh analyst pass is completed so clients receive the latest updated view instead of an older model snapshot.
Mordor Intelligence's Marine Coatings Market Size Versus Other Published Estimates
Published market sizes for marine coatings often vary because the market boundary is not picked the same way, and because some estimates lean on different base years or different mixes of OEM versus maintenance demand. Differences also show up when one source reports value while another source reports volume, which then forces additional pricing assumptions that can move totals.
By checking repaint-cycle assumptions and shipyard utilization signals, Mordor Intelligence keeps the market value tied to realistic marine OEM and aftermarket demand, rather than expanding scope into adjacent industrial protective coatings or applying aggressive price escalation without validation.
Benchmark comparison
| Source | Market Size | Gaps in Research Methodology |
|---|---|---|
| Mordor Intelligence | USD 4.80 B (2023) | |
| Global Consultancy A | USD 3.80 B (2024) | This estimate appears to anchor to a narrower near-term demand pool, which can happen when aftermarket repaint volumes are underweighted versus newbuild activity, and when system mix is simplified for pricing. |
| Trade Publisher B | USD 4.80 B (2023) | While the headline value matches, differences can still exist in what is counted inside marine coatings, especially if offshore and marine structure coatings are grouped differently, or if the split between foul-release and antifouling systems is priced using broader averages. |
Taken together, the spread is mainly explained by how each source converts marine activity into demand, and then translates demand into value using mix and pricing logic. A model that is explicit about repaint cycles, newbuild versus maintenance balance, and technology mix usually produces totals that are easier to trace and repeat when market conditions change.


Key Questions Answered in the Report
How large will the marine coatings market be by 2031?
Volume is forecast to reach 1.34 billion liters by 2031, rising at a 4.38% CAGR from 2026.
Which resin type is gaining the fastest?
Polyurethane resins expand at a 4.52% CAGR thanks to superior UV and gloss retention that attracts cruise and offshore wind clients.
Why is aftermarket demand outpacing OEM demand?
IMO Carbon Intensity ratings drive more frequent hull repainting, lifting aftermarket volumes at a 5.18% CAGR between 2026 and 2031.
What segment holds the largest marine coatings market share today?
Antifouling products dominate with 47.28% volume in 2025 because biofouling control remains a universal fuel-efficiency need.
How are regulations shaping product development?
EU and US biocide curbs and VOC limits accelerate research and development toward silicone foul-release and water-borne systems that meet stricter emissions rules.
Page last updated on:




