Market Overview
| Study Period | 2021 - 2031 |
|---|---|
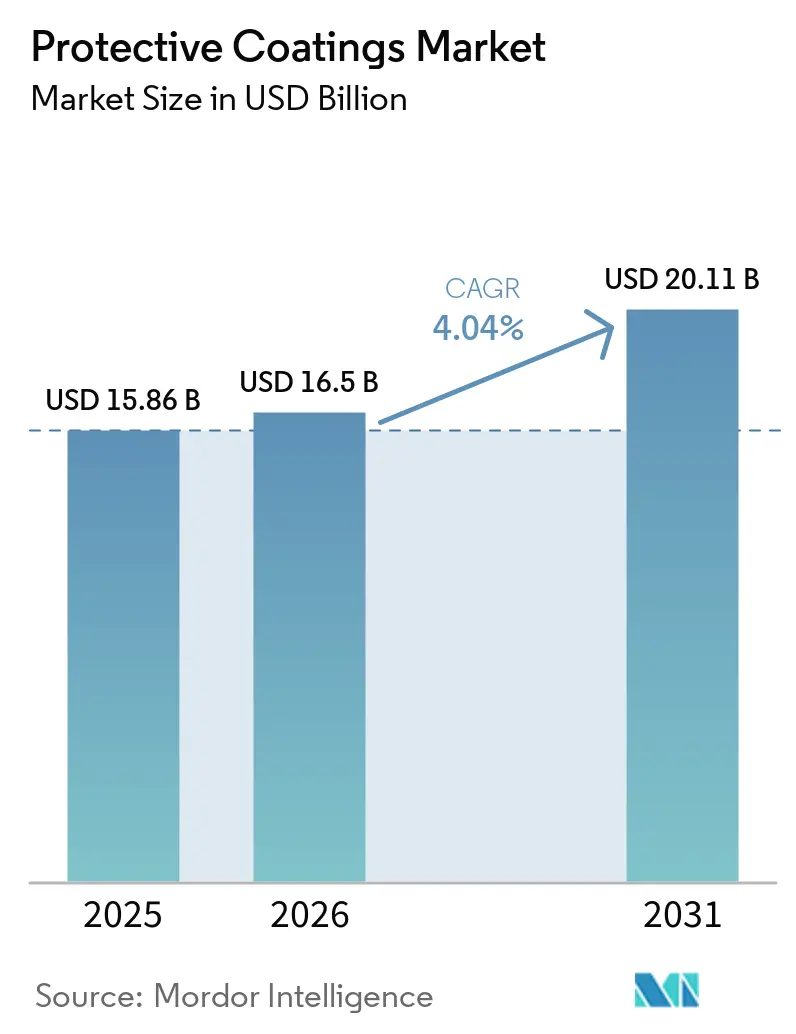
| Market Size (2026) | USD 16.5 Billion |
| Market Size (2031) | USD 20.11 Billion |
| Growth Rate (2026 - 2031) | 4.04% CAGR |
| Fastest Growing Market | Asia-Pacific |
| Largest Market | Europe |
| Market Concentration | Medium |
Major Players *Disclaimer: Major Players sorted in no particular order Image © Mordor Intelligence. Reuse requires attribution under CC BY 4.0. | |
Protective Coatings Market Analysis by Mordor Intelligence
The Global Protective Coatings Market size is expected to increase from USD 15.86 billion in 2025 to USD 16.5 billion in 2026 and reach USD 20.11 billion by 2031, growing at a CAGR of 4.04% over 2026-2031. Demand continues to pivot toward water-borne, powder, and high-solids chemistries as regulators cap VOC content, yet solvent-borne systems still generated 71.39% of 2025 revenue. Infrastructure spending in Asia-Pacific and the Gulf Cooperation Council (GCC), a surge in offshore-wind foundations, and gigafactory construction for electric-vehicle batteries are sustaining volume growth, while escalating titanium-dioxide costs and skilled-labor shortages are squeezing margins and accelerating automation. Formulators able to balance low-VOC compliance with corrosion protection are winning specifications on metro-rail tunnels, hydrogen pipelines, and desalination plants. Competitive intensity remains moderate because the top five suppliers hold a 40% combined share, leaving space for regional specialists armed with niche chemistries and application services.
Key Report Takeaways
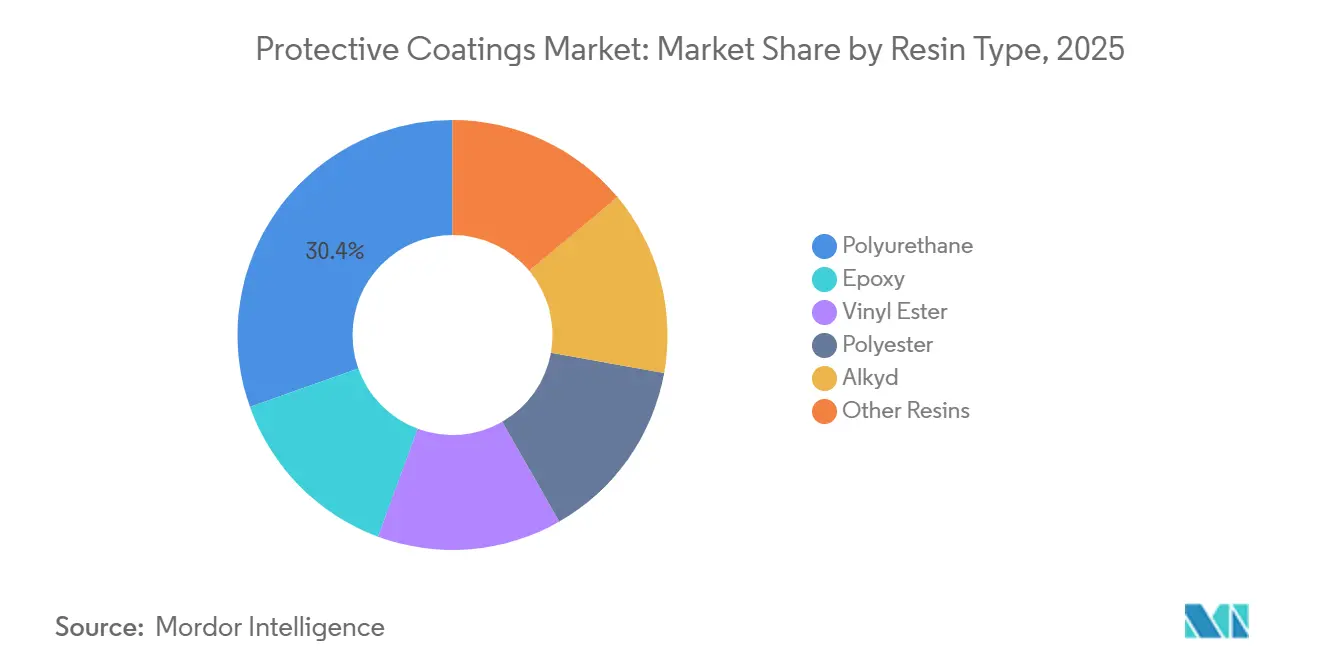
- By resin type, polyurethane held 30.44% revenue share in 2025; it also posts the highest forecast CAGR of 4.78% to 2031.
- By technology, solvent-borne coatings retained 71.39% of the protective coatings market share in 2025, while water-borne systems are poised for a 4.68% CAGR through 2031.
- By substrate, metal accounted for 49.08% of the protective coatings market size in 2025, whereas plastic and composite substrates are set to advance at a 4.95% CAGR between 2026-2031.
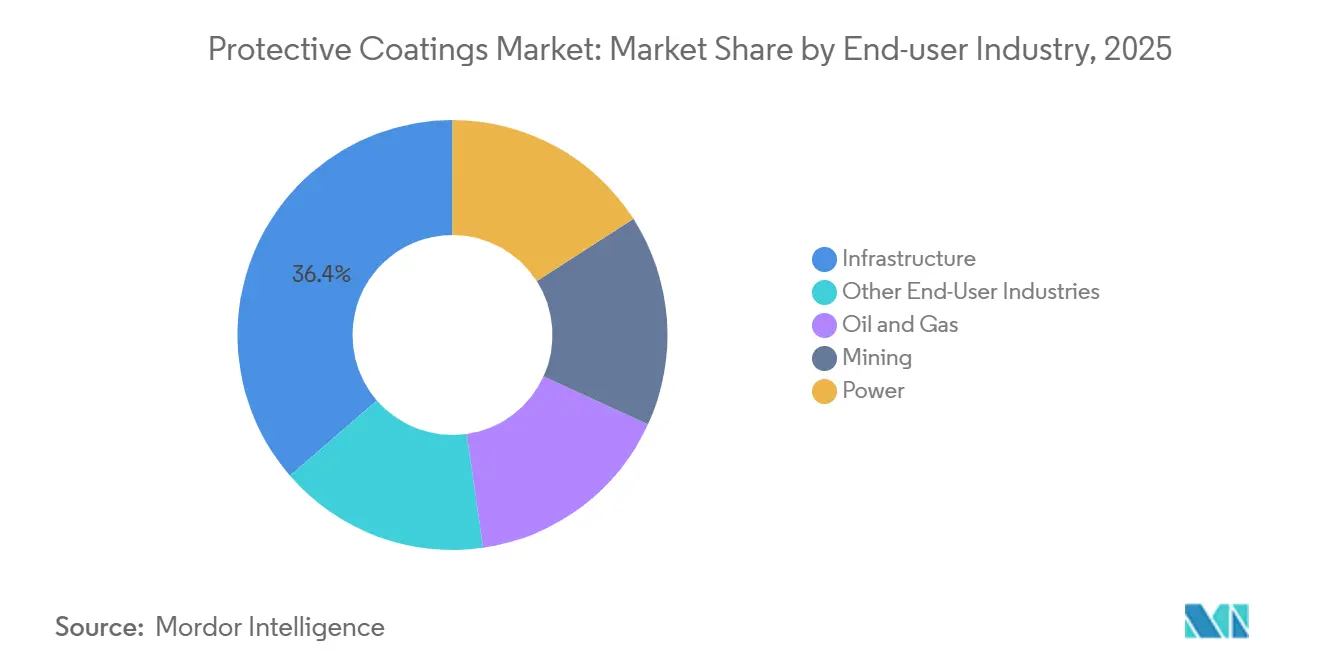
- By end-user industry, infrastructure captured 36.35% of the protective coatings market share in 2025 and is projected to grow at a 4.34% CAGR through 2031.
- By region, Europe led with 50.17% revenue share in 2025; Asia-Pacific is the fastest-growing region with a 5.33% CAGR expected from 2026-2031.
Note: Market size and forecast figures in this report are generated using Mordor Intelligence’s proprietary estimation framework, updated with the latest available data and insights as of January 2026.
Global Protective Coatings Market Trends and Insights
Driver Impact Analysis*
| Driver | (~) % Impact on CAGR Forecast | Geographic Relevance | Impact Timeline |
|---|---|---|---|
| Public-sector megaproject pipeline in APAC and GCC | +1.20% | Asia-Pacific core, GCC spill-over to North Africa | Medium term (2-4 years) |
| Accelerating shift from solvent-borne to low/zero-VOC systems | +0.90% | Global, with EU and North America leading | Long term (≥ 4 years) |
| Spike in offshore-wind foundation demand | +0.70% | Europe, Asia-Pacific coastal zones | Medium term (2-4 years) |
| AI-enabled predictive maintenance driving on-site recoating | +0.40% | North America, EU industrial corridors, early APAC adoption | Medium term (2-4 years) |
| Surge in EV-battery gigafactory construction | +0.60% | Asia-Pacific, North America, select EU hubs | Short term (≤ 2 years) |
| Source: Mordor Intelligence | |||


Public-Sector Megaproject Pipeline in APAC and GCC
Governments across Asia-Pacific and the GCC have earmarked USD 2.8 trillion for rail, port, and energy infrastructure through 2030, a program that creates a steady pull for epoxy-polyamide primers, zinc-silicate bases, and polyurethane topcoats that survive humidity above 85% and chloride levels above 500 ppm[1]Press Information Bureau, “National Infrastructure Pipeline Update,” pib.gov.in. India’s National Infrastructure Pipeline alone set aside USD 1.4 trillion for metro-rail extensions in 16 cities, requiring coatings compliant with IS 15489 coastal durability classes. Saudi Arabia’s NEOM and Red Sea Project encompass more than 50 million m² of structural steel, each specified to ISO 12944 C5-M, thereby favoring three-coat zinc-epoxy-polyurethane sequences. Belt-and-Road rail corridors in Pakistan and Indonesia have also standardized fusion-bonded epoxy for rebar and water-borne acrylics for concrete tunnels. GCC desalination upgrades, 12 million m³/day of new capacity by 2028, demand phenolic-epoxy linings certified to NSF/ANSI 61, underlining the need for chemical resistance in hypochlorite service.
Accelerating Shift from Solvent-Borne to Low/Zero-VOC Systems
The European Union slashed VOC ceilings to 250 g/L for confined-space applications in January 2024, effectively retiring long-oil alkyds without add-on oxidizers. California’s South Coast Rule 1107 dropped metal-coating limits to 100 g/L in 2025, catalyzing water-borne epoxy uptake despite 20% longer flash-off times[2]South Coast Air Quality Management District, “Rule 1107 Amendments,” aqmd.gov. Powder coatings, which emit zero VOCs, captured 8% of the protective coatings market in 2025 but remain confined to substrates tolerating 180-200°C cure cycles. Meanwhile, a 2025 explosion at a European ester plant squeezed coalescent availability, complicating the water-borne transition. Hybrid high-solids epoxies with <150 g/L VOC are filling specification gaps where field temperatures sit below 15°C.
Spike in Offshore-Wind Foundation Demand
Global offshore-wind additions reached 12 GW in 2025, each gigawatt translating to 180 monopiles that consume 12-15 t of coatings in the protective coatings industry. Taiwan’s Changfang–Xidao rollout mandates zinc-rich epoxy, glass-flake epoxy, and polysiloxane layers verified to 5,000-hour salt-fog endurance. Europe’s North Sea Round 5 awarded rights for 7 GW in 2025, reinforcing demand for 25-year C5-M durability. Suppliers are investing in glass-flake epoxies that cut water permeability by 40% versus legacy systems, extending cathodic-protection intervals and lowering lifecycle costs. Japan’s floating-wind pilots introduced polyurea elastomers for dynamic cable hang-offs enduring 10 million fatigue cycles, opening a premium niche for elastomeric chemistries.
Surge in EV-Battery Gigafactory Construction
Thirty-eight gigafactories broke ground in 2025, pushing global cell capacity and requiring anti-static, fire-rated floor and wall systems in the protective coatings industry. Northvolt’s Swedish expansion and Ford’s Tennessee BlueOval City together draw 2.5 million m² of coatings that must satisfy NFPA 286 and lithium-salt spill resistance. South Korea’s LG Energy Solution and SK On pledged USD 7 billion for North American plants, each specifying surface resistivity between 10⁶-10⁹ Ω to avoid solvent ignition during assembly. China’s CATL gigafactory adopted water-borne polyurethanes to meet the strict 50 g/L local VOC limit. Hollow-glass microsphere pigments with high light-reflectance values are also cutting HVAC loads and titanium-dioxide usage.
Restraint Impact Analysis*
| Restraint | (~) % Impact on CAGR Forecast | Geographic Relevance | Impact Timeline |
|---|---|---|---|
| Escalating epoxy and TiO₂ price volatility | -0.80% | Global, acute in import-dependent markets | Short term (≤ 2 years) |
| Tightening global VOC & PFAS bans | -0.50% | EU, North America, expanding to APAC | Long term (≥ 4 years) |
| Skilled applicator shortage in emerging markets | -0.40% | Southeast Asia, Middle East, Sub-Saharan Africa | Medium term (2-4 years) |
| Source: Mordor Intelligence | |||
Escalating Epoxy and TiO₂ Price Volatility
Titanium dioxide spot prices climbed 12% in Q1 2025 after capacity cuts in Sichuan, while epoxy pricing remains 18% above 2023 levels owing to propylene-oxide shortages in the protective coatings industry. Smaller regional formulators lack hedging scale and are exposed to 15% quarterly price swings, prompting end-users to negotiate fixed contracts indexed to published resin benchmarks. Switching to water-borne acrylics or polyurethane dispersions offers partial shelter but demands USD 0.5 million per product line and over a year of field validation. Cash-flow strain is already forcing some mid-tier suppliers to exit solvent-borne alkyd lines.
Tightening Global VOC & PFAS Bans
ECHA’s February 2025 proposal would phase out PFAS additives in protective topcoats starting in 2027. Fluorinated surfactants that drop surface tension to 22 dyn/cm face costly silicone replacements that underperform on vertical leveling. The U.S. EPA is moving to label PFOA and PFOS as hazardous under CERCLA, exposing applicators to cleanup liabilities if overspray contaminates groundwater. China’s GB 38507-2020 capped industrial VOCs at 420 g/L nationwide in 2024, and Guangdong lowered the ceiling to 250 g/L in 2025. Multinationals can amortize reformulation across regions, but single-country producers risk losing share without a USD 2-3 million compliance budget.
*Our forecasts treat driver/restraint impacts as directional, not additive. The impact forecasts reflect baseline growth, mix effects, and variable interactions.
Segment Analysis
By Resin Type: Polyurethane Dominance Reflects Durability Premiums
Polyurethane captured a 30.44% protective coatings market share in 2025 and is on track to widen at a 4.78% CAGR through 2031. Two-component aliphatic grades safeguard offshore towers by holding Delta E (ΔE) color change below 2.0 after 5,000 hours of QUV-A exposure. Epoxies remain indispensable primers thanks to abrasive-blast adhesion metrics that hit Sa 2.5, yet UV chalking limits their use as topcoats. Alkyds, squeezed by VOC limits, retreat to niche dry-climate repair. Vinyl esters defend chemical reactors against 98% sulfuric acid at elevated temperatures, while polyester gel coats extend service life in composite clarifiers that bypass cathodic protection. Hybrid zinc-rich epoxies beneath polyurethane finishes now dominate ISO 12944 C5-M specifications, rewarding formulators adept at multi-chemistry systems.
Growth within the resin slate also mirrors raw-material inflation in the protective coatings market. Rising bisphenol-A and isocyanate costs encourage high-solids formulations that trim solvent volumes by 30% and cut titanium-dioxide usage. Suppliers injecting graphene nanoplatelets into epoxy matrices report 25% lower cathodic-protection current requirements, unlocking value in offshore retrofits. The innovation race is further fueled by patent filings for microcapsule-based self-healing systems, which extend service intervals by autonomously sealing 50-µm scratches. Collectively, these advances keep polyurethane at the forefront, while allowing specialty chemistries to claim high-margin niches where corrosion and chemical resistance converge.


By Technology: Water-Borne Formulations Gain Despite Application Trade-Offs
Solvent-borne systems still accounted for 71.39% of the protective coatings market size in 2025 because they cure quickly in humid 85% conditions and exhibit proven field reliability. Yet regulators pushing VOC ceilings below 250 g/L make further share loss inevitable, and water-borne demand therefore rises at a 4.68% CAGR despite 20% longer recoat intervals observed in cool 15°C field work. High-solids epoxies, falling under other technologies, achieve <150 g/L VOC by boosting molecular weight, but they require heated plural-component spray rigs and skilled operators to avoid sag on vertical steel.
UV-cured coatings open sub-60-second through-cure for small parts, yet photoinitiator cost and line-of-sight constraints limit wide adoption in the protective coatings market. ISO 12944-5 finally endorsed water-borne systems for C5-M sites in 2024 if they equal solvent-borne salt-spray and cathodic-disbondment benchmarks. That change widens the specification window, particularly in Europe, where REACH pressure and corporate ESG targets converge. Suppliers that marry hybrid emulsions with solvent-like flow are achieving 5B cross-hatch adhesion on blasted steel and gloss retention rivaling polysiloxanes, proving that production efficiency and compliance can coexist.
By Substrate: Plastic and Composites Surge on Lightweighting Mandates
Metal substrates generated 49.08% of 2025 demand in the protective coatings market, but non-metallics are now the fastest-growing slice at a 4.95% CAGR. Adoption is led by battery-electric vehicle enclosures, hydrogen storage cylinders, and fiberglass piping, each requiring flame-retardant barriers without the density of carbon steel. Coatings for polypropylene must embed chlorinated-polyolefin tie-layers to hit ASTM D3359 5B adhesion, and for carbon-fiber parts often need plasma or flame pre-treatment to raise surface energy to 38 dyn/cm. Concrete structures in parking decks, desalination plants, and wastewater facilities are absorbing water-borne acrylic seals that limit chloride ingress to below 0.4% cement weight per ACI 318, thereby prolonging rebar life cycles.
Wood cladding on coastal resorts needs alkyd-acrylic hybrids with light stabilizers to dodge photodegradation, while low-E glass in curtain walls adopts silicone-modified coatings that retain clarity after 10,000 hours of xenon-arc. Lightweighting legislation in aerospace is prompting the adoption of single-component moisture-cure polyurethanes that extend pot life to eight hours, reducing mix-ratio errors where labor skills are scarce. These substrate shifts press suppliers to broaden adhesion-promoter portfolios and to validate performance across dissimilar materials joined inside single assemblies in the protective coatings market.
By End-Use Industry: Infrastructure Leads on Public-Sector Capital Cycles
Infrastructure accounted for 36.35% of 2025 revenue in the protective coatings market and is expanding at a 4.34% CAGR due thanks to metro-rail, bridge, and desalination projects in Asia-Pacific and the Middle East. Mumbai Metro Line 3 alone consumed 4,200 t of coatings and codified zinc-rich epoxy primers plus polyurethane topcoats for elevated segments. Oil and gas remains the second largest end-use, with hydrogen pipelines demanding permeability coefficients <1 × 10⁻¹² cm²/s to avoid embrittlement. Mining relies on polyurethane liners that survive Taber wear of <50 mg per 1,000 cycles, protecting slurry pipes in ore concentrators.
Offshore-wind monopiles for 15-MW turbines face wave-impact pressures above 200 kPa and employ glass-flake-reinforced epoxies exceeding 3 GPa flexural modulus, reflecting growing innovation across the protective coatings market. Water-treatment plants favor phenolic-epoxy linings certified to NSF/ANSI 61 and pass 90-day immersion biofilm trials. Automotive, marine, and chemical processing together contributed 18% volume; marine hulls alone applied 120,000 t of antifouling coatings in 2025, while IMO rules are nudging owners toward silicone-based foul-release that can trim fuel by 4-6%.
Geography Analysis
Europe contributed 50.17% of global revenue in 2025 as North Sea asset maintenance, automotive OEM output, and stringent REACH rules converged, strengthening the protective coatings market. The revised Industrial Emissions Directive capped confined-space VOCs at 250 g/L, accelerating water-borne epoxies. Germany’s chemical sector is migrating to PFAS-free tank linings ahead of a 2027 cutoff, incurring EUR 2 million per product line in R&D outlays. UK Round 5 offshore leasing unleashed demand for 1,260 monopiles coated to NORSOK M-501, each using up to 15 t of three-layer systems. France and Italy’s metro expansions likewise specify sub-100 g/L water-borne acrylics, sidelining solvent-borne rivals.
Asia-Pacific is advancing at 5.33% CAGR in the protective coatings market on the back of China’s USD 900 billion infrastructure program, Taiwan’s 15-GW offshore-wind roadmap, and South Korea-India gigafactory pipelines. Belt-and-Road rail investments are drawing 8,000 t of fusion-bonded-epoxy rebar coatings on the Shenzhen-Zhanjiang line. Ørsted and Equinor’s Taiwanese monopiles demand polysiloxane topcoats retaining more than 80% gloss after 5,000-hour salt-fog. India foresees a 6.2% CAGR in protective demand as ductile-iron pipelines adopt epoxy linings, extending lifetimes to 50 years. Japan and South Korea pursue hydrogen networks requiring barrier coatings at a 30% price premium against atomic permeation.
North America, South America, and Middle East-Africa collectively supply a lower volume in the protective coatings market. US Gulf Coast LNG terminals under construction need cryogenic-rated phenolic epoxies for -162°C storage spheres. Canada’s oil-sands vessels run at 180°C, enforcing epoxy novolac standards. Mexico’s near-shoring boom lifts protective demand on stamping dies at 5.8% CAGR. Brazil’s pre-salt floating units use 20 MPa-pressure glass-flake epoxies. Saudi Arabia’s NEOM steel build-out remains a prime consumer of three-coat ISO 12944 C5-M systems, and South Africa’s slurry lines specify Shore A 85-95 polyurethane elastomers for abrasion control.


Competitive Landscape
The Protective Coatings market is moderately consolidated. Strategic levers include geographic expansion, VOC-compliant reformulation, and vertical integration into application services that bundle blasting, spraying, and QA inspection. PPG’s 2024 USD 320 million powder-coating acquisition underscores its zero-VOC pivot, while Sherwin-Williams’ USD 500 million Texas complex boosts water-borne epoxy output for LNG terminals. White-space innovation resides in hydrogen pipelines, where permeation-proof epoxy topcoats must flex yet block H₂ diffusion. Gigafactory floors also need coatings merging ESD control with NFPA 286 flame metrics.
Protective Coatings Industry Leaders
Akzo Nobel N.V.
Hempel A/S
Jotun
PPG Industries, Inc.
The Sherwin-Williams Company
- *Disclaimer: Major Players sorted in no particular order


Recent Industry Developments
- October 2025: PPG Industries, Inc. unveiled its latest innovation: the PPG ENVIROCRON Extreme Protection Edge Plus powder coating. This product is specifically designed to tackle the challenges of coating sharp edges, angles, and recesses, which are often encountered in heavy-duty equipment, HVAC systems, electrical components, and various industrial applications.
- April 2025: Akzo Nobel N.V. and IPG Photonics have partnered to utilize laser technology for curing powder coatings. The collaboration optimizes AkzoNobel's Interpon powder coating formulations for compatibility with IPG's laser curing solutions.


Research Methodology Framework and Report Scope
Market Definitions and Key Coverage
Our study treats the global protective coatings market as revenues generated from factory-made epoxy, polyurethane, acrylic, alkyd, and inorganic zinc formulations that are purpose-built to shield metallic or concrete substrates in infrastructure, oil and gas, power, marine, and heavy industrial settings from corrosion, abrasion, or chemical attack. Application routes such as brush, spray, and dip on newly fabricated or maintenance surfaces are included, while aftermarket repaint volumes are counted only once the full system is stripped and reapplied.
Scope exclusion: architectural décor paints, coil coatings, and thin film decorative varnishes fall outside our boundary.
Segmentation Overview
- By Resin Type
- Epoxy
- Polyurethane
- Vinyl Ester
- Polyester
- Alkyd
- Other Resins (Acrylic. Zinc-Rich, etc.)
- By Technology
- Solvent-borne
- Water-borne
- Powder
- Other Technologies (High-Solids, UV-Cured, etc.)
- By Substrate
- Metal
- Concrete
- Plastic and Composites
- Other Substrates (Wood, Glass, etc)
- By End-use Industry
- Oil and Gas
- Mining
- Power
- Infrastructure
- Other End-User Industries(Water Treatment, Chemicals and Petrochemicals, Automotive, Marine)
- By Geography
- Asia-Pacific
- China
- India
- Japan
- South Korea
- Rest of Asia-Pacific
- North America
- United States
- Canada
- Mexico
- Europe
- Germany
- United Kingdom
- France
- Italy
- Rest of Europe
- South America
- Brazil
- Argentina
- Rest of South America
- Middle-East and Africa
- Saudi Arabia
- South Africa
- Rest of Middle-East and Africa
- Asia-Pacific
Detailed Research Methodology and Data Validation
Primary Research
Analysts interviewed coating formulators, asset-integrity engineers, procurement heads at EPC contractors, and regional distributors across Asia-Pacific, North America, Europe, and the GCC. These interactions validated resin price spreads, verified duty-paid import uplifts, and tested service-life assumptions that desk research alone cannot surface.
Desk Research
We built the desk foundation around open datasets from sources such as the United States Geological Survey, Eurostat's PRODCOM output tables, Japan's JPaint Association shipment bulletins, China Customs HS-3208 export files, and peer-reviewed corrosion journals, which clarify volume trends in key resin chemistries. Company 10-K filings, investor decks, and regional infrastructure tender portals supply average selling prices, installed tankage volumes, and bridge refurbishment meters squared, enriching the volume-to-value bridge. Paid databases that Mordor analysts access, including D&B Hoovers for company splits and Dow Jones Factiva for press-led capacity moves, offer additional triangulation. The sources cited here are illustrative; many other credible repositories supported data checks and clarifications.
Market-Sizing & Forecasting
A top-down demand-pool construct converts national fixed-asset investment, offshore platform steel tonnage, and pipeline kilometer additions into likely surface area to be coated, which is then priced using weighted ASPs. Select bottom-up roll-ups of leading supplier revenues and distributor channel checks align or adjust totals. Key variables like crude-price driven capex cycles, epoxy resin feedstock differentials, steel output, and bridge maintenance budgets feed a multivariate regression that projects growth. Data gaps from smaller regions are back-filled by regional intensity proxies and verified with primary respondents.
Data Validation & Update Cycle
Model outputs pass three layers of anomaly checks, peer review, and senior sign-off. Mordor refreshes the database annually and triggers interim updates when raw material shocks, regulatory shifts, or force majeure events alter the baseline. A final analyst pass is completed just before publication.
Why Our Protective Coatings Baseline Commands Reliability
Published estimates inevitably differ; values swing when firms pick contrasting resin baskets, include partial maintenance coats, or extend forecasts with optimistic uptake curves.
Key gap drivers involve rivals' inclusion of decorative anti-graffiti films, reliance on aged 2021 ASPs, or single-region interviews, whereas Mordor's scope and live price cadence narrow statistical drift.
Benchmark comparison
| Market Size | Anonymized source | Primary gap driver |
|---|---|---|
| USD 15.85 B (2025) | Mordor Intelligence | - |
| USD 16.90 B (2025 est.) | Global Consultancy A | Broader scope captures 2K floor systems and coil lines |
| USD 16.04 B (2024) | Industry Publisher B | Forward casts via straight CAGR on 2020 baseline, limited primary checks |
| USD 13.11 B (2023) | Trade Journal C | Excludes power generation assets and applies solvent-only technology filter |
The comparison shows that once differing scopes, aged baselines, and narrower technology filters are normalized, Mordor's disciplined, annually refreshed approach delivers a balanced, transparent benchmark clients can trace to clear variables and repeat with confidence.


Page last updated on:


