Voyage Management Software Market Size and Share
Market Overview
| Study Period | 2019 - 2030 |
|---|---|
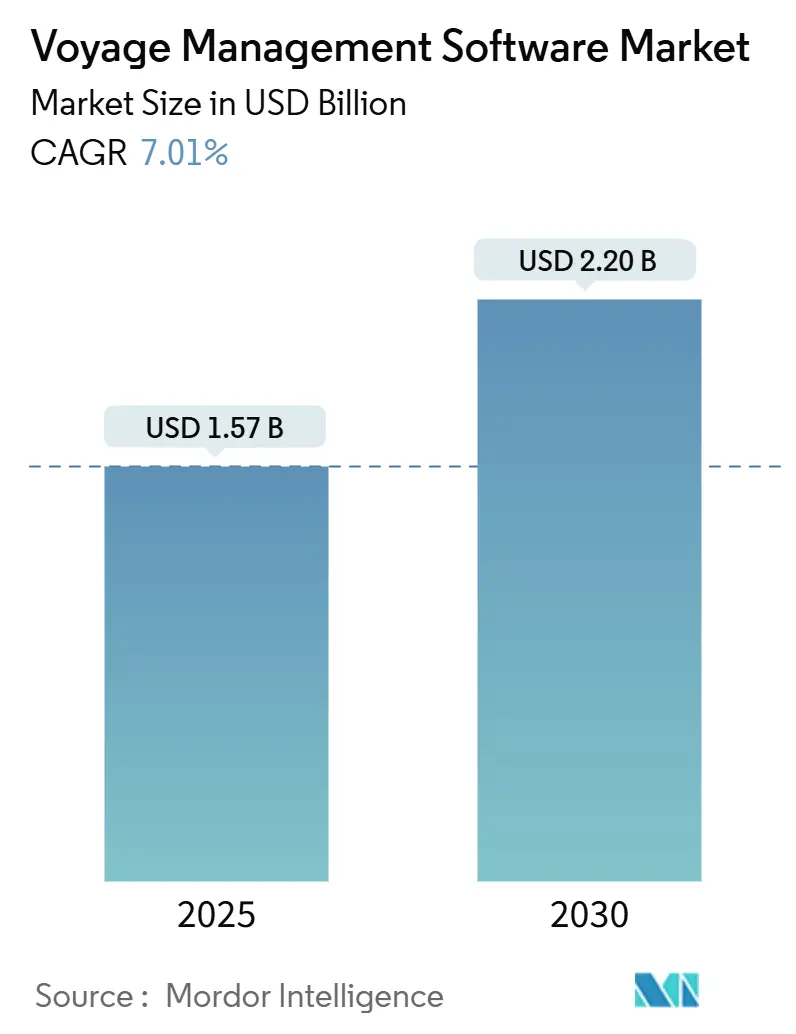
| Market Size (2025) | USD 1.57 Billion |
| Market Size (2030) | USD 2.20 Billion |
| Growth Rate (2025 - 2030) | 7.01% CAGR |
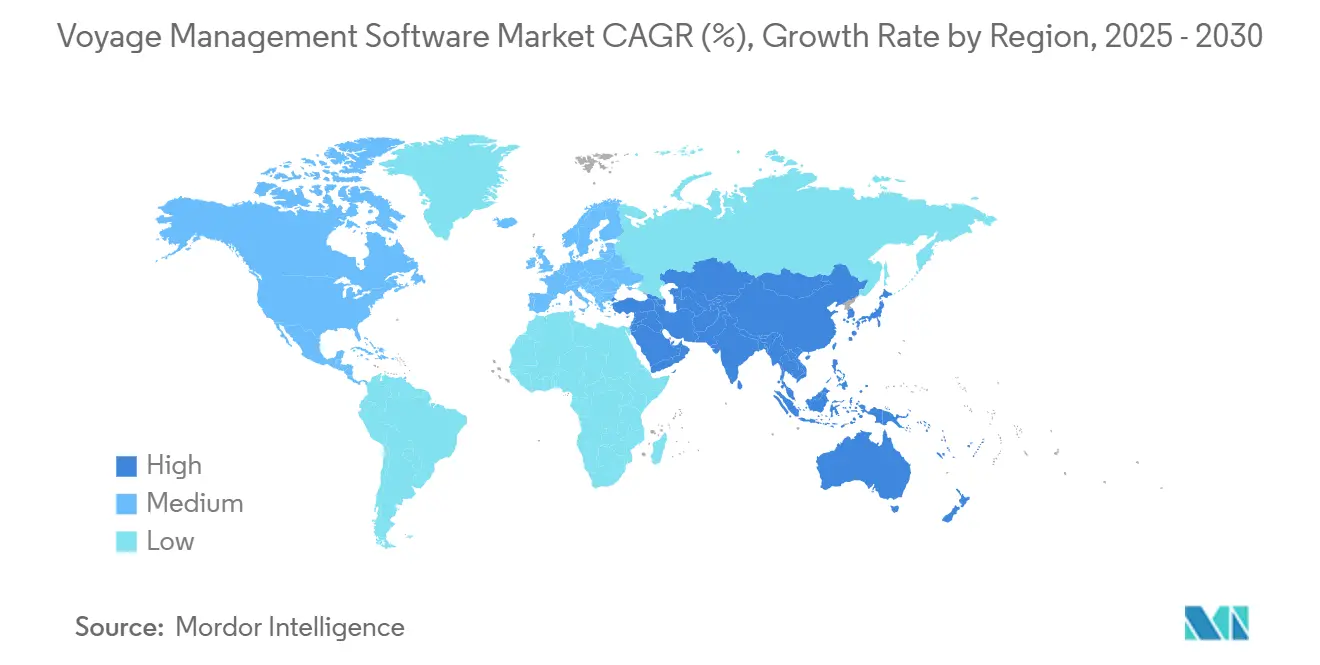
| Fastest Growing Market | Asia Pacific |
| Largest Market | North America |
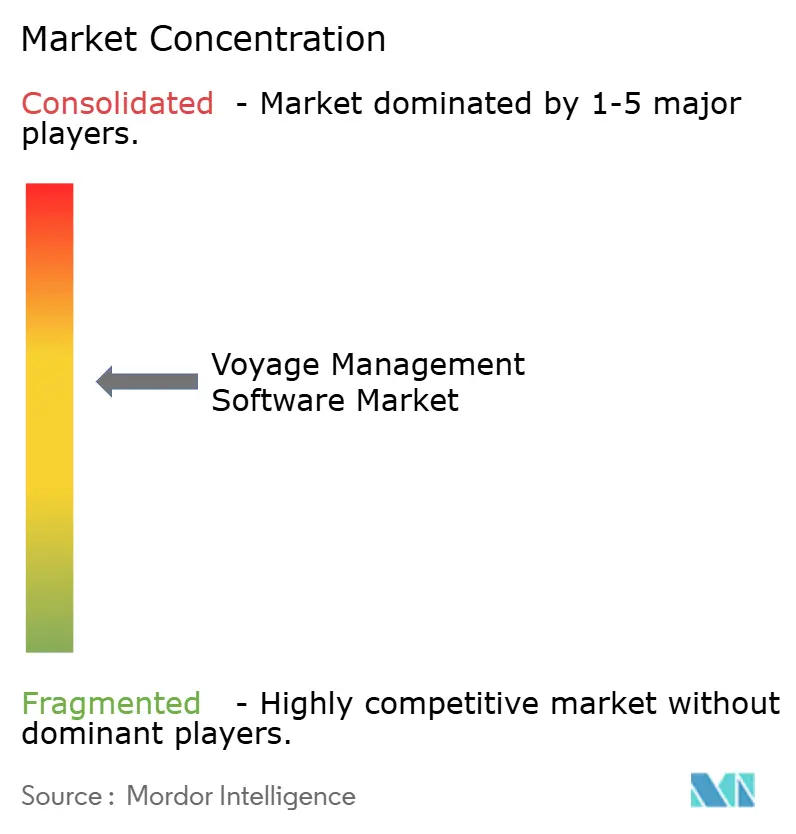
| Market Concentration | Medium |
Major Players *Disclaimer: Major Players sorted in no particular order Image © Mordor Intelligence. Reuse requires attribution under CC BY 4.0. | |
Voyage Management Software Market Analysis by Mordor Intelligence
The voyage management software market size stands at USD 1.57 billion in 2025 and is forecast to expand to USD 2.20 billion by 2030, registering a 7.01% CAGR over the period. This firmly places the voyage management software market on a steady upward path driven by mandatory decarbonization rules, volatile bunker costs, and the need for real-time operational intelligence. Operators are accelerating software roll-outs to comply with the IMO Carbon Intensity Indicator, the EU Emissions Trading System, and a widening array of national digital-reporting mandates. Vendors respond by embedding artificial intelligence, cloud-native architectures, and integrated SaaS business models that reduce total cost of ownership and shorten deployment times. Consolidation is gaining momentum through high-profile acquisitions that bundle weather routing, fuel optimization, and compliance reporting into unified platforms. Cyber-risk mitigation and the promise of predictive analytics continue to shape investment priorities as fleets pursue measurable fuel-saving outcomes while limiting exposure to ransomware incidents.
Key Report Takeaways
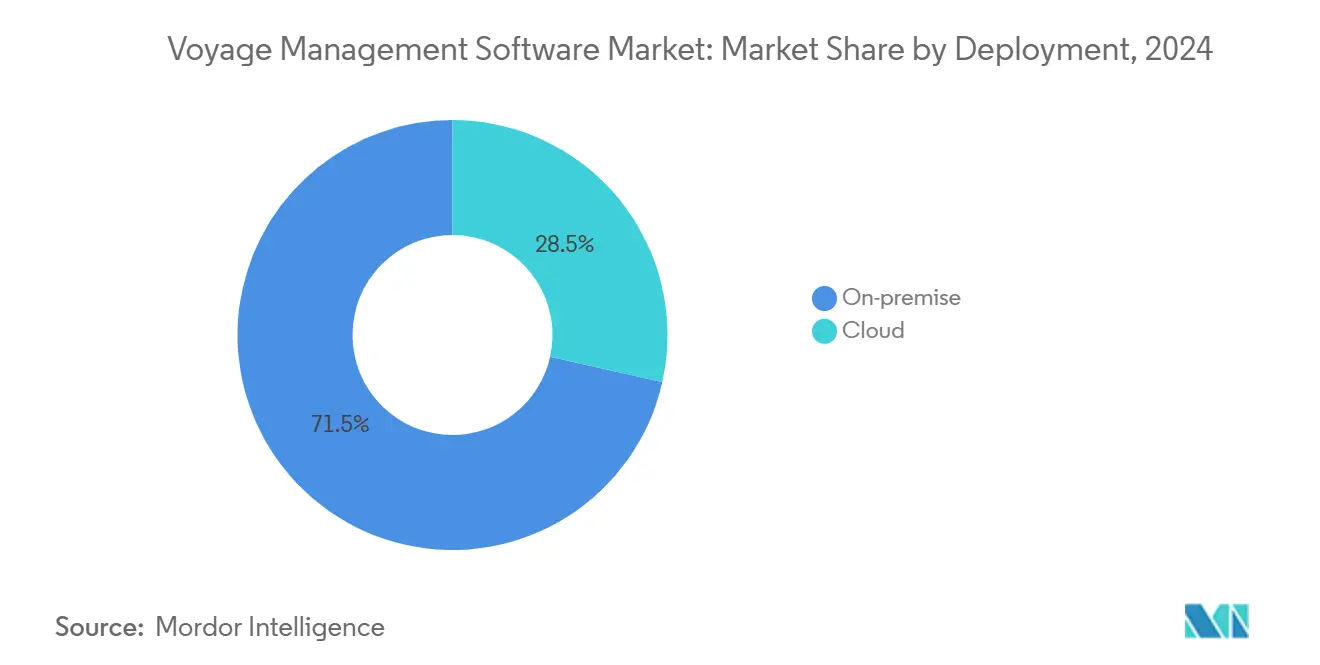
- By deployment, on-premise installations commanded 71.5% of the voyage management software market share in 2024, while cloud platforms are advancing at 9.0% CAGR to 2030, reflecting the market’s accelerating shift toward SaaS economics.
- By function, voyage planning led with 51.8% of the voyage management software market size in 2024; post-voyage analytics is projected to expand at 7.9% CAGR through 2030 as fleets prioritize data-driven performance reviews.
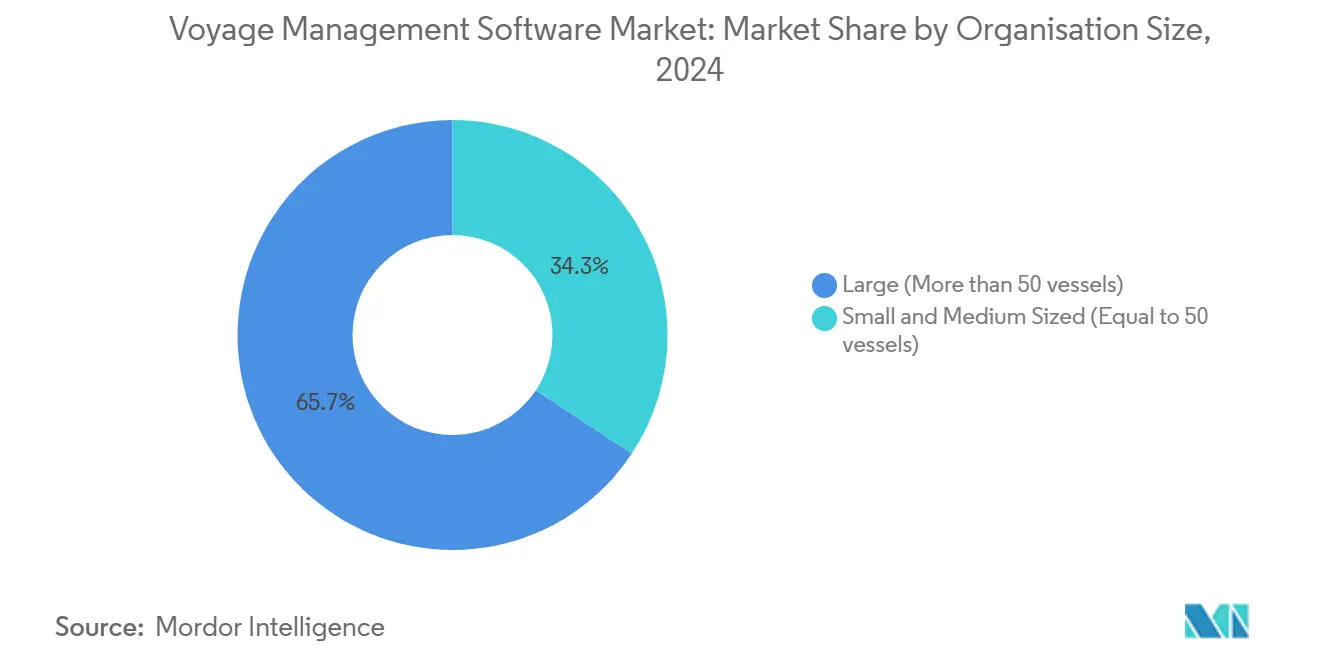
- By organisation size, fleets operating more than 50 vessels held 65.7% share of the voyage management software market size in 2024, whereas small and mid-sized owners are forecast to grow at 8.6% CAGR on the back of subscription-based offerings.
- By vessel type, container carriers captured 28.6% revenue share in 2024, while LNG/LPG carriers are set to grow at 7.4% CAGR owing to specialised cargo-handling and boil-off gas optimisation needs.
- By geography, North America maintained 37.4% of the voyage management software market share in 2024; Asia-Pacific is the fastest-growing region at 8.2% CAGR supported by China’s fleet digitalisation drive and Singapore’s smart-port policies.
Global Voyage Management Software Market Trends and Insights
Drivers Impact Analysis*
| Driver | (~) % Impact on CAGR Forecast | Geographic Relevance | Impact Timeline |
|---|---|---|---|
| Real-time route optimisation cuts bunker fuel consumption | +1.8% | Global, early uptake in North America and Europe | Medium term (2-4 years) |
| Rising ECDIS and IMO e-Navigation compliance requirements | +1.2% | Global, mandatory compliance | Short term (≤ 2 years) |
| Integrated SaaS platforms replacing stand-alone legacy systems | +1.5% | North America and Europe leading, APAC following | Medium term (2-4 years) |
| Cloud-native micro-service architectures lower total cost of ownership | +1.0% | Global, faster in developed markets | Long term (≥ 4 years) |
| AI-driven CII score optimisation | +0.9% | EU and North America first, expanding globally | Medium term (2-4 years) |
| Charter-party performance guarantees enforcement analytics | +0.7% | Global hubs | Long term (≥ 4 years) |
| Source: Mordor Intelligence | |||
Real-time Route Optimisation Cuts Bunker Fuel Consumption
Fuel accounts for 50-60% of voyage operating cost, so the ability to recalibrate a track in response to live weather, port congestion, and bunker-price spreads yields swift payback. Sofar Ocean’s Wayfinder delivers 3-15% fuel savings by combining high-resolution weather models, distributed sensor data, and AIS traffic feeds, resulting in 70% more accurate forecasts for users such as Eagle Bulk and Star Bulk. Fleet managers increasingly embed these dynamic routing engines directly into bridge ECDIS terminals and shore dashboards so that masters and operators share identical optimisation logic. The financial gains are amplified whenever slow steaming aligns with lower carbon-intensity scoring under IMO CII thresholds. As Low Earth Orbit satellite services reduce latency, real-time optimisation is evolving from daily to hourly course adjustments, tightening the linkage between voyage economics and software precision.
Rising ECDIS and IMO e-Navigation Compliance Requirements
SOLAS regulation V/19 mandates Electronic Chart Display and Information Systems for passenger ships over 500 GT and cargo ships above 3,000 GT on international voyages, with the latest 2022 performance standards calling for deeper system integration.[1]International Maritime Organization, “Performance Standards for Electronic Chart Display and Information Systems (ECDIS),” imo.orgRegulators now require continuous chart updates, auto-logging of position, and safety contour alerts, all of which push owners toward fully integrated voyage suites that streamline passage planning, route monitoring, and post-voyage reporting. The Oil Companies International Marine Forum lists ECDIS malfunctions among critical safety risks, underlining the need for robust software and crew proficiency. Vendors respond with cloud-based chart-management services that deliver global ENC updates and maintain immutable audit trails across entire fleets, simplifying compliance audits and port-state inspections.
Integrated SaaS Platforms Replacing Stand-alone Legacy Systems
The shift from siloed onboard applications to unified SaaS ecosystems simplifies data flows, eliminates manual re-entry, and cuts maintenance overheads. BASS Software’s BASSnet Web 3.0, launched in January 2025, integrates voyage planning, PMS, safety, and crewing modules within a single browser interface while embedding AI for anomaly detection. Subscription pricing removes the need for large capital outlays and automatic version upgrades counteract technology obsolescence. These advantages resonate with small and mid-sized owners who lacked the IT bandwidth to run complex on-premise stacks. As classification societies such as ABS and DNV certify cloud solutions, concerns around data sovereignty and cyber-insurance coverage are receding, reinforcing the SaaS adoption curve.
AI-driven CII Carbon Intensity Indicator Score Optimisation
Effective January 2024, ships rated D for three consecutive years or E in a single year must adopt corrective action plans, intensifying demand for software that can diagnose and remedy poor CII performance. DeepSea Technologies’ Cassandra secures DNV Type Approval for autonomous speed control and is rolled out fleet-wide by Eastern Pacific Shipping, proving that AI can continuously tweak throttle settings, trim, and route to deliver compliant emissions profiles. The technology analyses high-frequency sensor data and historical patterns to predict voyage-specific carbon outcomes, then recommends interventions that outperform rule-based models. As carbon levies under the EU ETS raise the cost of each emitted tonne, CII optimisation delivers direct financial returns, making it a board-level priority.
Restraints Impact Analysis*
| Restraint | (~) % Impact on CAGR Forecast | Geographic Relevance | Impact Timeline |
|---|---|---|---|
| Cyber-security vulnerabilities in OT/IT convergence | -1.3% | Global, highest in digitally advanced fleets | Short term (≤ 2 years) |
| High capex for fleet-wide retrofits in older vessels | -2.1% | Global, acute in ageing fleets | Medium term (2-4 years) |
| Data-sharing reluctance among competing carriers | -0.8% | Global, stronger on busy trade lanes | Medium term (2-4 years) |
| Bandwidth constraints on deep-sea VSAT/L-band links | -0.6% | Remote ocean routes | Long term (≥ 4 years) |
| Source: Mordor Intelligence | |||
Cyber-security Vulnerabilities in OT/IT Convergence
Maritime cyber incidents have soared 900% as attackers exploit the growing connectivity of bridge, engine, and business systems. IMO Resolution MSC.428(98) and the EU NIS2 directive compel owners to embed cyber-risk controls within safety management systems, yet many fleets lack the staff, tooling, and budgets for 24/7 monitoring. Phishing accounts for the majority of breaches, often leveraging crew email accounts to inject malware into navigation or propulsion networks. Successful attacks can disable ECDIS displays, corrupt sensor feeds, or lock critical files, forcing costly diversions and insurance claims. The resulting fear of exposure slows digital roll-outs, especially among small owners who struggle with cyber-insurance premiums.
High Capex for Fleet-wide System Retrofits in Older Vessels
Installing modern voyage suites on ships built before 2010 frequently requires new servers, cabling, and interface boards, driving costs close to 50% of residual vessel value. A Grieg Star study pegged ammonia-fuelling retrofits near USD 22 million per ship, highlighting the scale of digital plus green-tech spending on ageing tonnage. Docking time, integration testing, and crew training add to the bill, while charterers rarely compensate owners directly for such upgrades. As a result, owners prioritise newbuilds or targeted sensor packages instead of full-stack retrofits, slowing near-term market penetration.
*Our forecasts treat driver/restraint impacts as directional, not additive. The impact forecasts reflect baseline growth, mix effects, and variable interactions.
Segment Analysis
By Deployment: Cloud Transformation Accelerating
On-premise installations dominated 71.5% of the voyage management software market in 2024, a legacy of earlier bandwidth constraints and captain preference for locally controlled systems. However, cloud platforms are outpacing at 9.0% CAGR to 2030 as Low Earth Orbit constellations deliver sub-second latency and predictable bandwidth. The voyage management software market size for cloud deployments is projected to reach USD 880 million by 2030, underscoring the demand for continuously updated code bases and fleet-wide analytics dashboards.
Early adopters appreciate predictable monthly fees, zero-touch upgrades, and the ability to run AI models on aggregated fleet datasets. Hybrid roll-outs are common: core navigation logic remains on the bridge for resilience, while fuel-analysis and emissions reporting modules run in the cloud. Vendors report that security certifications, multi-factor authentication, and sovereign-cloud hosting in the EU remove many of the data-sovereignty objections that slowed migration only two years ago.


By Function/Module: Analytics Driving Growth
Voyage planning commanded 51.8% share of the voyage management software market size in 2024 thanks to proven fuel-saving ROI. Yet post-voyage analytics, although smaller, is expanding at 7.9% CAGR, riding stricter EU ETS and IMO DCS reporting rules that demand granular, auditable data sets. Analytics engines now blend noon-report data with high-frequency sensor and weather feeds, surfacing insights into hull fouling, trim, and auxiliary-engine efficiency that feed continuous-improvement loops.
Compliance dashboards map CO₂, CH₄, and NOₓ footprints to each cargo lot, supporting carbon-insetting contracts and green-freight marketing. Charter-party performance modules track laytime, speed adherence, and route deviations, automatically flagging claims or bonuses. As mature users push toward predictive maintenance and autonomous voyage planning, vendors bundle machine-learning modules that classify abnormal engine vibrations or turbines requiring cleaning, extending the value curve beyond navigation.
By Organisation Size: SME Adoption Accelerating
Large fleets (more than 50 vessels) deployed end-to-end platforms early, capturing 65.7% market share in 2024. Their size justifies integrated IT teams and bespoke interfaces into commercial and technical management systems. Small and mid-sized owners equal to 50 vessels are now the fastest adopters at 8.6% CAGR, attracted by entry-level SaaS tiers and managed-service options that bypass the need for onboard IT support.
Vendors offer “pay-as-you-sail” bundles where licence costs scale with sea-days, lowering seasonality risk for niche operators. Simplified cloud dashboards abstract the complexity of IMO data schema and automate ETS surrender calculations, letting lean teams comply without hiring specialist analysts. Financing models that bundle hardware, connectivity, and software into a single monthly lease further reduce adoption friction.
By End-user Vessel Type: Specialized Segments Emerging
Container lines accounted for 28.6% of revenue in 2024 as schedule reliability, port-call optimisation, and slot-allocation efficiency demanded sophisticated voyage suites. LNG/LPG carriers, while smaller, will post the highest 7.4% CAGR because boil-off gas management and cryogenic safety checks require tightly integrated sensor and voyage-planning software. The voyage management software market size assigned to LNG/LPG carriers is projected to more than double by 2030 as global LNG trade volumes surge and dual-fuel propulsion ascends.[2]DNV, “FuelBoss,” dnv.com
Bulk carriers and tankers adopt at steady rates, often driven by charterer requirements for CII reporting. In cruise and Ro-Pax, passenger-experience KPIs such as arrival punctuality and propulsion noise mapping feed into voyage modules, but recovery from pandemic slowdowns tempers short-term spending. Offshore support vessels lag due to subdued exploration budgets but present upside as wind-farm service fleets embrace just-in-time crew-transfer scheduling.
Geography Analysis
North America’s 37.4% lead springs from superior broadband coverage, an entrenched ecosystem of maritime-tech vendors, and early rules harmonisation between the US Coast Guard and classification societies. Large liner companies operating cross-country strings rely on cloud dashboards that knit together Pacific and Atlantic schedules. The Canadian market emphasises ice-route optimisation and polar-code compliance as Arctic cargo volumes inch up, whereas Mexican operators focus on integrated logistics links between ports and truck corridors.
Asia-Pacific’s 8.2% CAGR is fuelled by megayard newbuild activity and government-backed smart-port roll-outs. China’s Belt and Road coastal network incentivises owners to share real-time location and emissions data with port authorities, embedding voyage software into port-call optimisation loops. Singapore acts as a regional lighthouse, providing co-funding for digital twin pilots that cut anchorage wait times. Japan leverages its technology supply chain, embedding AI optimisation modules into LNG carriers that call at terminals across Asia and Europe.
Europe’s regulatory engine keeps demand consistent. The EU ETS, FuelEU Maritime, and the Maritime Single Window create recurring compliance workloads that elevate the value of SaaS reporting modules. Northern European owners lean on AI-driven speed recommendations to navigate ECAs, while Mediterranean operators prioritise fuel-cost cuts on long haul legs to Asia. Classification societies located in the region accelerate approvals and ensure rapid alignment between new rules and software features.

Competitive Landscape
Competition is moderate but intensifying as incumbents combine organic R&D with acquisition-led portfolio broadening. Lloyd’s Register’s purchase of Ocean Technologies Group adds training and competence modules to its voyage optimisation stack, capturing more of the crew-workflow spend.[3]LR OneOcean, “Lloyd’s Register to acquire Ocean Technologies Group,” oneocean.com ZeroNorth’s merger with Alpha Ori Technologies fuses fuel-optimisation algorithms with commercial voyage management, promising integrated charter-party compliance.
Kongsberg Digital differentiates via its Vessel Insight data pipe that streams 1,000+ parameters from ship to cloud, unlocking third-party app ecosystems. Wärtsilä Voyage leans on its integrated bridge and engine control heritage to devise fleet-wide digital twins that cut unplanned maintenance. Veson Nautical commands strong penetration in commercial freight workflows and now pairs with weather-routing specialists to deliver end-to-end voyage economics.
Challengers deploy AI to attack niche pain points. DeepSea Technologies focuses on autonomous speed control certified by DNV, winning Asian references. Windward expands maritime intelligence after its FTV Capital buyout, targeting charterers who need predictive ETA and risk scoring. Sedna’s acquisition of CompassAir blends email automation with voyage task management, promising single-click insights across sprawling inbox traffic.
Voyage Management Software Industry Leaders
OrbitMI, Inc.
Dataloy Systems AS
KONGSBERG Gruppen ASA
Wärtsilä Corporation
Veson Nautical LLC
- *Disclaimer: Major Players sorted in no particular order

Recent Industry Developments
- June 2025: GTT acquires Danelec for EUR 194 million, adding 17,000-vessel VDR and performance-analytics footprint.
- March 2025: StormGeo secures full ownership of Climatempo, strengthening climate-data services for routing.
- February 2025: Saipem and Subsea 7 announce USD 4.7 billion merger to form Saipem7, pooling 60 construction vessels.
- January 2025: BASS Software debuts cloud-native BASSnet Web 3.0 with embedded AI automation.


Global Voyage Management Software Market Report Scope
| Cloud |
| On-premise |
| Voyage Planning |
| Voyage Execution and Monitoring |
| Post-Voyage Analytics and Reporting |
| Compliance and Risk Management |
| Others |
| Large (More than 50 vessels) |
| Small and Medium Sized (Equal to 50 vessels) |
| Container Lines |
| Bulk Carriers |
| Tanker (Oil and Gas, Chemical) |
| LNG/LPG Carriers |
| Cruise and Ro-Pax |
| Off-shore Support Vessels |
| Others |
| North America | United States |
| Canada | |
| Mexico | |
| Europe | Germany |
| United Kingdom | |
| France | |
| Italy | |
| Spain | |
| Rest of Europe | |
| Asia-Pacific | China |
| Japan | |
| India | |
| South Korea | |
| Australia | |
| Rest of Asia-Pacific | |
| South America | Brazil |
| Argentina | |
| Rest of South America | |
| Middle East and Africa | Saudi Arabia |
| United Arab Emirates | |
| South Africa | |
| Egypt | |
| Rest of Middle East and Africa |
| By Deployment | Cloud | |
| On-premise | ||
| By Function / Module | Voyage Planning | |
| Voyage Execution and Monitoring | ||
| Post-Voyage Analytics and Reporting | ||
| Compliance and Risk Management | ||
| Others | ||
| By Organisation Size | Large (More than 50 vessels) | |
| Small and Medium Sized (Equal to 50 vessels) | ||
| By End-user Vessel Type | Container Lines | |
| Bulk Carriers | ||
| Tanker (Oil and Gas, Chemical) | ||
| LNG/LPG Carriers | ||
| Cruise and Ro-Pax | ||
| Off-shore Support Vessels | ||
| Others | ||
| By Geography | North America | United States |
| Canada | ||
| Mexico | ||
| Europe | Germany | |
| United Kingdom | ||
| France | ||
| Italy | ||
| Spain | ||
| Rest of Europe | ||
| Asia-Pacific | China | |
| Japan | ||
| India | ||
| South Korea | ||
| Australia | ||
| Rest of Asia-Pacific | ||
| South America | Brazil | |
| Argentina | ||
| Rest of South America | ||
| Middle East and Africa | Saudi Arabia | |
| United Arab Emirates | ||
| South Africa | ||
| Egypt | ||
| Rest of Middle East and Africa | ||


Key Questions Answered in the Report
How large is the voyage management software market in 2025?
It is valued at USD 1.57 billion with a forecast to reach USD 2.20 billion by 2030.
What is the expected CAGR for voyage management platforms through 2030?
The market is projected to grow at 7.01% CAGR, driven by decarbonization, fuel-cost pressures, and integrated SaaS adoption.
Which deployment model is gaining momentum among shipowners?
Cloud-based SaaS is advancing at 9.0% CAGR as owners capitalise on lower up-front costs and automatic upgrades.
Why are LNG/LPG carriers adopting voyage software fastest?
Gas carriers need specialised boil-off gas and cryogenic safety optimisation, driving a 7.4% CAGR in software spend.
Which region shows the quickest growth trajectory?
Asia-Pacific leads with 8.2% CAGR, propelled by China’s fleet expansion and Singapore’s smart-port programmes.
What primary cyber-risk challenges confront maritime digitalisation?
Rapid OT/IT convergence exposes vessels to ransomware and phishing, making robust cyber-risk frameworks essential under IMO MSC.428(98).
Page last updated on:


