
Market Overview
| Study Period | 2020 - 2031 |
|---|---|
| Market Size (2026) | USD 4.01 Billion |
| Market Size (2031) | USD 8.16 Billion |
| Growth Rate (2026 - 2031) | 15.27 % |
| Fastest Growing Market | Asia Pacific |
| Largest Market | North America |
| Market Concentration | High |
Major Players *Disclaimer: Major Players sorted in no particular order Image © Mordor Intelligence. Reuse requires attribution under CC BY 4.0. | |
Speech Analytics Market Analysis by Mordor Intelligence
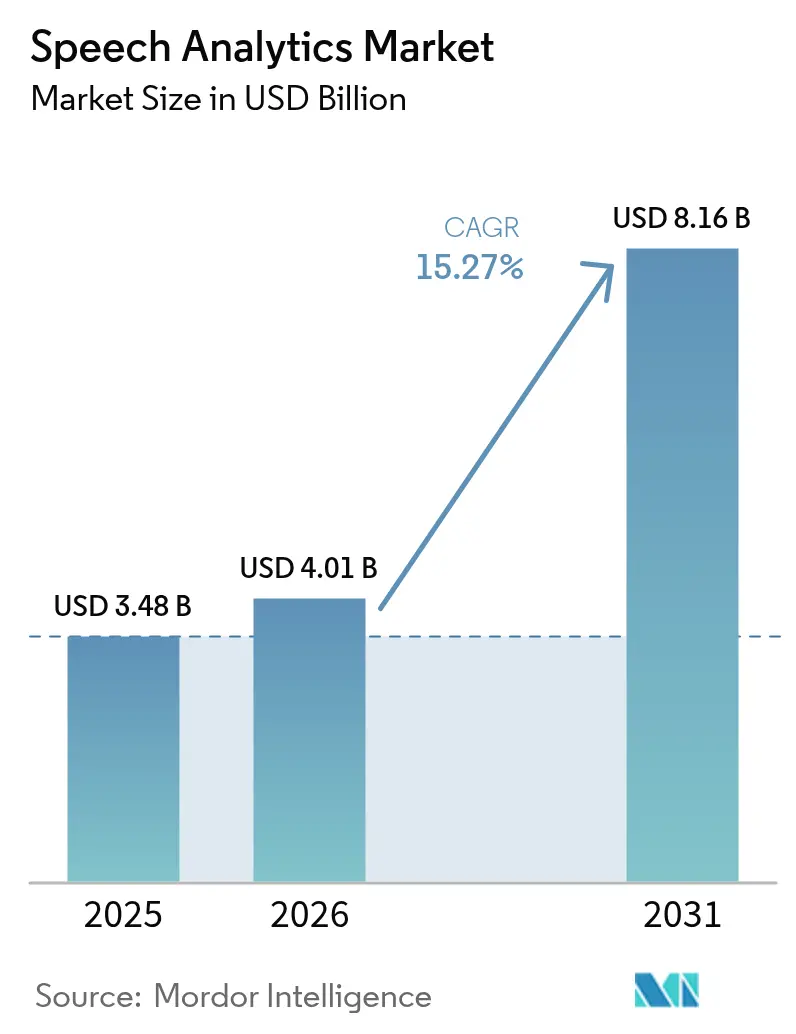
The speech analytics market size is expected to grow from USD 3.48 billion in 2025 to USD 4.01 billion in 2026 and is forecast to reach USD 8.16 billion by 2031 at 15.27% CAGR over 2026-2031. Momentum is building around cloud-first customer-experience programs, AI transcription accuracy above 95%, and end-to-end compliance demands that now make voice data a board-level priority. Leading vendors continue to embed speech analytics in broader customer-experience suites, pushing adoption beyond quality-assurance teams into sales, compliance, and executive decision-making functions. Competitive intensity is rising as technology giants fold analytics into their cloud ecosystems, while specialist start-ups emphasise real-time agent assist and industry-ready language models. These shifts are accelerating cloud deployments, fuelling demand for implementation services, and widening the addressable base of small and mid-sized enterprises that previously lacked the resources to invest.
Key Report Takeaways
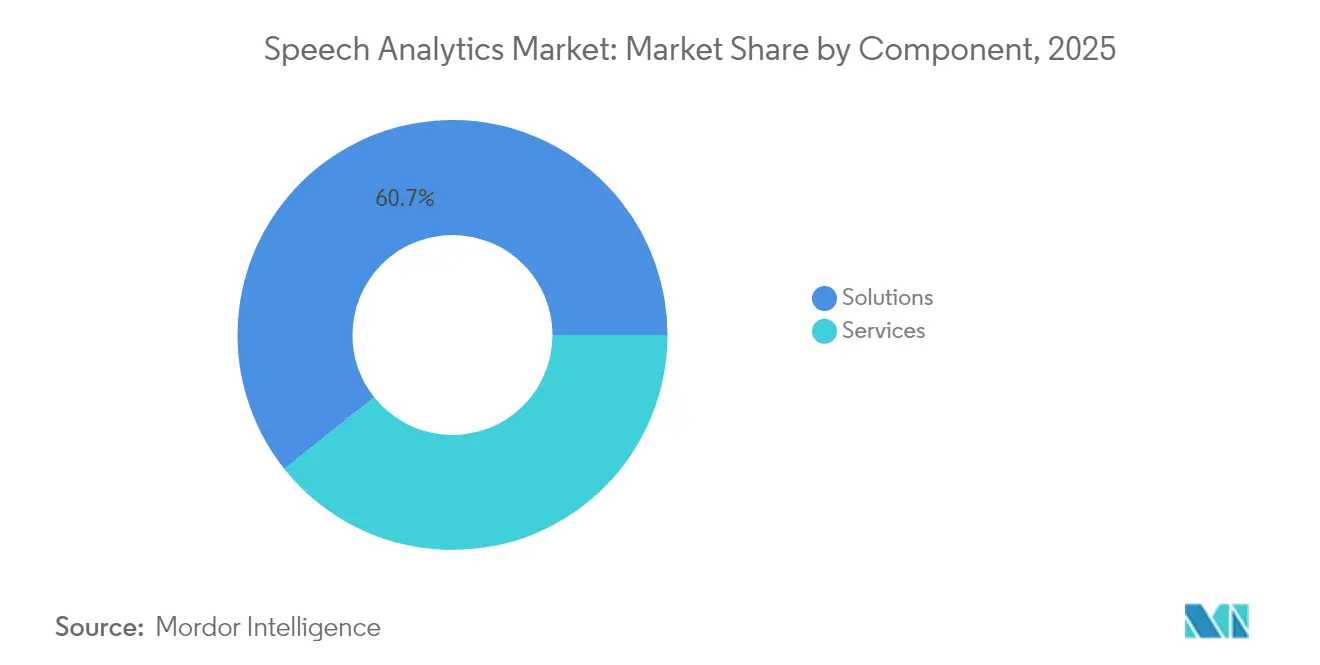
- By component, Solutions held 60.70% of the speech analytics market share in 2025, while Services are forecast to expand at a 19.05% CAGR through 2031.
- By deployment model, on-premise installations accounted for 59.70% share of the speech analytics market size in 2025; cloud/SaaS is growing fastest at a 20.35% CAGR to 2031.
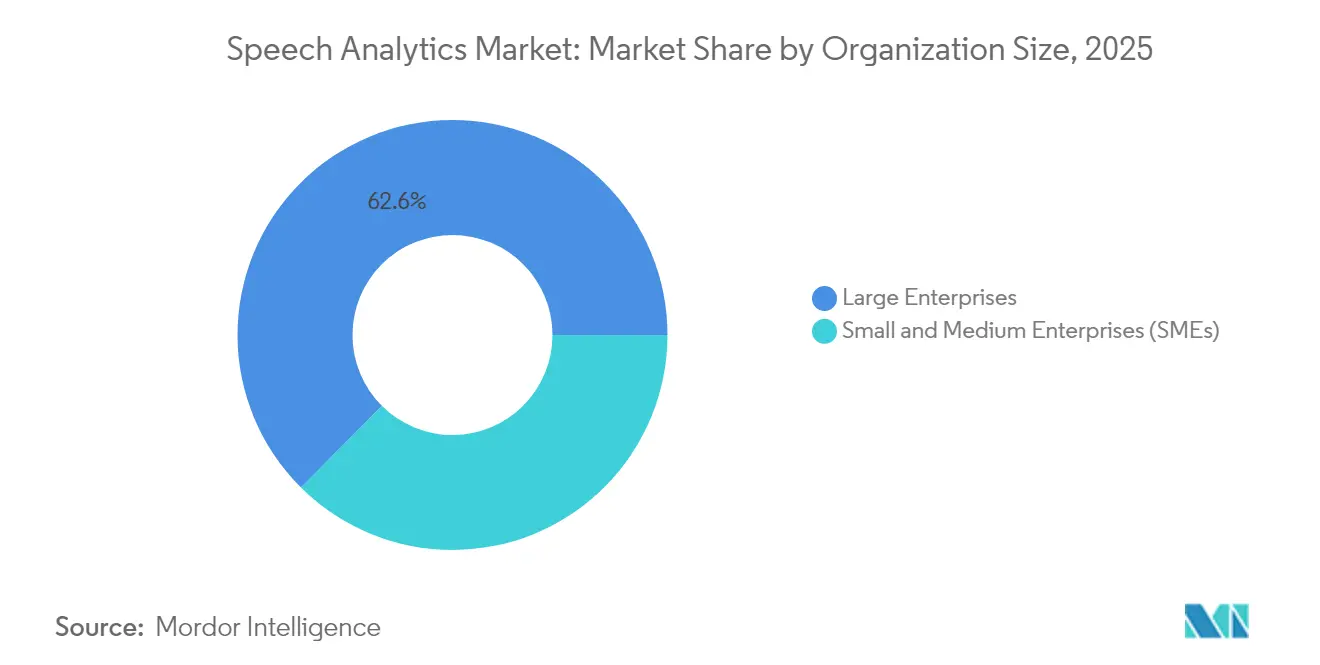
- By organisation size, large enterprises commanded 62.55% of the speech analytics market in 2025, whereas SMEs are set to grow at a 17.35% CAGR over the forecast window.
- By application, Customer Experience Management contributed 40.10% share of the speech analytics market size in 2025, with Sentiment Analysis leading growth at a 20.95% CAGR through 2031.
- By end-user industry, the BFSI sector led with 28.95% speech analytics market share in 2025, while Healthcare is advancing at a 17.10% CAGR to 2031.
- By geography, North America dominated with a 44.60% share of the speech analytics market in 2025, whereas APAC is projected to register the fastest growth at a 18.55% CAGR.
Note: Market size and forecast figures in this report are generated using Mordor Intelligence’s proprietary estimation framework, updated with the latest available data and insights as of 2026.
Market Trends and Insights
Drivers Impact Analysis of Speech Analytics Market*
| Driver | (∼) % Impact on CAGR Forecast | Geographic Relevance | Impact Timeline |
|---|---|---|---|
| Cloud-first CX transformation in contact centres | +3.5% | North America, Europe, APAC core | Medium term (2-4 years) |
| AI-powered real-time transcription accuracy ≥ 95% | +4.2% | Global | Short term (≤ 2 years) |
| Regulatory demand for 100% call-record compliance | +2.8% | North America, Europe, developed APAC | Medium term (2-4 years) |
| Omnichannel analytics bundling (speech + text + video) | +2.1% | North America, Europe | Medium term (2-4 years) |
| Surge in "agent assist" micro-apps sold via CCaaS marketplaces | +1.8% | Global | Short term (≤ 2 years) |
| Telco 5G network-exposed APIs enabling low-latency edge analytics | +1.5% | North America, developed APAC | Long term (≥ 4 years) |
| Source: Mordor Intelligence | |||
Cloud-First CX Transformation Accelerates Analytics Adoption
Organisations migrating contact-centre workloads to the cloud are no longer analysing a token sample of calls; they now review every interaction, creating larger datasets for pattern recognition and proactive service improvements. Capital-expense barriers have receded, enabling mid-market firms to deploy advanced analytics without long procurement cycles. Vendors are bundling speech analytics into unified CX suites, smoothing workflow integration and cutting implementation timelines. This shift also promotes consumption-based pricing, opening the speech analytics market to smaller teams that prefer operational over capital budgets. As cloud ecosystems mature, integration with adjacent AI services such as intent prediction and sentiment scoring becomes turnkey, accelerating enterprise-wide adoption.[1]NICE, “What Is a Cloud Contact Center Platform?” nice.com
AI-Powered Transcription Accuracy Unlocks Enterprise-Wide Use Cases
Word-error rates below 4% have turned speech analytics from a quality-assurance tool into a strategic business system. Higher accuracy supports sentiment detection, real-time agent coaching, and automated compliance checks in heavily regulated industries. Deep-learning models now handle dialects, noisy environments, and domain-specific terminology with minimal human tuning, reducing operational costs. Enterprises extend speech analytics to sales enablement and executive-level communication analysis, broadening value capture. This technical leap positions speech analytics as a foundation for conversational intelligence platforms that fuse voice, text, and video data into a single analytic layer.
Regulatory Compliance Drives Comprehensive Call Recording
Financial-services and healthcare regulators require complete capture and monitoring of customer conversations, making speech analytics a compliance necessity. The ability to flag sensitive phrases in real time allows firms to intervene before breaches occur, reducing fine exposure and reputational risk. Vendors embed pre-built rule sets aligned to Dodd-Frank, MiFID II, HIPAA, and PCI-DSS, shortening deployment cycles for compliance teams. Demand is strongest in jurisdictions with active enforcement histories, pushing consistent spending even during budget constraints. Compliance use cases often justify enterprise-wide rollouts, creating anchor deployments that later expand into customer-experience optimisation.
Omnichannel Analytics Creates Unified Journey Insights
Customers move between voice, chat, and video channels during a single issue-resolution cycle, so enterprises need analytics that follow the full journey. Integrating speech analytics with text and video engines reveals hidden patterns in escalation paths and emotional pivots, guiding proactive service interventions. Generative AI summarises conversations, helping agents grasp intent quickly and provide consistent responses across touchpoints. Omnichannel data also feeds journey-level KPIs that senior leaders use to refine product and service design. Vendors that deliver a unified analytic framework strengthen customer loyalty by enabling faster, context-aware support.
Restraints Impact Analysis of Speech Analytics Market*
| Restraint | (∼) % Impact on CAGR Forecast | Geographic Relevance | Impact Timeline |
|---|---|---|---|
| High implementation & custom-tuning costs | -2.1% | Global, more pronounced in emerging markets | Short term (≤ 2 years) |
| Data-privacy concerns (GDPR, CPRA, PCI-DSS) | -1.6% | Europe, North America, developed APAC | Medium term (2-4 years) |
| Scarcity of annotated domain-specific audio in low-resource languages | -1.3% | APAC, Middle East, Africa | Medium term (2-4 years) |
| "Model collapse" risks when large LLMs retrain on synthetic speech | -1.1% | Global | Long term (≥ 4 years) |
| Source: Mordor Intelligence | |||
Implementation Costs Create Adoption Barriers
Licensing fees, language-model training, and integration services still strain mid-market budgets, delaying projects and limiting scope. Many firms underestimated the staff hours required for continuous optimisation as product vocabularies evolve. Cloud subscriptions ease capital commitments but do not eliminate the need for skilled analysts who translate insights into process changes. Despite falling infrastructure prices, professional-services demand remains high because speech analytics deployments touch multiple systems, including CRM, workforce management, and compliance archives. Vendors address the gap with packaged accelerators and automated configuration wizards, yet total cost of ownership remains a gating factor for first-time adopters.
Data-Privacy Regulations Complicate Implementation
GDPR, CPRA, and similar frameworks require explicit consent management, granular role-based access, and automated redaction of sensitive data. Multinational firms must comply with overlapping rulesets, increasing deployment complexity and legal oversight costs. Privacy engineering has become a core feature of modern speech analytics platforms, adding encryption-at-rest, key-management options, and on-demand transcript deletion. Vendors offering pre-certified compliance modules gain a competitive edge, but lingering uncertainty over evolving regulations can still stall purchase decisions, especially in heavily regulated verticals.
*Our forecasts treat driver/restraint impacts as directional, not additive. The impact forecasts reflect baseline growth, mix effects, and variable interactions.
Speech Analytics Market Segment Analysis
By Component:
Services Gain Momentum Amid Rising ComplexityThe speech analytics market size for component solutions stood at USD 2.11 billion in 2025, reflecting a 60.70% share that underscores the centrality of core technology to adoption cycles. Services, however, are closing the gap as organisations recognise that accurate insights depend on specialised integration, custom model training, and workflow redesign. Between 2026 and 2031, service revenue is expected to log a 19.05% CAGR, outpacing product sales as enterprises prioritise actionable outcomes over feature checklists.
Consultancies and managed-service providers align analytics outputs with key performance indicators, reinforcing the speech analytics market’s shift from tool-centric to value-centric selling. As cloud deployments accelerate, customers lean on partners to migrate historical audio archives, configure security controls, and provide change-management support. These factors collectively elevate services from an optional add-on to a decisive purchase driver, especially among firms lacking in-house data science talent.



By Deployment Model:
Cloud Takes Share from On-PremiseOn-premise architectures retained a 59.70% speech analytics market share in 2025, supported by legacy investments and stringent data-sovereignty rules in finance and healthcare. Yet cloud subscriptions are growing at a 20.35% CAGR, signalling a decisive pivot toward elasticity, frequent feature updates, and simplified integrations.
The speech analytics market size for cloud deployments is swelling as vendors bundle real-time analytics, storage, and AI model updates into pay-as-you-go tiers. Mid-market organisations with limited capital budgets welcome the shift, while global enterprises favour the ability to standardise across regions without duplicating infrastructure. Regulatory resistance is easing as hyperscale providers earn compliance certifications, further boosting migration momentum.
By Organisation Size:
SMEs Move from Experimentation to ScaleLarge enterprises generated 62.55% of speech analytics market revenue in 2025 by leveraging complex contact-centre estates and high-stake compliance mandates. SMEs, though smaller in absolute terms, are expanding their share quickly, advancing at a 17.35% CAGR through 2031.
Low-code integration connectors, packaged dashboards, and usage-based billing reduce entry barriers for firms with lean IT teams. Vendors also offer vertical templates that compress deployment timelines, enabling SMEs to benefit from sentiment analysis, quality monitoring, and agent assist without building data science teams. As competition intensifies, small firms view speech analytics as a cost-effective lever for customer-experience differentiation and retention.
By Application:
Sentiment Analysis Becomes the Growth EngineCustomer Experience Management retained a 40.10% share of the speech analytics market size in 2025, reflecting its status as the anchor use case. Sentiment Analysis, however, is projected to expand at a 20.95% CAGR, outstripping other application lines.
Advances in acoustic emotion detection let contact centres intervene during emotionally charged conversations, lowering churn and boosting upsell acceptance. Retailers use aggregated sentiment trends to adjust product lines, while banks apply emotion scoring to detect potential complaints before they escalate. As generative AI summarises call emotions for post-interaction follow-up, sentiment capabilities differentiate platforms in competitive bids.
By End-User Industry:
Healthcare Jumps Ahead on Experience and Compliance GoalsThe BFSI sector led the speech analytics market with a 28.95% share in 2025, driven by mandatory call recording and risk controls. Healthcare is moving faster, set to post a 17.10% CAGR as providers leverage voice insights to improve patient-access centres, clinical documentation, and compliance with privacy rules.
Hospitals tie sentiment feedback to nurse-call programmes, identify stress markers in clinical hotlines, and automate coding for insurance claims. Telehealth growth further amplifies voice-data volumes, making speech analytics integral to virtual-care strategies. Vendors respond by releasing medical-terminology language packs and HIPAA-certified hosting options, fuelling sector-specific expansion.
Geography Analysis
North America Speech Analytics Market
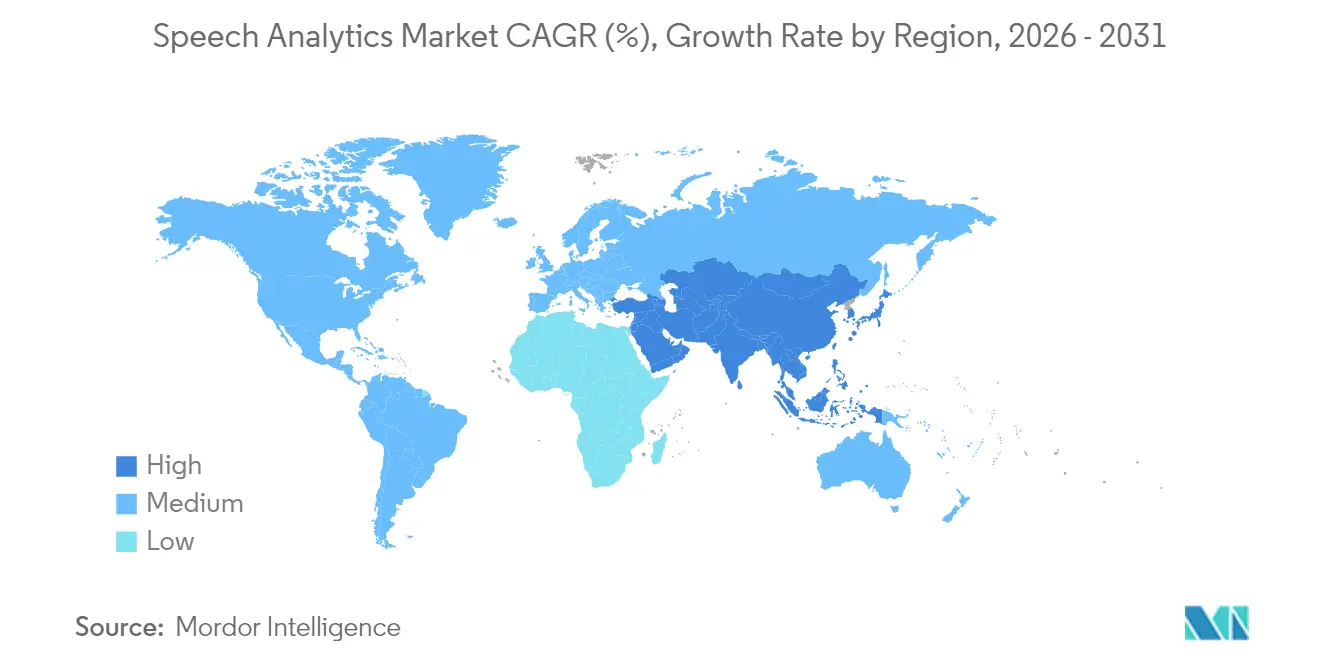
North America ranked first with 44.60% speech analytics market share in 2025, anchored by mature cloud ecosystems, high digital-service penetration, and strict compliance mandates in finance and healthcare. Ongoing investments focus on omnichannel journey analytics and real-time agent-assist tools, both of which rely on low-latency transcription and sentiment scoring. United States enterprises, in particular, allocate larger budgets to transform legacy contact centres into AI-enabled engagement hubs, extending the region’s leadership position.
APAC Speech Analytics Market
APAC is the fastest-growing territory with a projected 18.55% CAGR to 2031, led by China, Japan, and India. Government-backed AI programmes and rapid expansion of service-sector outsourcing create fertile ground for cloud-native deployments. Chinese banks embed voice analytics into super-apps, Japanese insurers use it to counter shrinking workforces, and Indian BPOs adopt it to monitor agent quality across multilingual queues F5. Local vendors collaborate with global partners to localise language models, accelerating adoption across high-growth industries.
Europe Speech Analytics Market
Europe sits between the two, with substantial opportunity tempered by data-protection stringency. GDPR compliance drives demand for solutions that automate consent management, redaction, and regional data residency. The United Kingdom leads adoption, followed by Germany and France, each applying speech analytics to differentiate customer service in crowded retail and telecom markets. Spain’s surge in voice-ad-spend underscores growing commercial interest in voice-channel intelligence, foreshadowing broader uptake across continental enterprises.

Regulatory Landscape
Speech analytics deployments are being shaped by AI governance and communications compliance requirements that affect how voice data is collected, processed, and acted upon. In the European Union, Regulation (EU) 2024/1689, enacted in June 2024, creates obligations around transparency and documentation for certain AI uses, with key provisions becoming applicable from 2 August 2026. This timing is likely to influence feature design decisions for functions such as emotion inference and automated decision support in contact centers.
In the United States, robocall mitigation and call authentication oversight continue to drive controls across voice ecosystems feeding analytics. The FCC issued proposals in 2026 that expand scrutiny of upstream provider verification and evaluate broader customer protections, reinforcing the need for audit trails and monitoring that can integrate with call authentication and compliance workflows. In parallel, standards work such as ITU-T Recommendation Q.4072 (June 2024) provides monitoring parameters for intelligent speech in future networks, supporting governance expectations across vendors and operators.
Competitive Landscape
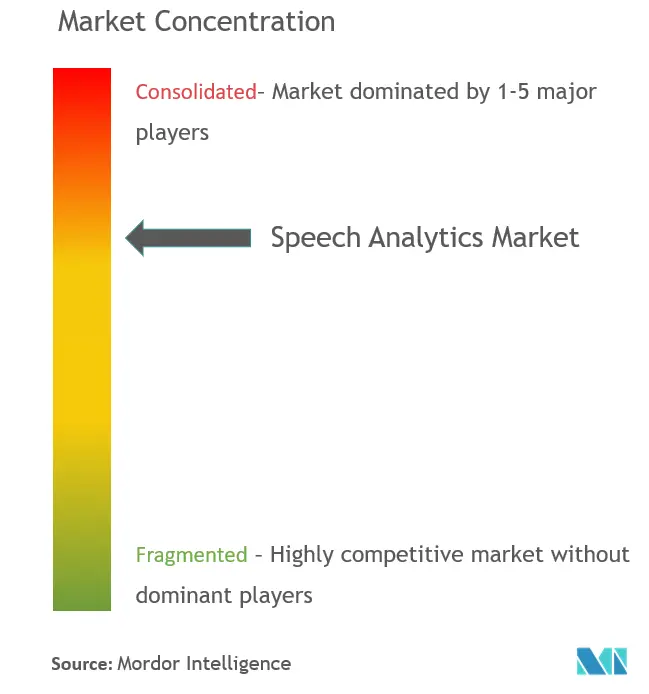
The speech analytics market shows moderate concentration. NICE Ltd. leads with 7.48% share, capitalising on an end-to-end engagement platform and deep AI research pipelines. Cloud hyperscalers—Amazon, Google, and Microsoft—bundle analytics into contact-centre offerings, commoditising baseline transcription and pushing price pressure downward. Mid-tier vendors respond by specialising in regulated industries, focusing on pre-trained vocabularies and compliance dashboards to preserve margins.
Competition also pivots around AI differentiation. Uniphore integrated generative AI to summarise calls and recommend next-best actions, illustrating the shift toward outcome-oriented insights.[3]Uniphore, “Uniphore Launches AI-Powered Interaction Analytics,” uniphore.com Start-ups like ElevenLabs refine voice-generation and analysis in low-resource languages, targeting media-localisation and customer-service niches. Observe.AI and Deepgram hone in on contact-centre quality and real-time agent assist, stealing share from legacy point-product suppliers.
Strategic moves cluster around vertical packaging, ecosystem partnerships, and geographic expansion. Vendors court telecom operators to host edge-based analytics via 5G APIs, while healthcare-oriented players seek HIPAA-ready hosting credentials. Funding flows mirror these priorities: total voice-AI investment multiplied eightfold in 1H 2025, signalling sustained innovation appetite despite macro-economic volatility.[4]PYMNTS, “Voice AI Funding Surges 8X as Businesses Humanize Chatbots,” pymnts.com
Speech Analytics Industry Leaders
Verint System Inc.
Avaya Inc.
Micro Focus International PLC
Genesys Telecommunications
Callminer Inc.
- *Disclaimer: Major Players sorted in no particular order
Speech Analytics Market Companies Covered in this Report
- NICE Ltd.
- Verint Systems Inc.
- Avaya Inc.
- Genesys Telecommunications Laboratories Inc.
- Micro Focus International PLC
- CallMiner Inc.
- Calabrio Inc.
- OpenText Corp.
- Talkdesk Inc.
- AWS (Amazon Transcribe / Contact Lens)
- Google Cloud (Contact Center AI and Speech-to-Text)
- IBM (Watson Speech Services)
- Uniphore
- Clarabridge (Qualtrics)
- Observe.AI
- LiveVox Holdings Inc.
- Cogito Corp.
- VoiceBase Inc. (LivePerson Inc.)
- Raytheon BBN Technologies
- CallRail Inc.

Market Opportunities and Future Outlook
A near-term whitespace is compliance-grade, explainable speech analytics that can document consent, data provenance, and decision logic across jurisdictions, particularly as the EU AI Act becomes applicable from 2 August 2026. This compliance pull pushes buyers in regulated verticals to prioritize platforms with built-in documentation, policy controls, and auditable workflows embedded into speech pipelines.
In 2026, market activity is shifting toward real-time, workflow-executing capabilities that convert speech signals into operational actions. NICE announced Agentic Analytics (June 2026), Five9 released AI Agent Studio architecture for Voice AI Agents (June 2026), and Verint introduced intelligence modules connecting conversational signals to desktop and workforce activity (June 2026). These launches expand integration opportunities for agent assist, automated quality management, and cross-system orchestration, especially in cloud deployments where vendors can ship frequent model updates while supporting regulated data handling.
Recent Industry Developments in Speech Analytics Market
- June 2026: NICE announced Agentic Analytics, introducing an agent-centric AI operating model that embeds real-time guidance into agent workflows. The development expands AI's role in customer engagement and complements NICE's existing agent assist capabilities within its CX platform.
- June 2026: Five9 released AI Agent Studio, a new architecture for Voice AI Agents that enables orchestration of intelligent agents across cloud contact center deployments. This broadens the path for AI-powered automation across multi-channel environments.
- June 2026: Verint introduced new intelligence modules that connect conversational signals to desktop and workforce activity, enabling tighter automation and analytics integration within Verint's intelligence suite. The update extends how conversation insights can be tied to downstream operational systems.


Speech Analytics Market Report Scope and Research Methodology
Market Definition and Coverage
For this study, the speech analytics market covers software and related services that capture and analyze spoken conversations (live or recorded) to produce insights for business use, mainly in customer interaction and contact center settings.
Scope exclusions: We exclude pure text analytics that does not process voice audio, and we also exclude basic call recording tools that do not provide analytics outputs.
Segments Covered in This Report
- By Component
- Solutions
- Services
- By Deployment Model
- On-Premise
- Cloud / SaaS
- By Organization Size
- Large Enterprises
- Small and Medium Enterprises (SMEs)
- By Application
- Customer Experience Management
- Call Monitoring and Quality Management
- Risk and Compliance Management
- Sales and Marketing Intelligence
- By End-User Industry
- BFSI
- Telecommunications and IT
- Healthcare
- Retail and E-commerce
- Government and Public Sector
- Travel and Hospitality
- Others
- By Geography
- North America
- United States
- Canada
- Mexico
- South America
- Brazil
- Argentina
- Rest of South America
- Europe
- United Kingdom
- Germany
- France
- Russia
- Rest of Europe
- Asia-Pacific
- China
- India
- Japan
- South Korea
- Rest of Asia-Pacific
- Middle East
- Israel
- Saudi Arabia
- United Arab Emirates
- Turkey
- Rest of Middle East
- Africa
- South Africa
- Egypt
- Rest of Africa
- North America
Data Sources, Market Sizing, and Validation
Desk Research
Desk research was used to set the market boundaries, understand adoption patterns, and build the base demand story across regions. We relied on public and official references such as IT and telecom statistics from bodies like the ITU, digital economy indicators from sources such as the World Bank and OECD, and cybersecurity and data protection guidance from regulators.
We also reviewed product documentation, press releases, investor presentations, and annual filings to understand how speech analytics is packaged (cloud versus on-premise) and where revenues usually sit in a customer experience stack. Patent databases were used to sanity check feature evolution, for example real time transcription, sentiment, and compliance flags, and a paid subscription for company financials and news was used selectively to cross-check revenue direction and major contract announcements. These examples are not exhaustive, and many other sources were referred to for data collection, validation, and research clarification.
Primary Interviews and Surveys
Primary work focused on interviews and surveys with solution providers, systems integrators, and enterprise users running contact centers or customer experience programs. We covered demand across APAC, EMEA, and the Americas so that adoption assumptions, pricing trends, and the deployment mix could be checked against what practitioners described in active buying cycles.
Distribution of primary research fieldwork respondents
| Company type | Respondent position | Region |
|---|---|---|
| Top tier: 29% | CXOs: 19% | APAC: 42% |
| Mid tier: 50% | Functional/Unit leaders: 23% | EMEA: 33% |
| Smaller Players: 21% | Managers: 58% | Americas: 25% |
Market-Sizing & Forecasting
Sizing was built using top-down and bottom-up logic. In the top-down build, we reconstruct a reachable spending pool by linking contact center and customer experience technology budgets to the penetration rate of speech analytics, and then split totals by deployment mode and industry usage patterns.
To keep the numbers grounded, the totals were corroborated with selective bottom-up checks, such as sampled vendor and channel revenue signals, typical price-per-seat or price-per-minute ranges, and inferred volumes from agent seat counts and interaction loads. When direct inputs were missing for smaller countries or emerging verticals, we used proxy indicators and then adjusted them after expert feedback.
Forecasting mainly used scenario analysis, because adoption is sensitive to cloud migration pace, AI transcription accuracy improvements, compliance pressure, and integration demand with broader customer experience platforms. Inputs that mattered most included contact center agent base growth, share of cloud deployments, regulated-industry mix, average contract durations, and typical upsell of analytics modules over time.
Data Validation & Update Cycle
Outputs were checked through triangulation across independent signals, and then reviewed for year-on-year variance that did not match known demand drivers. If an abnormal jump showed up, for example a sudden deployment mix change or a pricing swing, the assumption was revisited and relevant experts were re-contacted before sign-off.
Reports are refreshed annually, and interim updates are completed when material events occur, such as major regulatory actions or rapid shifts in enterprise cloud adoption. Before delivery, an analyst runs a fresh pass on the model so clients receive the most current view that can be traced back to the clearest available inputs.
Mordor Intelligence's Global Speech Analytics Market Market Size Versus Other Published Estimates
Published speech analytics market values often differ because each publisher draws the market boundary differently and also chooses different base years and adoption assumptions. The spread usually comes from what is counted as speech analytics versus adjacent contact center software, and from how pricing is treated when cloud subscriptions bundle multiple modules.
The table shows a visible gap across sources, and in Mordor Intelligence's model the number is built by counting speech analytics as the dedicated voice capture and insight layer (software plus related services), rather than folding in broader customer experience suite revenue that can sit outside speech-driven analytics usage.
Benchmark comparison
| Source | Market Size | Gaps in Research Methodology |
|---|---|---|
| Mordor Intelligence | USD 4.01 B (2026) | |
| Global Consultancy A | USD 3.22 B (2024) | Uses an earlier base year and a narrower realized adoption view, which can undercount fast-growing cloud deployments and newer use cases like real time agent assist. |
| Industry Publisher B | USD 5.70 B (2026) | Appears to include a wider bundle of contact center or customer experience platform revenue, which inflates the total when add-on modules and suite pricing are treated as speech analytics. |
Overall, the differences can be explained by timing and scope, especially around whether suite revenues and bundled subscriptions are included. Our approach stays repeatable by tying totals to contact center demand indicators, validated adoption rates, and practical pricing checks that can be re-tested in each update cycle.


Key Questions Answered in the Report
How fast is the speech analytics market growing?
The market is advancing at a 15.27% CAGR from USD 4.01 billion in 2026 to USD 8.16 billion by 2031.
Which deployment model is gaining traction?
Cloud/SaaS deployments are expanding at a 20.35% CAGR, steadily eroding the 59.70% share held by on-premise systems in 2025.
Why are services outpacing solutions in growth?
Enterprises rely on specialised implementation and optimisation support, driving services to a 19.05% CAGR as deployments become more complex.
Which application is the fastest growing?
Sentiment Analysis leads with a 20.95% CAGR, reflecting rising demand for emotional-intelligence insights in customer interactions.
What is driving adoption in the healthcare sector?
Providers use speech analytics to enhance patient experiences, streamline clinical documentation, and ensure HIPAA compliance, supporting a 17.10% CAGR in healthcare.
Who are the leading vendors in the market?
NICE Ltd. holds the largest share at 7.48%, while cloud hyperscalers and AI-focused start-ups intensify competitive dynamics.
Page last updated on:


 Your data is secure and never sold or shared.


