Vitamin D Therapy Market Size and Share
Market Overview
| Study Period | 2020 - 2031 |
|---|---|
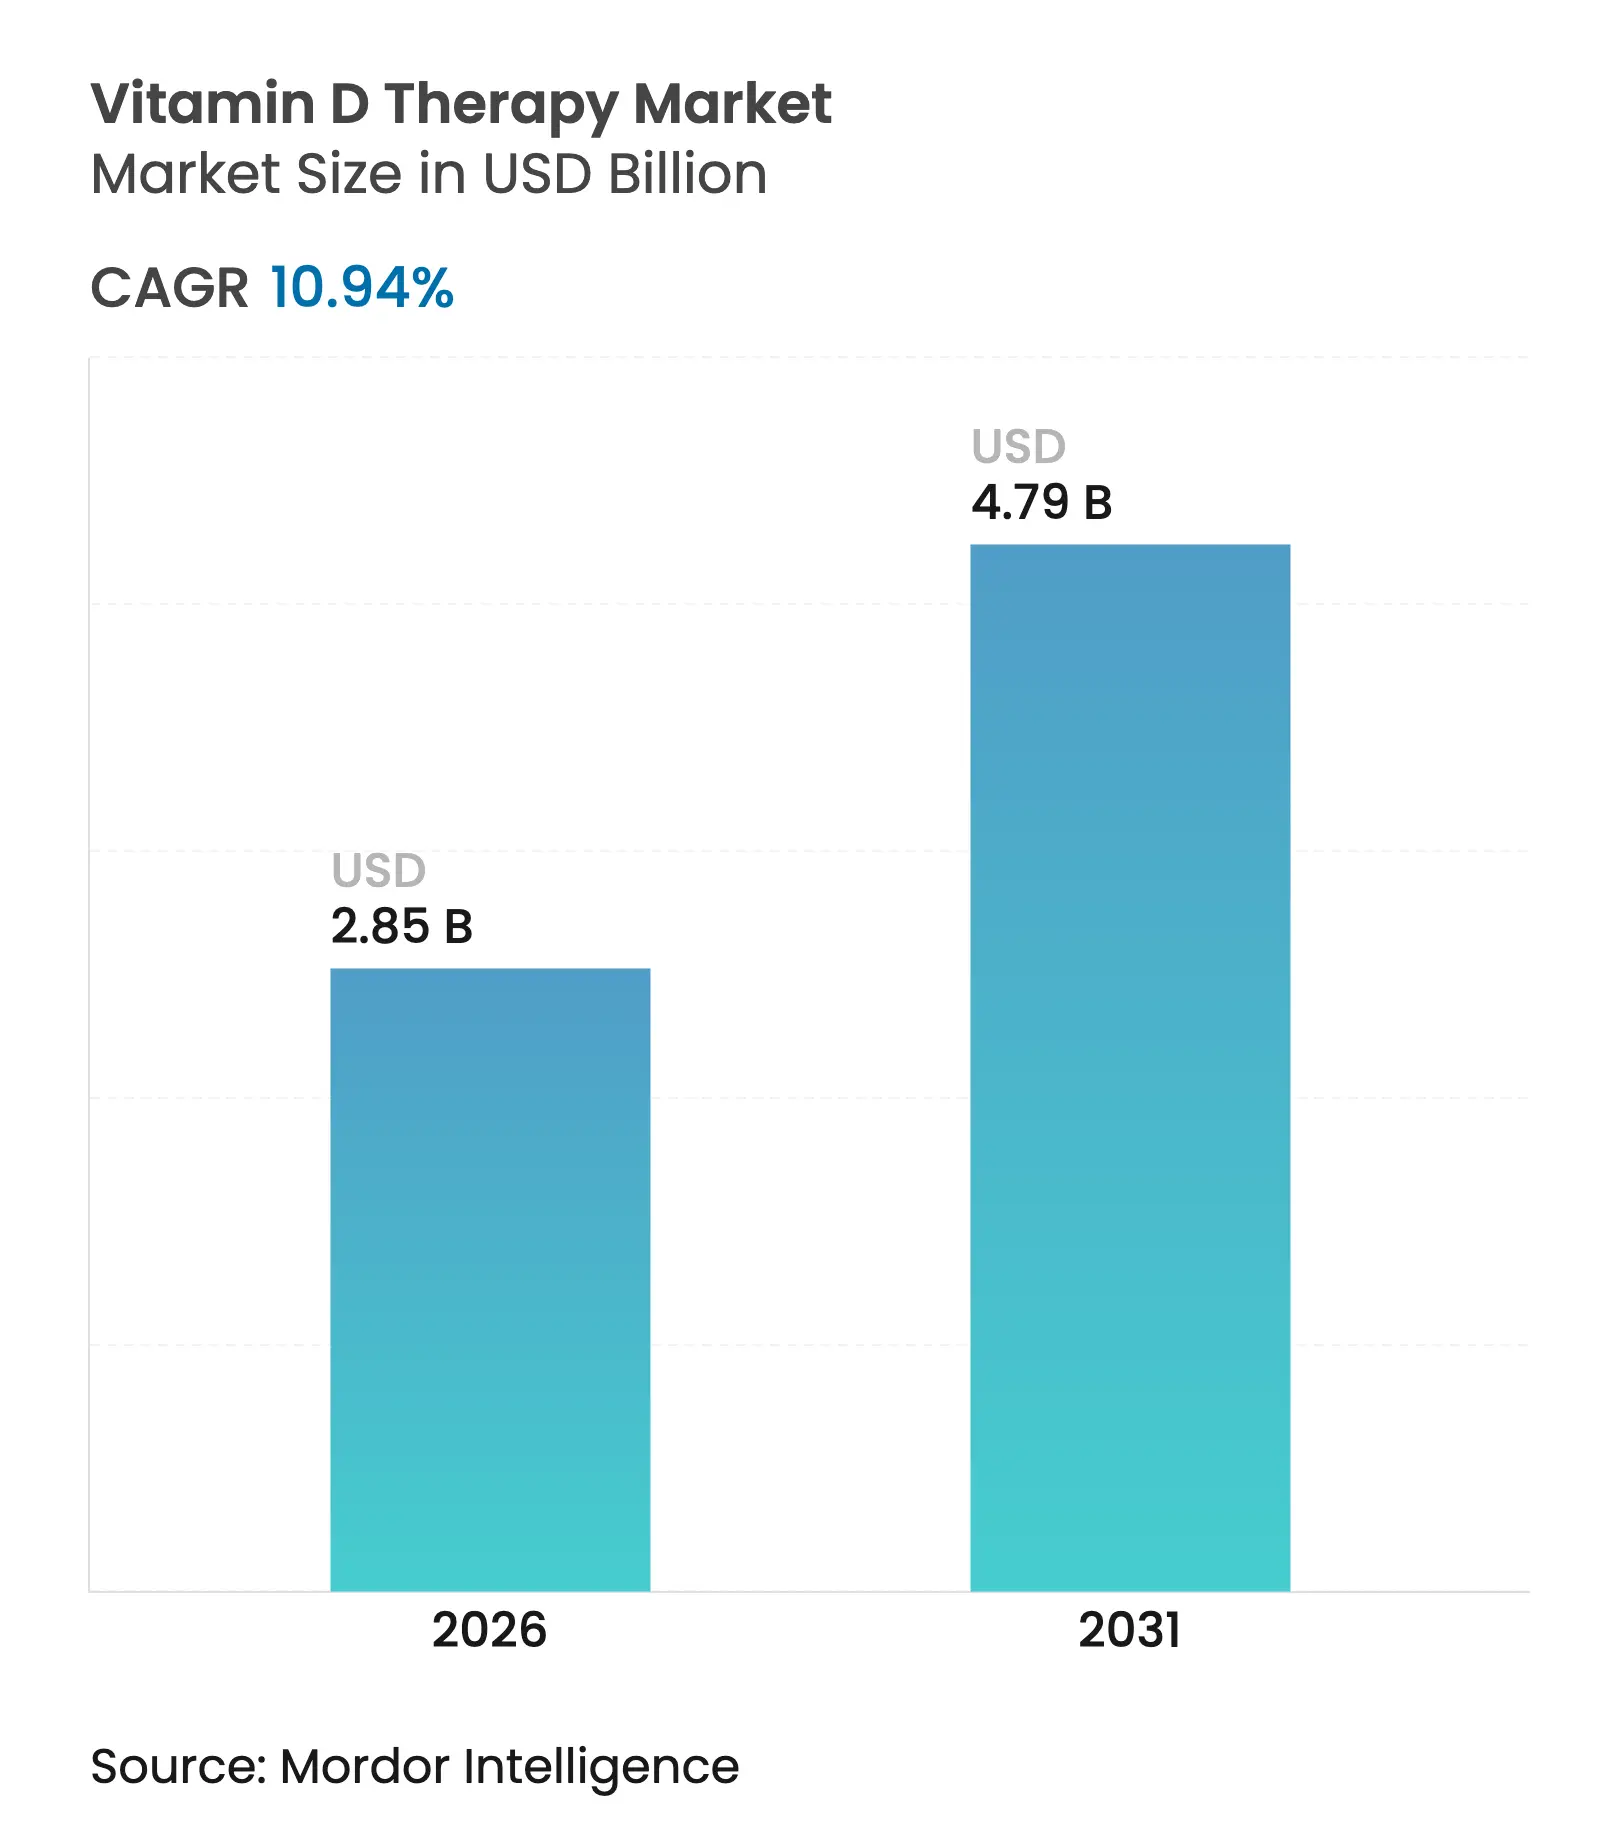
| Market Size (2026) | USD 2.85 Billion |
| Market Size (2031) | USD 4.79 Billion |
| Growth Rate (2026 - 2031) | 10.94 % CAGR |
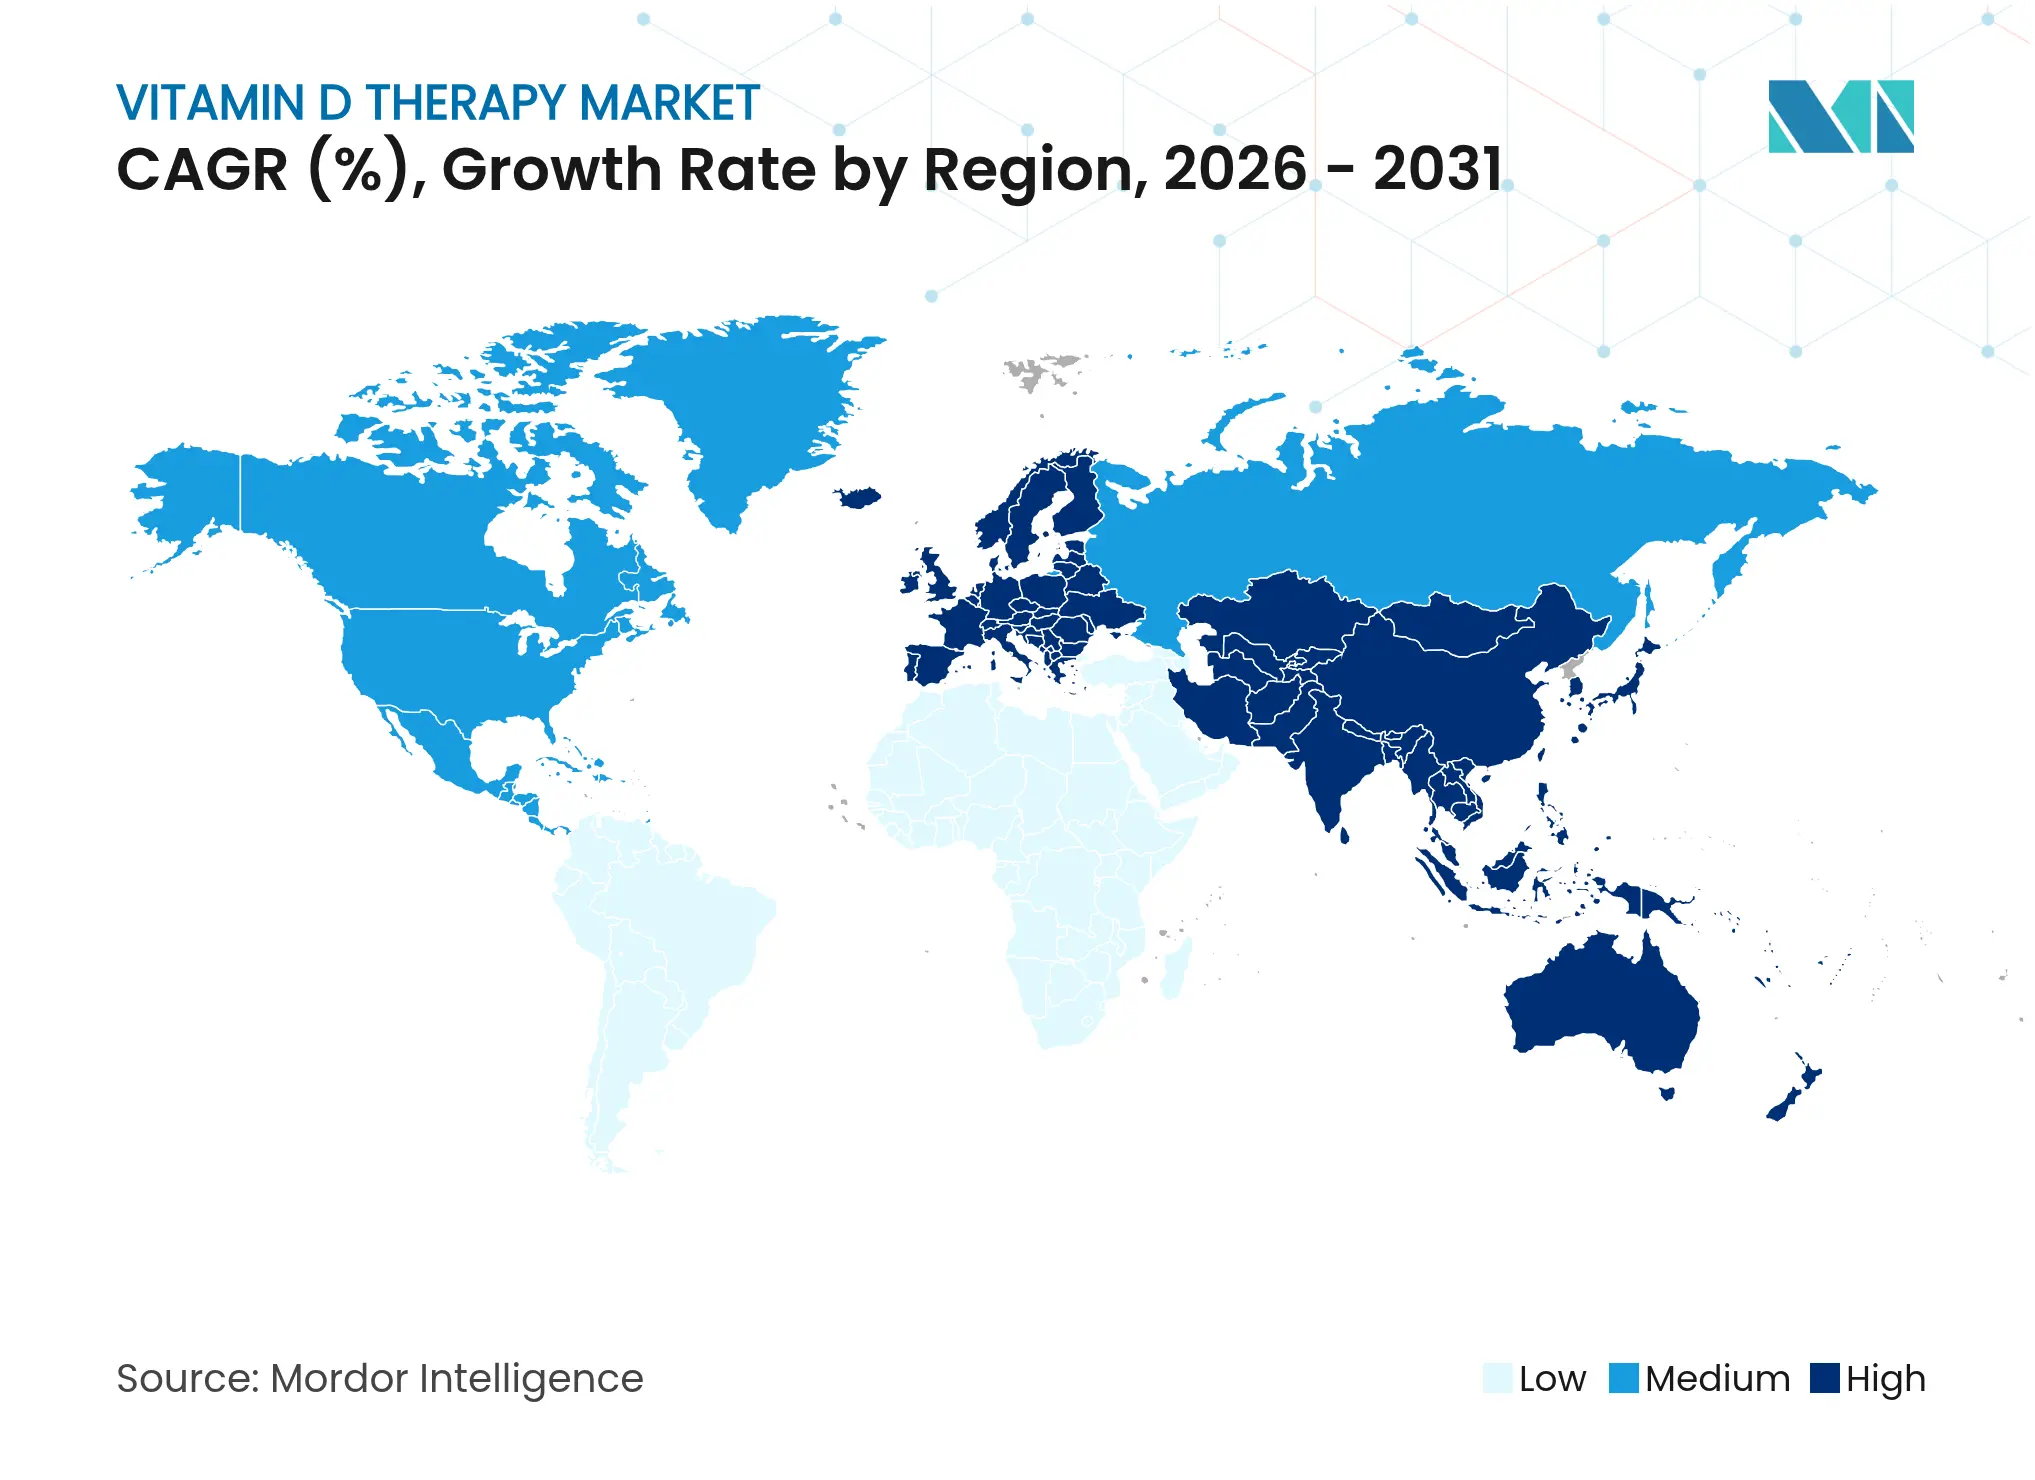
| Fastest Growing Market | Asia Pacific |
| Largest Market | North America |
| Market Concentration | Medium |
Major Players *Disclaimer: Major Players sorted in no particular order. Image © Mordor Intelligence. Reuse requires attribution under CC BY 4.0. |
Vitamin D Therapy Market Analysis by Mordor Intelligence
The vitamin D therapy market size was valued at USD 2.57 billion in 2025 and estimated to grow from USD 2.85 billion in 2026 to reach USD 4.79 billion by 2031, at a CAGR of 10.94% during the forecast period (2026-2031). The shift from reactive supplementation toward proactive clinical management is accelerating as mounting evidence links deficiency with autoimmune, cardiovascular, and immune dysfunction. Intensifying supply-chain pressures on 7-dehydrocholesterol have boosted investment in genetically engineered yeast fermentation and alternative D2 sources, supporting resilience despite raw-material volatility. Tight integration of home testing with personalized dosing platforms is redefining adherence, while government-backed public-health campaigns anchor demand in emerging economies. Competitive momentum now centers on bioavailability-enhanced calcifediol and depot injectable formats that address absorption limitations across vulnerable populations.
Key Report Takeaways
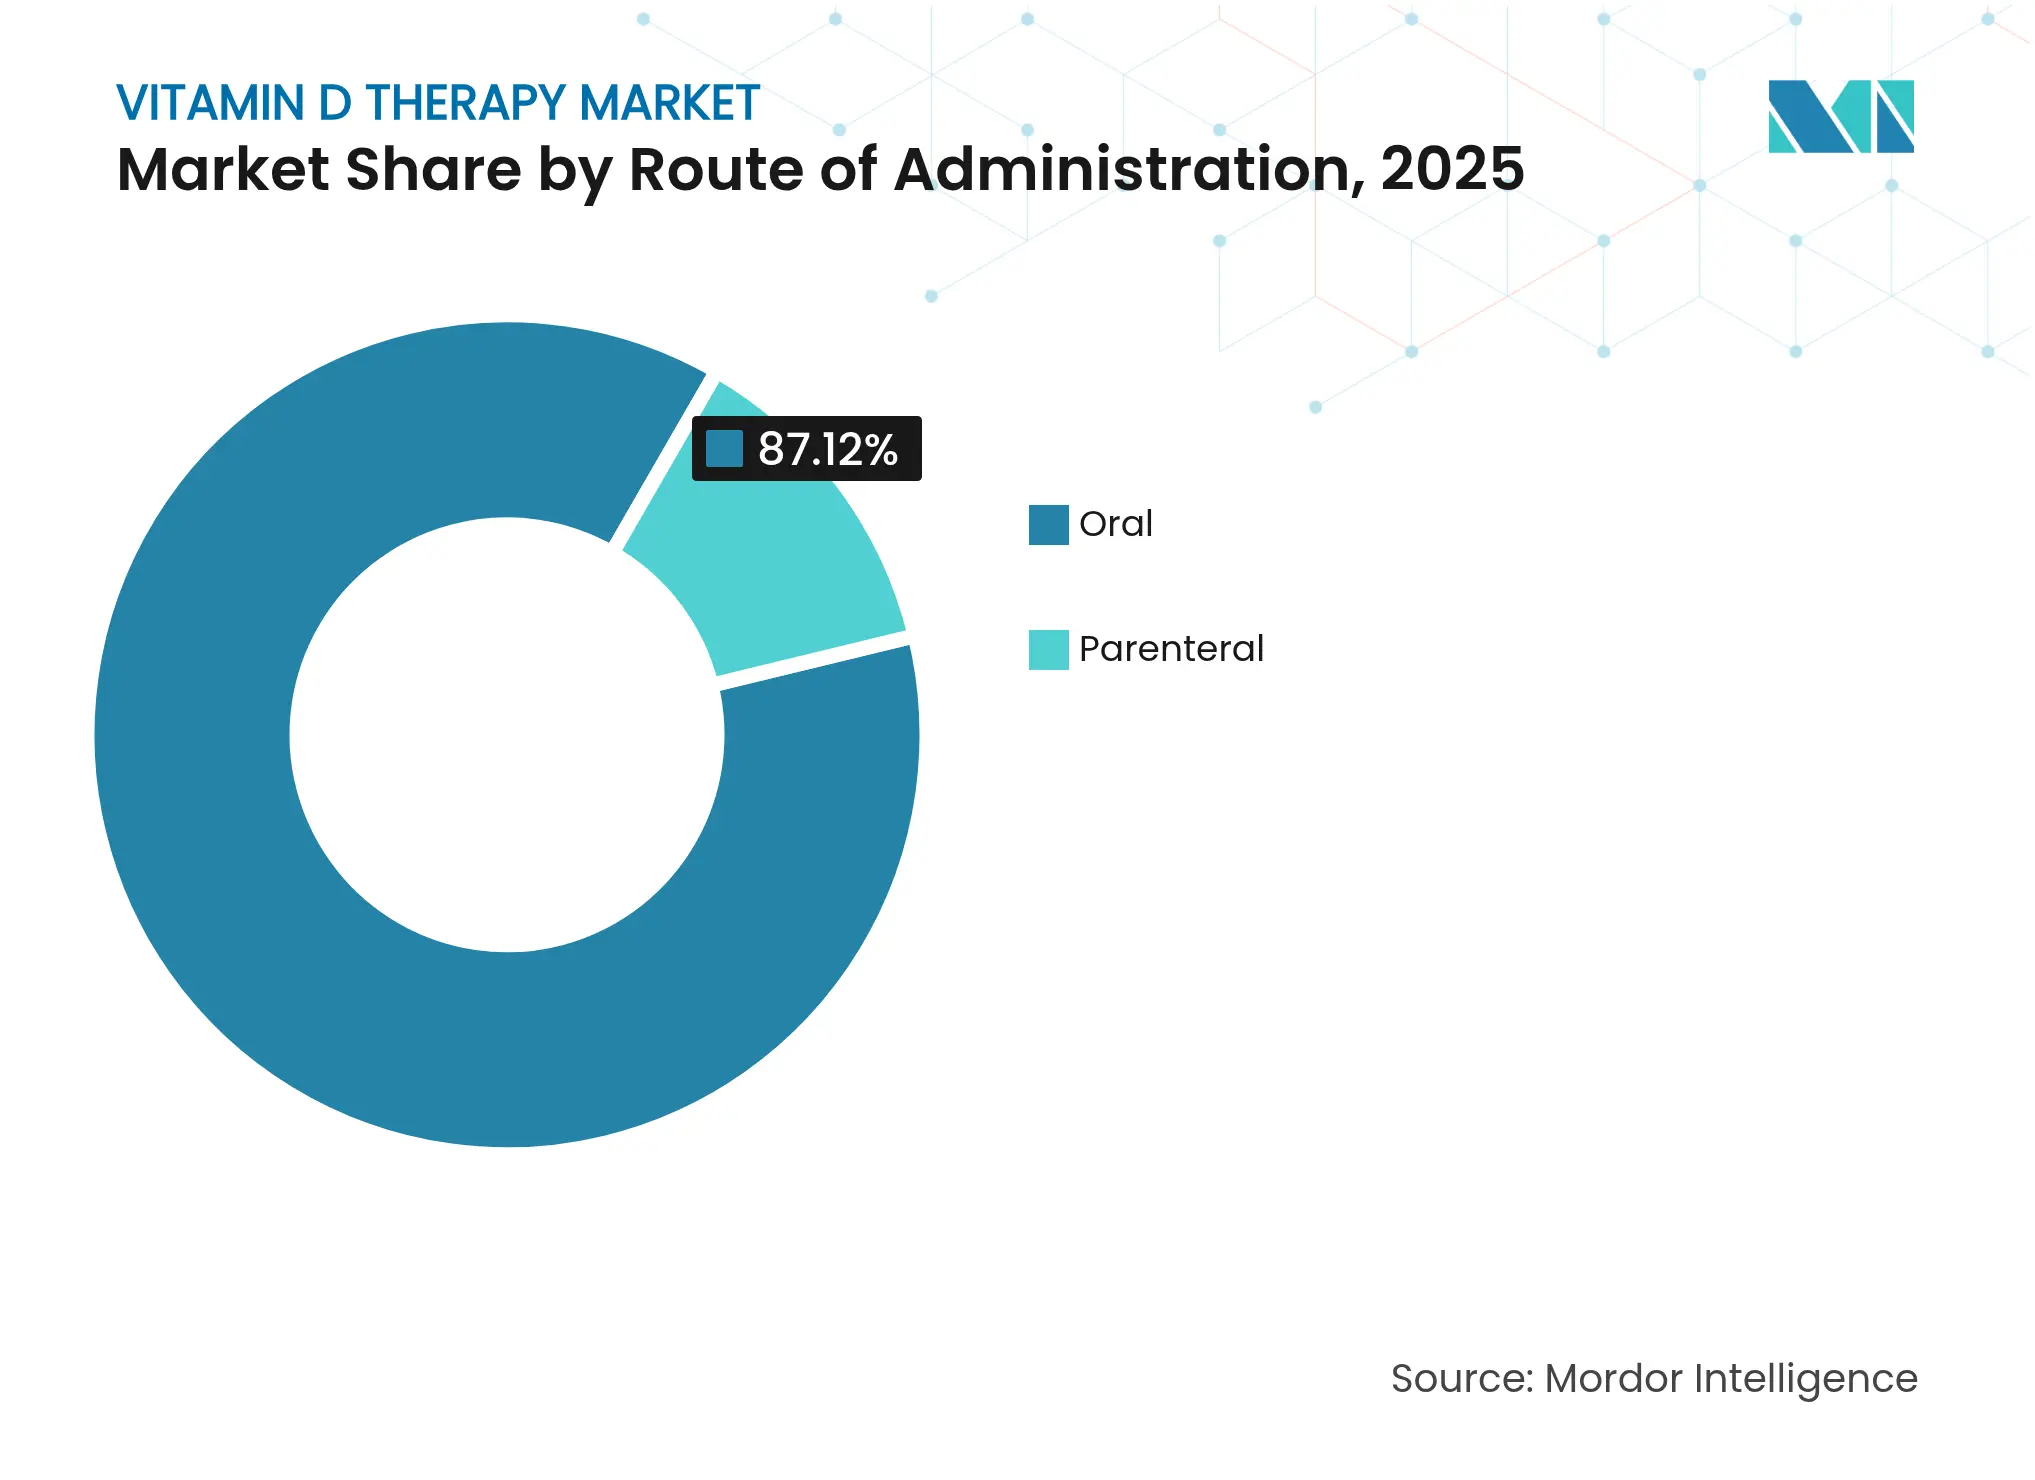
- By route of administration, oral delivery led with 87.12% of vitamin D therapy market share in 2025, while parenteral delivery is projected to grow at a 13.28% CAGR through 2031.
- By dosage form, tablets commanded 54.86% share of the vitamin D therapy market size in 2025, whereas capsules are poised to expand at 13.49% CAGR.
- By purchasing pattern, over-the-counter products captured 77.88% of the vitamin D therapy market share in 2025; prescription therapies record the fastest growth at 13.55% CAGR.
- By application, osteoporosis accounted for a 45.02% slice of the vitamin D therapy market size in 2025, but autoimmune disorders are advancing at a 13.82% CAGR to 2031.
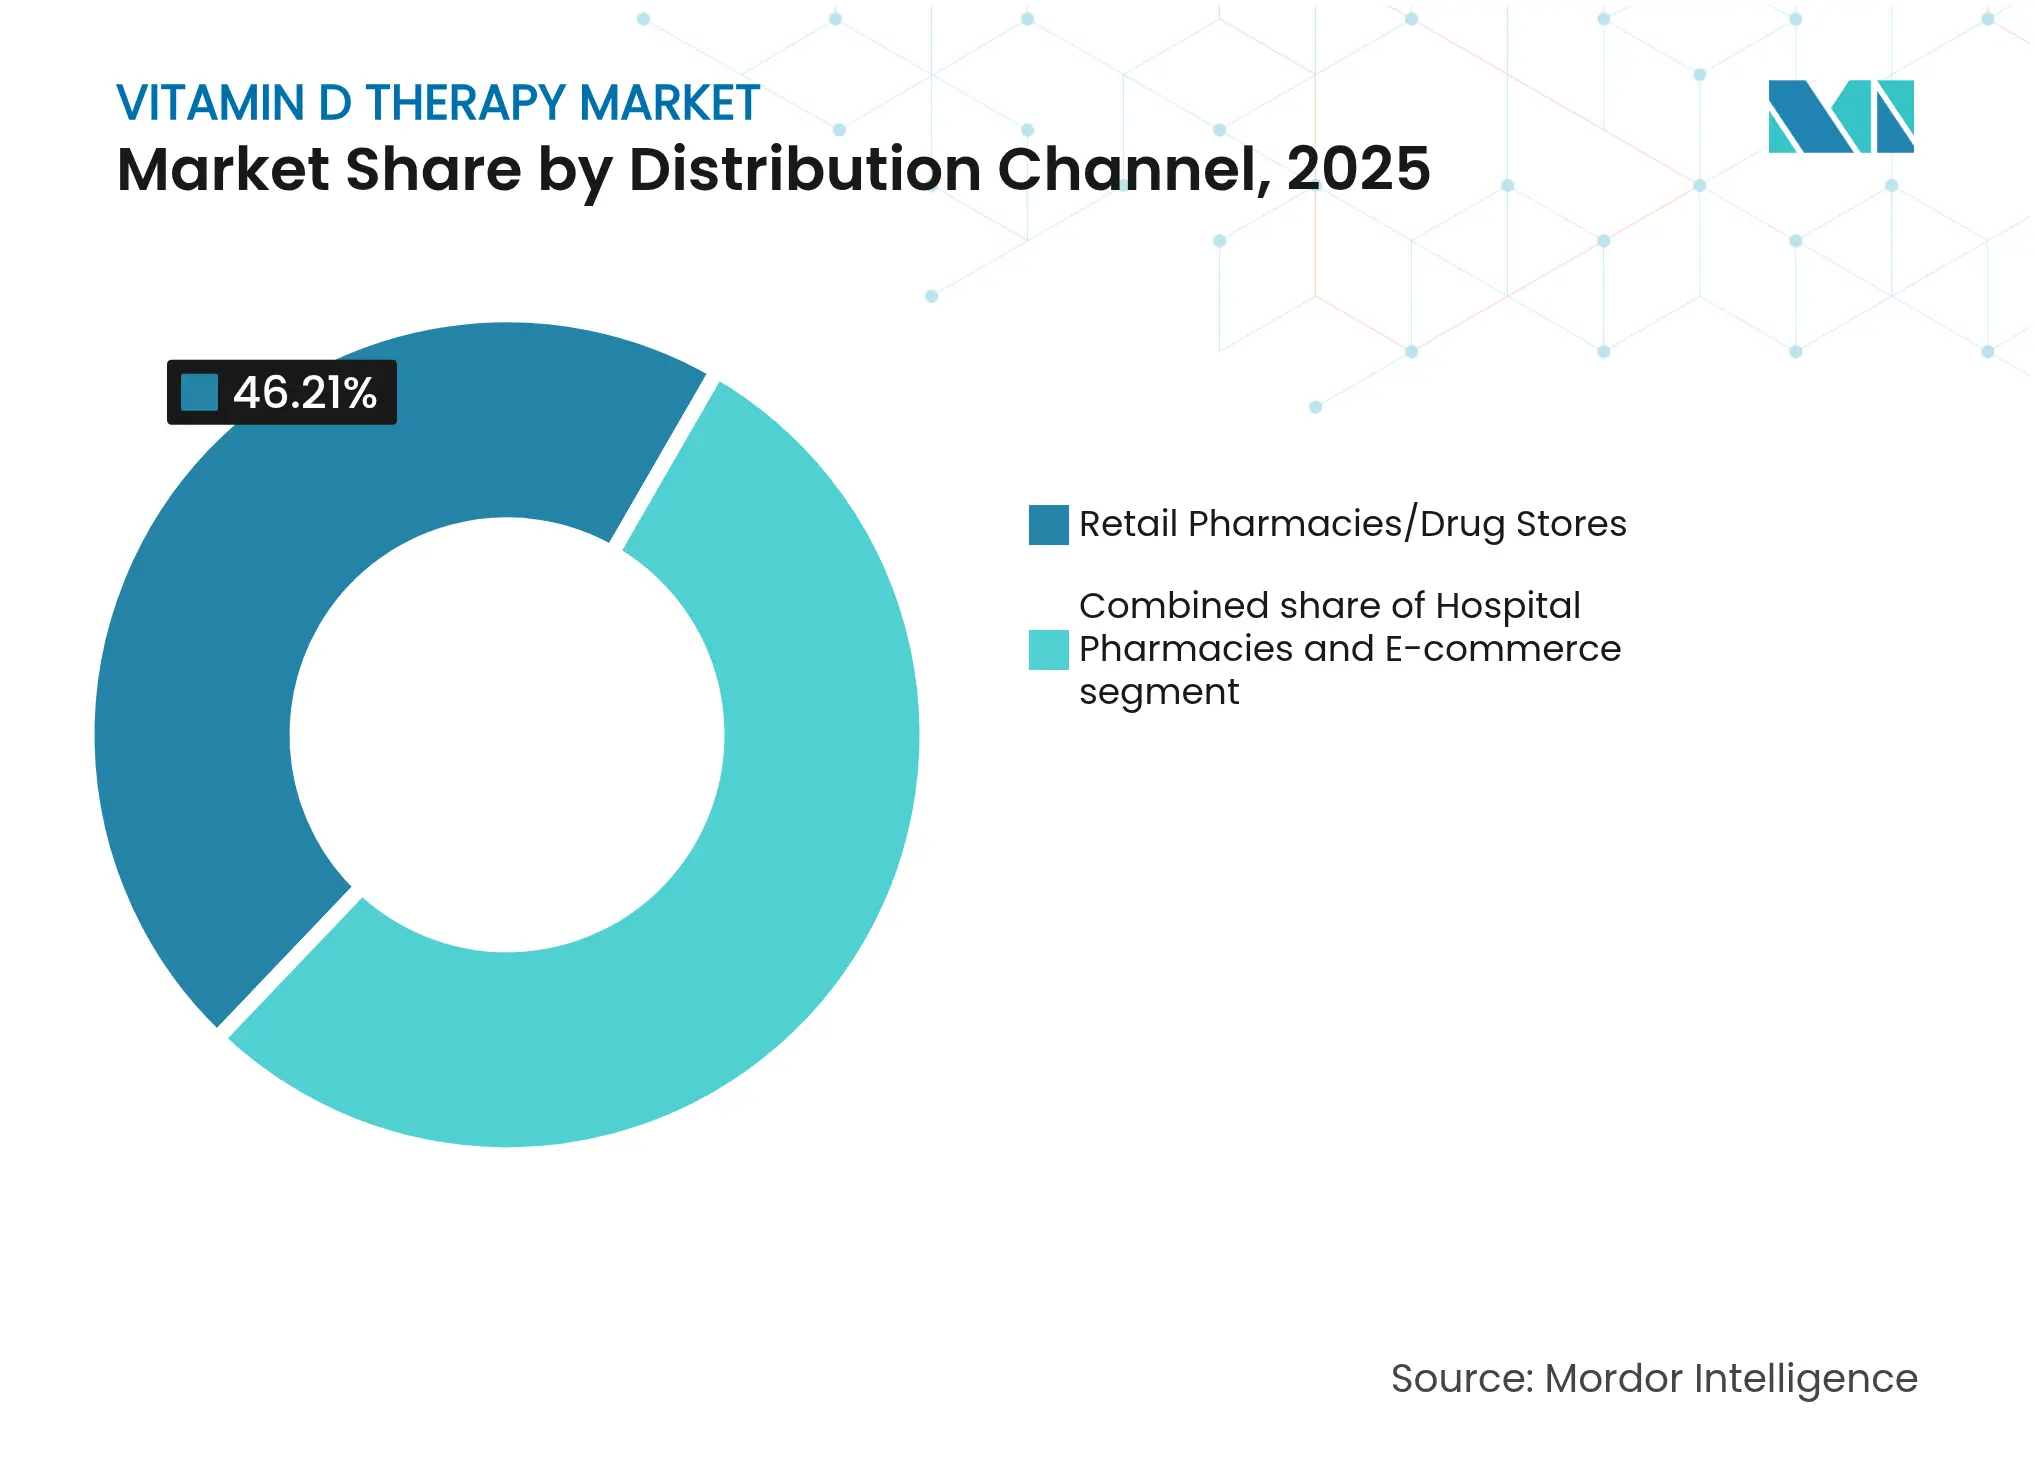
- By distribution channel, retail pharmacies held 46.21% revenue share in 2025, while e-commerce is expanding at 14.55% CAGR.
- By end user, geriatric patients represent the quickest-growing segment at 14.2% CAGR despite adults retaining 61.92% share.
- By geography, North America accounted for the highest share of 43.98%, whereas, Asia-Pacific is projected to grow at a fastest CAGR of 12.23%
Note: Market size and forecast figures in this report are generated using Mordor Intelligence's proprietary estimation framework, updated with the latest available data and insights as of 2026.
Global Vitamin D Therapy Market Trends and Insights
Driver Impact Analysis
| Driver | % Impact on CAGR Forecast | Geographic Relevance | Impact Timeline | |||
|---|---|---|---|---|---|---|
Huge patient pool with sedentary lifestyle & ageing population Huge patient pool with sedentary lifestyle & ageing population | +2.8% | Global (North America & Europe core) | Long term (≥ 4 years) | % Impact on CAGR Forecast:+2.8% | Geographic Relevance:Global (North America & Europe core) | Impact Timeline:Long term (≥ 4 years) |
Rising awareness campaigns by governments & manufacturers Rising awareness campaigns by governments & manufacturers | +1.9% | Asia-Pacific core; spill-over to MEA | Medium term (2-4 years) | |||
Growing osteoporosis & osteopenia prevalence Growing osteoporosis & osteopenia prevalence | +2.1% | Global, especially developed markets | Long term (≥ 4 years) | |||
Price volatility in 7-dehydrocholesterol driving supply-chain shifts Price volatility in 7-dehydrocholesterol driving supply-chain shifts | +1.4% | China & Europe manufacturing hubs | Short term (≤ 2 years) | |||
Home test kits & personalised dosing platforms boosting adherence Home test kits & personalised dosing platforms boosting adherence | +1.6% | North America & EU; expanding to APAC | Medium term (2-4 years) | |||
Regulatory re-classification of high-dose injectables in EMs Regulatory re-classification of high-dose injectables in EMs | +1.3% | Latin America & Southeast Asia | Medium term (2-4 years) | |||
| Source: Mordor Intelligence | ||||||
Huge Patient Pool with Sedentary Lifestyle & Ageing Population
Demographic aging converges with sedentary behavior, sharply enlarging the treatable pool for the vitamin D therapy market. Skin synthesis capacity in adults over 65 drops 75% compared with younger cohorts. Only 18.5% of U.S. adults currently supplement, underlining latent demand[1]CDC, “National Health Interview Survey Supplement Use 2025,” cdc.gov. DSM-Firmenich is advancing fast-acting variants to serve elderly patients with compromised absorption. Institutional care settings, where deficiency reaches 80%, are negotiating long-term bulk contracts, ensuring sustained uptake beyond traditional retail settings.
Rising Awareness Campaigns by Governments & Manufacturers
Asia-Pacific health authorities now push prevention ahead of treatment, with the Philippines FDA capping supplement levels at 25 mcg/day in 2025 to standardize safety. Haleon’s Bone Up program, expanded from China into the Philippines and South Korea, demonstrates scalable education that converts low-income groups into steady users. Public-private alliances amplify reach, aligning corporate messaging with national deficiency targets and granting first-mover advantage to brand leaders.
Growing Osteoporosis & Osteopenia Prevalence
Osteoporosis’ global burden is enlarging demand for combination vitamin D protocols that outperform calcium monotherapy. A 2024 trial showed D plus bisphosphonate regimens cutting fracture risk 23% versus standalone drugs[2]A. Patel et al., “Vitamin D Plus Bisphosphonate Therapy,” Frontiers in Pharmacology, frontiersin.org. South Korea’s osteoporosis medicines exceeded USD 285 million in 2023 with vitamin D supplementation central to therapy. OPKO’s RAYALDEE targets CKD patients needing calcifediol, indicating the market’s pivot to disease-specific formulations. Japanese post-spinal-fusion prescriptions of vitamin D doubled in 2024, underscoring untapped surgical pathways.
Price Volatility in 7-Dehydrocholesterol Driving Supply-Chain Shifts
Persistent spikes in the precursor’s cost have encouraged yeast-fermentation engineering that boosts vitamin D3 yields while trimming cytotoxicity. EU regulators have meanwhile cleared UV-treated mushroom powder as a legitimate D2 source, diversifying supply[3]Food Standards Agency, “UV-Treated Mushroom Powder Opinion,” food.gov.uk. Larger manufacturers hedge risk through multi-origin contracts, whereas smaller firms migrate to contract manufacturing or novel D2 formats. Volatility is likely to persist until bioengineered pathways scale.
Restraints Impact Analysis
| Restraints Impact Analysis | (~) % Impact on CAGR Forecast | Geographic Relevance | Impact Timeline | |||
|---|---|---|---|---|---|---|
Consumption of vitamin-D-fortified foods reducing therapy need Consumption of vitamin-D-fortified foods reducing therapy need | -1.8% | North America & Europe; expanding globally | Medium term (2-4 years) | (~) % Impact on CAGR Forecast:-1.8% | Geographic Relevance:North America & Europe; expanding globally | Impact Timeline:Medium term (2-4 years) |
Hypercalcaemia & toxicity concerns tempering high-dose use Hypercalcaemia & toxicity concerns tempering high-dose use | -1.2% | Global, notably high-awareness markets | Long term (≥ 4 years) | |||
Shift toward multifunctional gummies/liquids cannibalising mono-D Shift toward multifunctional gummies/liquids cannibalising mono-D | -1.5% | Global, led by North America & Europe | Medium term (2-4 years) | |||
Sustainability scrutiny of lanolin-derived D3 supply chain Sustainability scrutiny of lanolin-derived D3 supply chain | -0.9% | Europe & Oceania; gradually global | Long term (≥ 4 years) | |||
| Source: Mordor Intelligence | ||||||
Consumption of Vitamin-D-Fortified Foods Reducing Therapy Need
Aggressive fortification programs create direct substitution pressure. Bayer’s genome-edited tomatoes deliver therapeutic D3 doses through daily diets. The U.S. FDA is reviewing vitamin D2 mushroom powder as a food additive, indicating growing mainstream acceptance. While fortification may shrink general-population demand, it simultaneously opens higher-potency niches for malabsorption, CKD, or bariatric patients where food cannot reach therapeutic thresholds.
Hypercalcaemia & Toxicity Concerns Tempering High-Dose Use
Updated NIH guidance tightened upper-intake limits, prompting cautious prescribing. France is contemplating stricter ceiling levels in supplements that could curtail high-strength SKUs. Industry response favors controlled-release softgels and diagnostics-linked dosing to mitigate toxicity, generating premium segments devoted to safety-first positioning.
Segment Analysis
By Route of Administration: Parenteral Gains Despite Oral Dominance
Oral formats retained 87.12% of the vitamin D therapy market in 2025 due to convenience and price leadership. Yet parenteral products are rising at 13.28% CAGR, helped by studies showing a single 300,000 IU injection keeps 25-OH levels higher for 12 weeks versus weekly oral doses. Hospitals use intramuscular vitamin D to prepare orthopedic patients for surgery, while intensive-care protocols embrace rapid normalization.
Innovation favors 3-month depot formulations that cut dosing visits and ensure compliance among malabsorption or CKD cohorts. VITdALIZE-KIDS phase III is evaluating safety in pediatric critical care, potentially unlocking new pediatric indications. As providers value pharmacokinetic predictability, parenteral penetration will likely accelerate beyond acute settings, reinforcing growth prospects for the vitamin D therapy market.
Note: Segment shares of all individual segments available upon report purchase
By Dosage Form: Capsules Challenge Tablet Supremacy
Tablets secured 54.86% revenue in 2025, underpinned by low production cost and generic ubiquity. Capsules, however, are expanding at 13.49% CAGR, leveraging liposomal and nano-delivery to enhance fat-soluble absorption. Consumers migrating from chalky tablets cite palatability and perceived efficacy as purchase drivers.
Gummy offerings, previously limited by vitamin D stability, now incorporate microencapsulated actives, widening family appeal. Injectable and softgel niches address clinical or high-potency needs, while experimental intraoral toothpaste aims to deliver daily prophylactic doses during brushing, reinforcing habitual adherence. Formulation diversity underscores manufacturers’ pivot to user-centric design across the vitamin D therapy market.
By Purchasing Pattern: Prescription Growth Outpaces OTC Dominance
OTC items represented 77.88% of the vitamin D therapy market size in 2025, yet prescriptions are climbing 13.55% CAGR as physicians integrate vitamin D into disease-management algorithms. Insurance reimbursement encourages long-term protocols, and formulations like RAYALDEE cater to metabolic-impaired patients unmet by standard OTC products.
Hybrid models appear where high-dose injectables move from doctor’s office to pharmacy-counseled self-administration, especially in emerging markets. As evidence for immune modulation strengthens, prescribing authorities are expected to broaden indications, keeping the prescription trajectory steep.

Recognized by Experts. Trusted by Leaders.
A trusted intelligence partner to global decision-makers across 90+ countries.


By Application: Autoimmune Disorders Drive Therapeutic Expansion
Osteoporosis maintained 45.02% share of the vitamin D therapy market in 2025, benefitting from established reimbursement and strong fracture-prevention data. Autoimmune disorders now post the fastest 13.82% CAGR, following trials that link deficiency correction with reduced flare frequency in conditions such as multiple sclerosis.
Muscle function, cardiovascular health, and even oncology adjuvant roles are entering guidelines, pushing the vitamin D therapy industry into multi-system territory. Personalized dosing tools refine therapeutic windows, ensuring adequate yet safe serum levels across divergent pathologies.
By Distribution Channel: E-commerce Disrupts Traditional Retail
Retail pharmacies commanded 46.21% of revenue in 2025, trusted for professional advice. E-commerce, though, surges at 14.55% CAGR as consumers appreciate doorstep delivery and subscription savings for chronic supplementation. Digital platforms bundle home tests and AI-driven dosing, deepening engagement and lock-in.
Brick-and-mortar chains respond with omnichannel click-and-collect and loyalty programs. Hospitals restrict to parenteral SKUs and monitored regimens. Market dynamics indicate blended purchasing journeys where digital discovery meets local fulfillment across the vitamin D therapy market.
Note: Segment shares of all individual segments available upon report purchase
By End User: Geriatric Segment Drives Market Expansion
Adults held 61.92% share in 2025, yet geriatric patients grow quickest at 14.2% CAGR as age-related dermal synthesis decline heightens deficiency risk. DSM-Firmenich’s rapid-onset calcifediol specifically targets malabsorption in the elderly.
Pediatrics remains specialised, boosted by ICU trials verifying safety in critical care. Life-stage formulation strategies—chewables for children, high-strength softgels for seniors—illustrate segmentation depth within the vitamin D therapy market.
Geography Analysis
North America generated 43.98% of 2025 revenue, reflecting ingrained screening protocols and insurance coverage that embed vitamin D prescriptions into routine care. Home testing and subscription programs flourish in the U.S., while Canada’s diagnostic approval accelerates precision-dosing adoption. Europe ranks second, catalysed by the EU’s 2024 clearance of calcidiol monohydrate, which provides a faster-acting alternative for malabsorption cases.
Asia-Pacific is the fastest-growing region at 12.23% CAGR, buoyed by government education drives and rising middle-class health spending. The vitamin D therapy market size is swelling as campaigns like Bone Up tailor culturally resonant messages, lifting awareness from China to the Philippines. Japan’s functional-food regime offers parallel growth through fortified foods under the Foods with Function Claims program.
Middle East & Africa and South America show strong upside, anchored by high deficiency prevalence and gradually improving distribution infrastructure. Regulatory moves toward OTC injectables in Mexico and Brazil widen access. Investments in fortified staple foods run parallel to supplement growth, ensuring the vitamin D therapy market penetrates socio-economic tiers previously beyond reach.

Competitive Landscape
Market Concentration
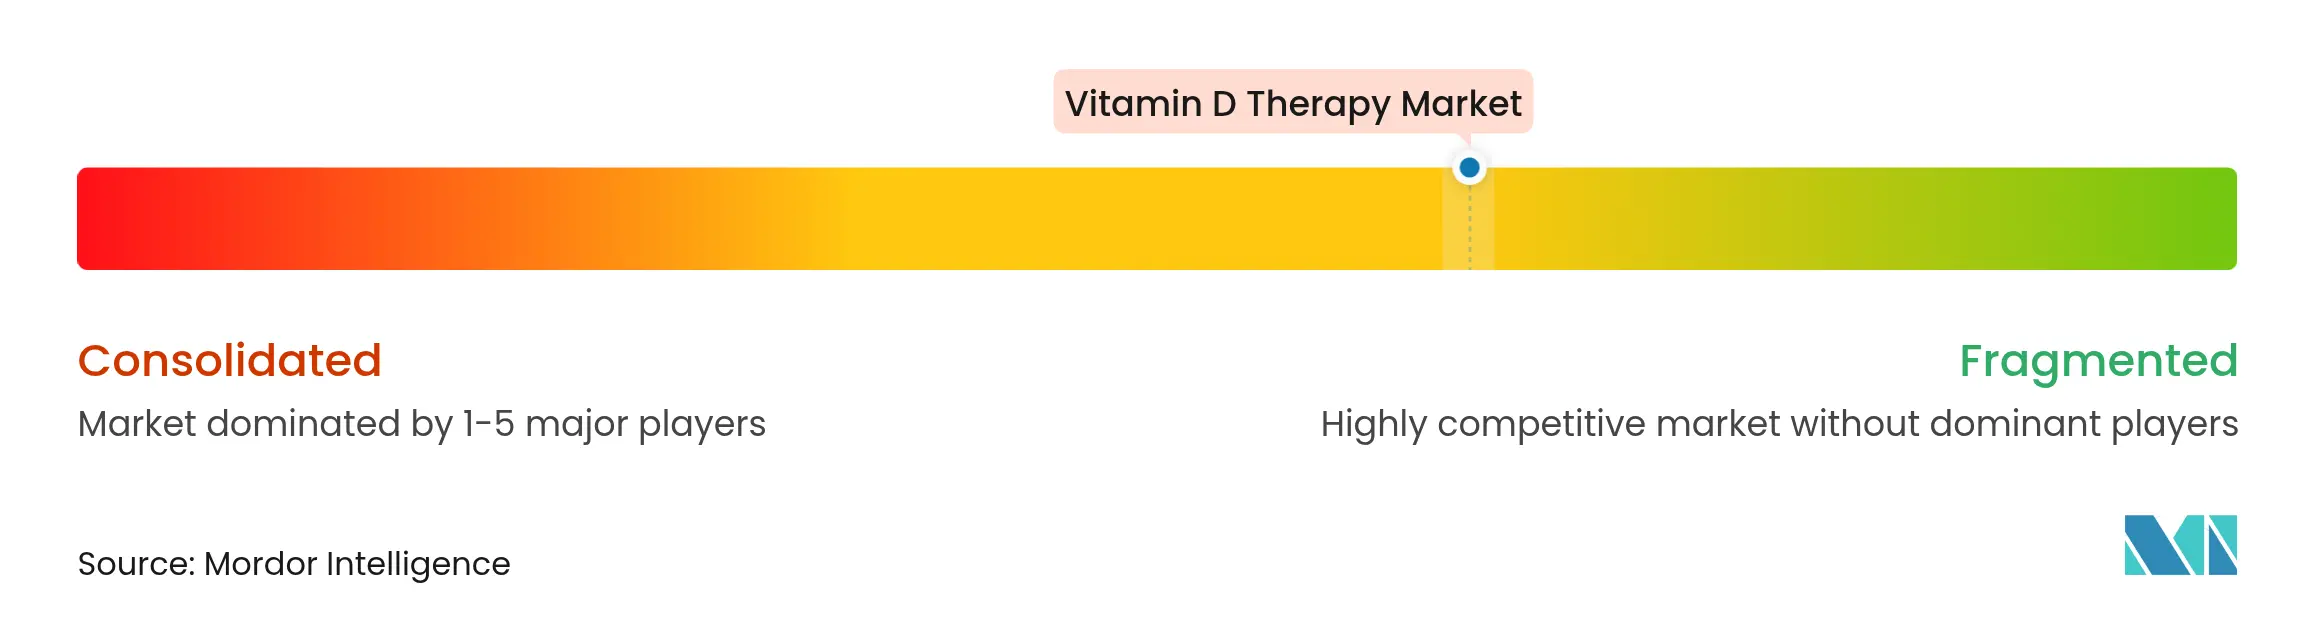
The vitamin D therapy market is moderately fragmented. Global majors such as GSK leverage 71 investigational assets to develop organ-targeted calcifediol blends. Abbott’s diversified device and nutrition platform grew 10.1% organically in Q4 2024, integrating vitamin D delivery into cardiac and diabetes programs.
Consolidation is evident: Sanofi’s 2025 purchase of Qunol captures a premium consumer base that values quality certifications. Start-ups specializing in diagnostic-linked subscription kits attract venture funding, reflecting market appetite for tech-enabled models. Supply-chain innovators focus on yeast-based D3 to sidestep precursor volatility, aiming to license IP to larger producers.
Manufacturers differentiate through delivery science—nano-liposomal capsules, extended-release softgels, depot injections—and disease-specific indications such as CKD or bariatric surgery. Market entry barriers stay moderate, but achieving scale in testing-supplement ecosystems or patented calcifediol forms could tilt share toward integrated players.
Vitamin D Therapy Industry Leaders

*Disclaimer: Major Players sorted in no particular order
Recent Industry Developments
- May 2025: DSM-Firmenich gained EU approval for Ampli-D calcidiol monohydrate, the first rapid-acting vitamin D novel food for bloc-wide commercialization.
- May 2025: Bayer partnered with G+FLAS to engineer tomatoes rich in vitamin D3, pursuing fortification through global supply chains.
- April 2025: Health Canada cleared NanoSpeed’s point-of-care vitamin D assay, enabling at-home status checks aligned with personalized dosing.
- January 2025: Philippines FDA issued harmonized supplement limits, setting vitamin D’s cap at 25 mcg/day and clarifying market requirements.
- December 2024: U.S. FDA docketed Monterey Mushrooms’ petition to list vitamin D2 mushroom powder as a food additive, broadening fortification options.
Table of Contents for Vitamin D Therapy Industry Report
1. Introduction
- 1.1Study Assumptions & Market Definition
- 1.2Scope of the Study
2. Research Methodology
3. Executive Summary
4. Market Landscape
- 4.1Market Overview
- 4.2Market Drivers
- 4.2.1Huge Patient Pool with Sedentary Lifestyle & Ageing Population
- 4.2.2Rising Awareness Campaigns by Governments & Manufacturers
- 4.2.3Growing Osteoporosis & Osteopenia Prevalence
- 4.2.4Price Volatility in 7-Dehydrocholesterol Driving Supply-Chain Shifts
- 4.2.5Home Test Kits & Personalised Dosing Platforms Boosting Adherence
- 4.2.6Regulatory Re-Classification of High-Dose Injectables in EMS
- 4.3Market Restraints
- 4.3.1Consumption of Vitamin-D-Fortified Foods Reducing Therapy Need
- 4.3.2Hypercalcaemia & Toxicity Concerns Tempering High-Dose Use
- 4.3.3Shift Toward Multifunctional Gummies/Liquids Cannibalising Mono-D
- 4.3.4Sustainability Scrutiny of Lanolin-Derived D3 Supply Chain
- 4.4Regulatory Landscape
- 4.5Porter's Five Forces Analysis
- 4.5.1Bargaining Power of Buyers/Consumers
- 4.5.2Bargaining Power of Suppliers
- 4.5.3Threat of New Entrants
- 4.5.4Threat of Substitute Products
- 4.5.5Intensity of Competitive Rivalry
5. Market Size & Growth Forecasts (Value, USD)
- 5.1By Route of Administration
- 5.1.1Oral
- 5.1.2Parenteral
- 5.2By Dosage Form
- 5.2.1Tablets
- 5.2.2Capsules
- 5.2.3Softgels
- 5.2.4Gummies
- 5.2.5Injectable Solutions
- 5.3By Purchasing Pattern
- 5.3.1Prescription
- 5.3.2Over-the-Counter
- 5.4By Application
- 5.4.1Osteoporosis
- 5.4.2Muscle Weakness
- 5.4.3Autoimmune Disorders
- 5.4.4Other Applications
- 5.5By Distribution Channel
- 5.5.1Hospital Pharmacies
- 5.5.2Retail Pharmacies/Drug Stores
- 5.5.3E-commerce
- 5.6By End User
- 5.6.1Pediatric
- 5.6.2Adults
- 5.6.3Geriatric
- 5.7Geography
- 5.7.1North America
- 5.7.1.1United States
- 5.7.1.2Canada
- 5.7.1.3Mexico
- 5.7.2Europe
- 5.7.2.1Germany
- 5.7.2.2United Kingdom
- 5.7.2.3France
- 5.7.2.4Italy
- 5.7.2.5Spain
- 5.7.2.6Rest of Europe
- 5.7.3Asia-Pacific
- 5.7.3.1China
- 5.7.3.2Japan
- 5.7.3.3India
- 5.7.3.4Australia
- 5.7.3.5South Korea
- 5.7.3.6Rest of Asia-Pacific
- 5.7.4Middle East & Africa
- 5.7.4.1GCC
- 5.7.4.2South Africa
- 5.7.4.3Rest of Middle East & Africa
- 5.7.5South America
- 5.7.5.1Brazil
- 5.7.5.2Argentina
- 5.7.5.3Rest of South America
6. Competitive Landscape
- 6.1Market Concentration
- 6.2Market Share Analysis
- 6.3Company Profiles (includes Global level Overview, Market level overview, Core Business Segments, Financials, Headcount, Key Information, Market Rank, Market Share, Products and Services, and analysis of Recent Developments)
- 6.3.1Ortho Molecular Products
- 6.3.2Biotics Research Corporation
- 6.3.3GSK plc
- 6.3.4Abbott Laboratories
- 6.3.5Pfizer Inc.
- 6.3.6Atrium Innovations (Nestl? Health Science)
- 6.3.7Merck & Co., Inc.
- 6.3.8Cadila Healthcare Ltd.
- 6.3.9Alkem Laboratories Ltd.
- 6.3.10Torrent Pharmaceuticals Ltd.
- 6.3.11Amway Corp.
- 6.3.12Bayer AG
- 6.3.13Nature's Bounty Co.
- 6.3.14Church & Dwight Co., Inc.
- 6.3.15DSM-Firmenich
- 6.3.16Garden of Life
- 6.3.17Nordic Naturals
- 6.3.18Reckitt Benckiser Group plc
- 6.3.19Pharmavite LLC
- 6.3.20Sun Pharmaceutical Industries Ltd.
7. Market Opportunities & Future Outlook
- 7.1White-space & unmet-need assessment
Research Methodology Framework and Report Scope
Market Definitions and Key Coverage
Segmentation Overview
- By Route of Administration
- Oral
- Parenteral
- Oral
- By Dosage Form
- Tablets
- Capsules
- Softgels
- Gummies
- Injectable Solutions
- Tablets
- By Purchasing Pattern
- Prescription
- Over-the-Counter
- Prescription
- By Application
- Osteoporosis
- Muscle Weakness
- Autoimmune Disorders
- Other Applications
- Osteoporosis
- By Distribution Channel
- Hospital Pharmacies
- Retail Pharmacies/Drug Stores
- E-commerce
- Hospital Pharmacies
- By End User
- Pediatric
- Adults
- Geriatric
- Pediatric
- Geography
- North America
- United States
- Canada
- Mexico
- United States
- Europe
- Germany
- United Kingdom
- France
- Italy
- Spain
- Rest of Europe
- Germany
- Asia-Pacific
- China
- Japan
- India
- Australia
- South Korea
- Rest of Asia-Pacific
- China
- Middle East & Africa
- GCC
- South Africa
- Rest of Middle East & Africa
- GCC
- South America
- Brazil
- Argentina
- Rest of South America
- Brazil
- North America
Detailed Research Methodology and Data Validation
Primary Research
Desk Research
Market-Sizing & Forecasting
Data Validation & Update Cycle
Why Mordor's Vitamin D Therapy Baseline Stands Firm
Benchmark comparison
| Market Size | Anonymized source | Primary gap driver | ||
|---|---|---|---|---|
USD 2.57 B (2025) | Mordor Intelligence | - | Anonymized source:Mordor Intelligence | Primary gap driver:- |
USD 3.30 B (2024) | Global Consultancy A | Includes dietary supplements and veterinary doses | ||
USD 2.50 B (2024) | Regional Consultancy B | Hospital panel only, no OTC capture | ||
USD 2.04 B (2023) | Trade Journal C | Historic CAGR roll-forward, outdated exchange rates |