Market Overview
| Study Period | 2020 - 2031 |
|---|---|
| Forecast Data Period | 2026 - 2031 |
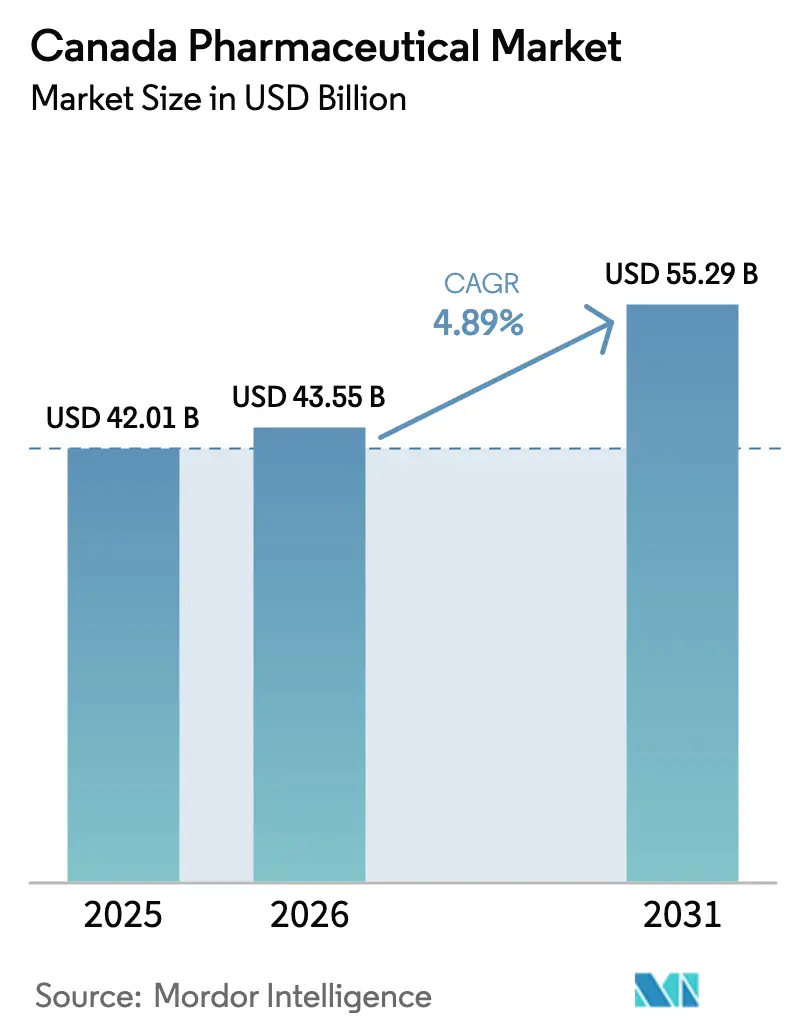
| Base Year Market Size (2025) | USD 42.01 Billion |
| Market Size (2026) | USD 43.55 Billion |
| Market Size (2031) | USD 55.29 Billion |
| Growth Rate (2026 - 2031) | 4.89% CAGR |
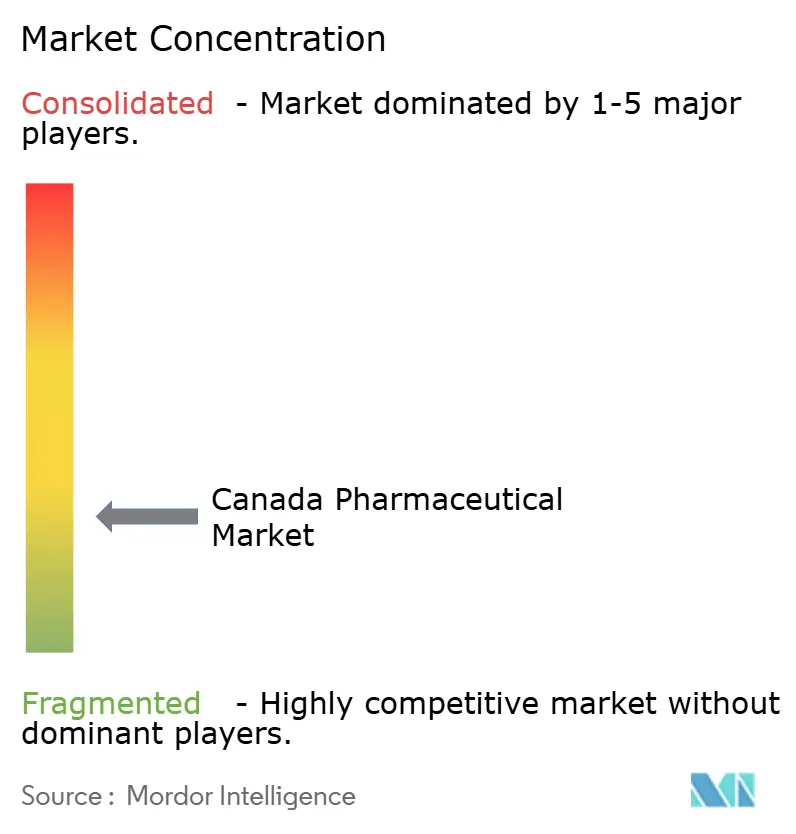
| Market Concentration | Low |
Major Players *Disclaimer: Major Players sorted in no particular order Image © Mordor Intelligence. Reuse requires attribution under CC BY 4.0. | |
Canada Pharmaceutical Market Analysis by Mordor Intelligence
The Canada Pharmaceutical Market size was valued at USD 42.01 billion in 2025 and is estimated to grow from USD 43.55 billion in 2026 to reach USD 55.29 billion by 2031, at a CAGR of 4.89% during the forecast period (2026-2031).
The forward path stems from an aging population, expanding chronic-disease burden, and steady uptake of high-cost biologics, even as provincial cost-containment rules compress list prices and margins. Oncology, metabolic disorders, and anti-infective therapies remain the main volume and value drivers, while biosimilar switching mandates in British Columbia, Alberta, and Ontario continue to unlock significant savings that help fund novel treatments. Digital pharmacy platforms are widening rural access, though reimbursement for mail-order dispensing fees is inconsistent. Supply-chain shocks in 2024 highlighted heavy dependence on imported active ingredients and underscored the need for domestic fill-finish capacity. Manufacturers now tailor launch strategies around the Patented Medicine Prices Review Board’s tightened price-control framework, which has extended the path from approval to reimbursement but has not halted interest in the Canada pharmaceutical market.[1]Patented Medicine Prices Review Board, “Annual Report 2024,” Patented Medicine Prices Review Board, publications.gc.ca
Key Report Takeaways
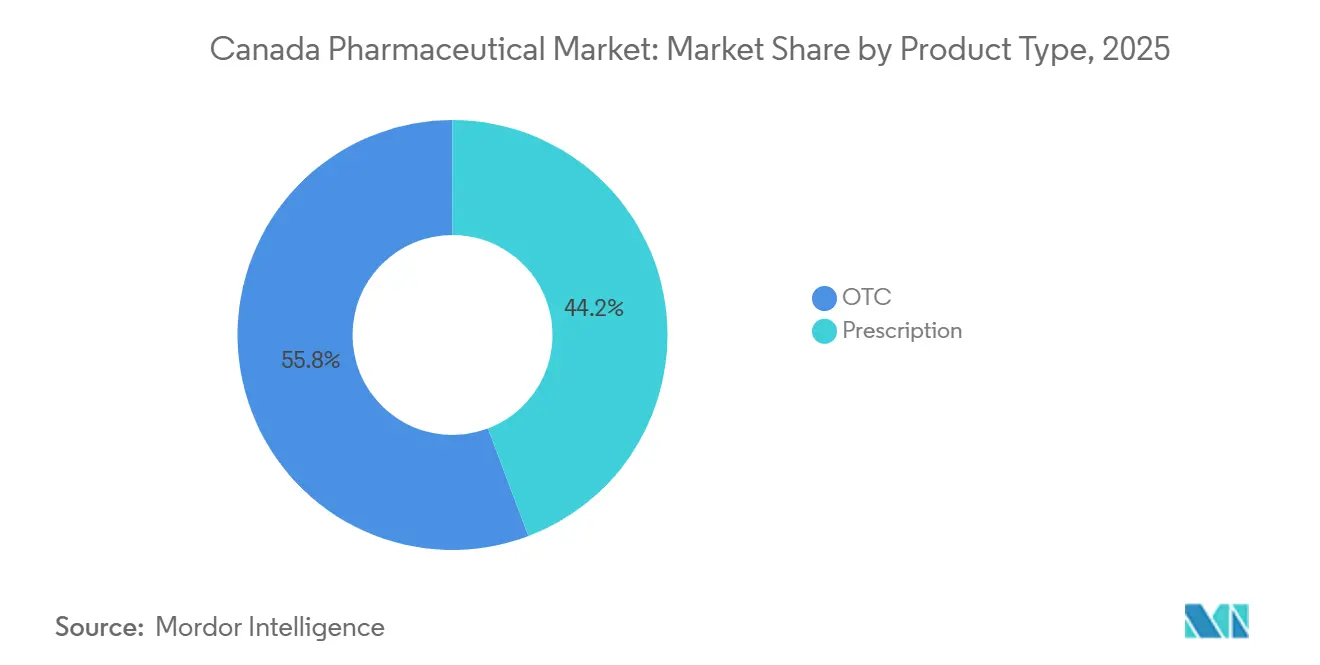
- By product type, prescription drugs led with 44.24% revenue share in 2025 and are expected to expand at only a 6.82% CAGR through 2031
- By therapeutic class, antineoplastics and immunomodulators held 26.34% of the Canada pharmaceutical market share in 2025; anti-infectives are expected to post the fastest 7.02% CAGR to 2031
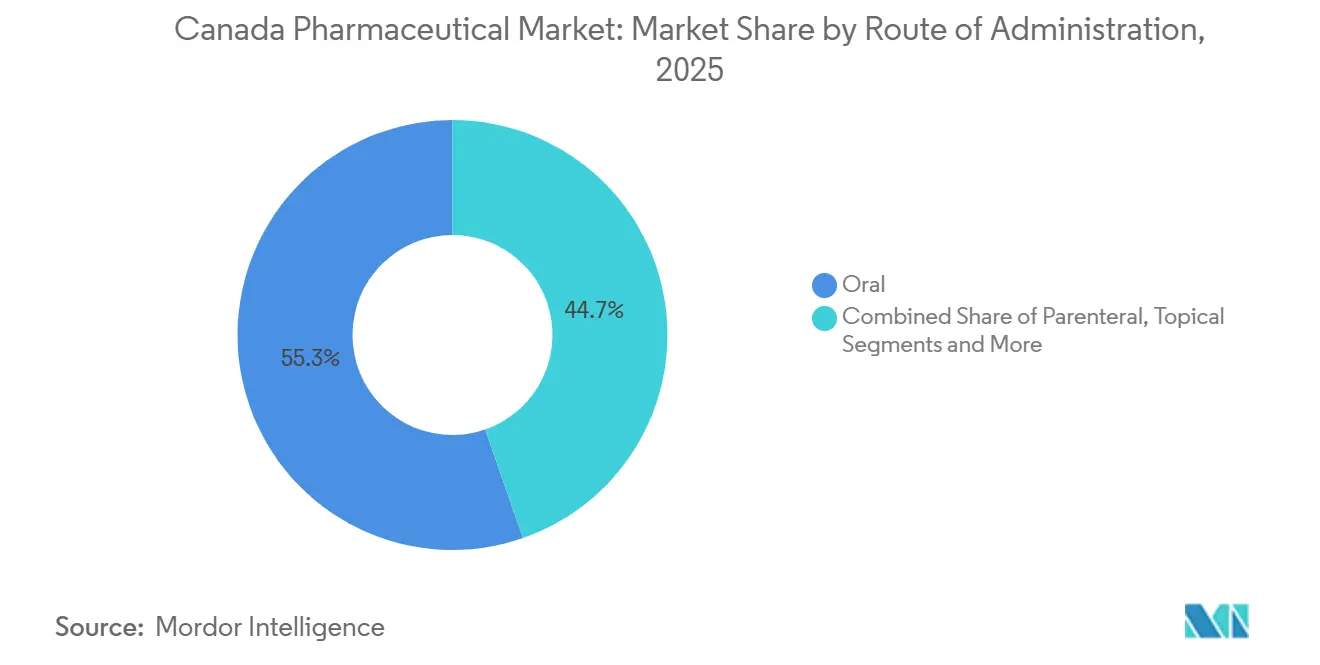
- By route of administration, oral formulations accounted for 55.32% of the Canada pharmaceutical market size in 2025 and parenteral therapies are forecast to grow at 5.44% CAGR through 2031
- By distribution channel, retail pharmacies captured 59.77% revenue in 2025, whereas hospital pharmacies are set to rise at 6.37% CAGR on specialty-drug demand
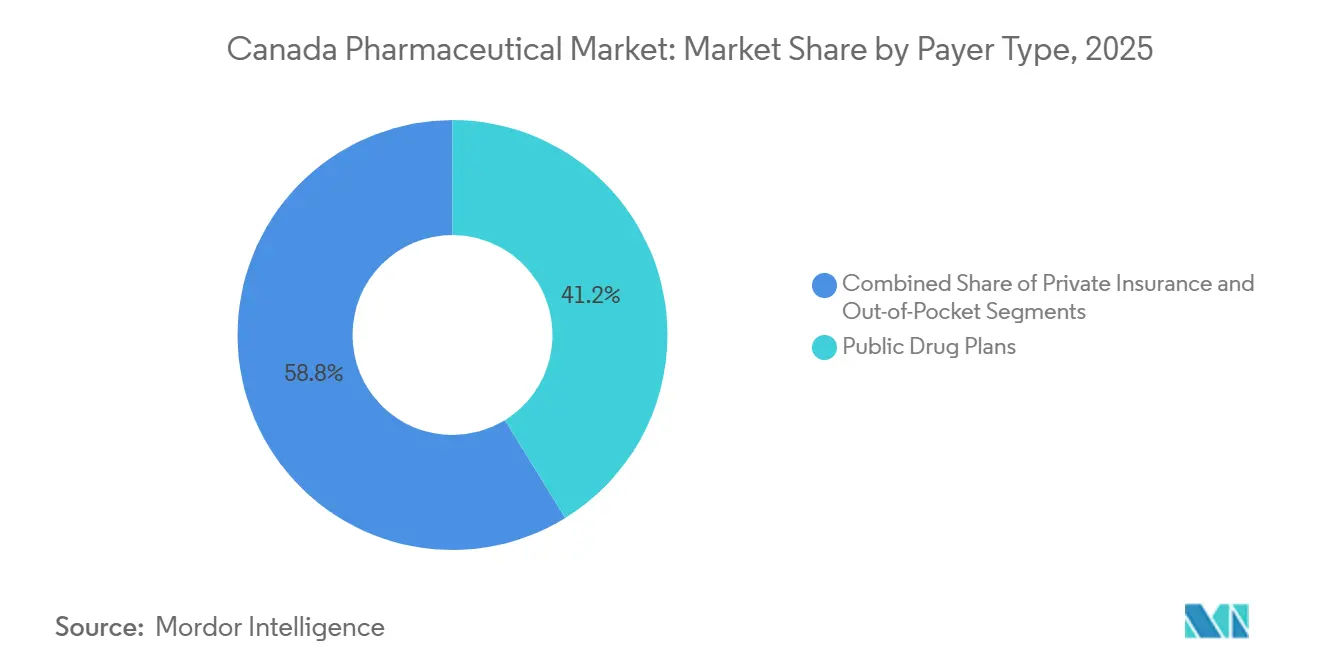
- By payer type, public drug plans financed 41.22% of national spending in 2025, yet out-of-pocket payments are climbing at 5.33% CAGR as private insurers tighten formularies
Note: Market size and forecast figures in this report are generated using Mordor Intelligence’s proprietary estimation framework, updated with the latest available data and insights as of January 2026.
Canada Pharmaceutical Market Trends and Insights
Driver Impact Analysis*
| Driver | (~) % Impact on CAGR Forecast | Geographic Relevance | Impact Timeline |
|---|---|---|---|
| Rising Chronic-Disease Prevalence & Ageing Population | +0.9% | National, with concentration in Ontario, Quebec, British Columbia | Long term (≥ 4 years) |
| Surge in Specialty Biologics & Orphan Drugs | +1.2% | National, early uptake in urban centers (Toronto, Montreal, Vancouver) | Medium term (2-4 years) |
| Provincial Biosimilar Switching Policies Unlock Savings | +0.6% | British Columbia, Alberta, Ontario | Short term (≤ 2 years) |
| Expansion of Early-Phase Clinical Trials in Canada | +0.5% | National, with hubs in Toronto, Montreal, Calgary | Medium term (2-4 years) |
| Digital Pharmacy Platforms Broaden Rural Access | +0.4% | Northern territories, rural Ontario, Quebec, Atlantic provinces | Medium term (2-4 years) |
| Momentum Toward National Pharmacare Coverage | +0.7% | National, pilot programs in select provinces | Long term (≥ 4 years) |
| Source: Mordor Intelligence | |||
Rising Chronic-Disease Prevalence & Aging Population
Canada counted 7.3 million residents aged 65 and older in 2024, equal to 18.5% of the population, and that cohort is expected to top 9.5 million by 2030.[2]Statistics Canada, “Canada’s Population Estimates: Age and Sex, July 1 2024,” Statistics Canada, statcan.gc.caChronic illnesses already absorb around 67% of direct health-care costs, led by cardiovascular disease and type 2 diabetes. Multimorbidity reached 29% among adults aged 45-64 in 2025, driving provincial plans to integrate pharmaceutical and non-pharmaceutical care pathways. Pharmaceutical firms have responded with fixed-dose combinations and long-acting injectables that simplify regimens, while payers negotiate outcomes-based contracts tied to hospital-admission reductions. Updated 2024 cardiovascular guidelines that favor SGLT2 and GLP-1 agents widened eligible populations and further stimulated demand. 40%),” Canadian Journal of Cardiology, onlinecjc.ca">[3]Sean Virani, “Canadian Cardiovascular Society/Canadian Heart Failure Society 2025 Guideline Update for Pharmacologic Management of Heart Failure With Nonreduced Ejection Fraction (LVEF > 40%),” Canadian Journal of Cardiology, onlinecjc.ca
Surge in Specialty Biologics & Orphan Drugs
Health Canada granted 42 Notices of Compliance for biologic therapies in 2024, a 23% jump over 2023. Oncology and immunology indications dominated approvals, and orphan-drug designations multiplied after criteria were harmonized with U.S. frameworks. Provincial funding for CAR-T cell therapies in Ontario and Quebec began in 2025, albeit only at certified centers that can manage apheresis and cytokine-release monitoring. List prices for emerging gene therapies regularly exceed CAD 2 million (USD 1.5 million), triggering installment payment models that tie final disbursements to clinical outcomes. Although high, these prices still fit budget envelopes once offset by avoided lifetime treatment costs and hospitalizations.
Provincial Biosimilar Switching Policies Unlock Savings
British Columbia’s Biosimilars Initiative, expanded in 2024, required non-medical switching for stable patients in rheumatology, gastroenterology, and dermatology, realizing CAD 96 million (USD 71 million) in annual savings by 2025. Alberta followed with a phased program that hit 78% biosimilar uptake within 18 months. Ontario reinforced the trend in 2025 by listing preferred biosimilars for trastuzumab and rituximab. These moves compressed reference biologic share and spurred aggressive discounting, allowing Sandoz, Amgen, and Pfizer to exceed CAD 1.2 billion (USD 890 million) combined biosimilar revenue in 2025. Real-world evidence covering 12,000 patient-years confirmed safety and efficacy parity, solidifying payer confidence.
Expansion of Early-Phase Clinical Trials in Canada
Active clinical trials grew to 1,847 in 2024, up 14% on the prior year, with oncology, CNS disorders, and infectious diseases dominating phase I and II studies. Amendments to Clinical Trials Regulations shortened approval times and aligned processes with international guidelines. Toronto, Montreal, and Vancouver academic centers added early-phase units, and a dedicated cell-and-gene facility opened at Princess Margaret Cancer Centre in 2025. Federal research grants totaling CAD 180 million (USD 133 million) targeted rare-disease and pediatric trials. Sponsors leverage universal health-data systems to insert pragmatic trial arms into real-world care pathways, lowering recruitment costs and supporting post-market reimbursement negotiations.
Restraints Impact Analysis*
| Restraint | (~) % Impact on CAGR Forecast | Geographic Relevance | Impact Timeline |
|---|---|---|---|
| PMPRB Price-Control Reforms Heighten Launch Risk | -0.8% | National, affecting patented drug launches | Short term (≤ 2 years) |
| Heavy Reliance on Imports Exposes Supply-Chain Fragility | -0.5% | National, with acute impact on generic antibiotics and cardiovascular drugs | Medium term (2-4 years) |
| Private Payers Tighten High-Cost-Drug Formularies | -0.4% | National, concentrated in employer-sponsored plans | Medium term (2-4 years) |
| Limited Domestic API / Fill-Finish Capacity | -0.3% | National, affecting biosimilar and generic production | Long term (≥ 4 years) |
| Source: Mordor Intelligence | |||
PMPRB Price-Control Reforms Heighten Launch Risk
Revised 2024 guidelines removed the United States and Switzerland from the reference basket and introduced pharmacoeconomic ceilings, cutting median list prices by 22% and delaying oncology listings by nine months. Eighteen products exceeded caps in 2025, triggering CAD 47 million (USD 35 million) in claw-backs. Several multinationals now launch first in markets with faster reimbursement, narrowing early access for Canadian patients.
Heavy Reliance on Imports Exposes Supply-Chain Fragility
Canada sourced 92% of active ingredients abroad in 2024, with China and India supplying 74% of volumes. Disruptions that year led to shortages of 127 essential medicines, forcing emergency imports and driving stock-outs lasting up to 14 weeks in hospital pharmacies. A federal Critical Drug Reserve now holds six-month inventories of 25 high-priority molecules, yet coverage still spans fewer than 12% of annual prescription volumes.
*Our forecasts treat driver/restraint impacts as directional, not additive. The impact forecasts reflect baseline growth, mix effects, and variable interactions.
Segment Analysis
By Product Type: Patented Drugs Drive Prescription Growth
Prescription drugs captured 44.24% of 2025 sales, and the segment is set to grow at 6.82% through 2031. Patented therapies controlled 62% of prescription revenue, propelled by checkpoint inhibitors, GLP-1 agonists, and gene therapies. Generics represented 38% of revenue yet 78% of total units dispensed, reflecting sustained price erosion from competitive tenders.
Over-the-counter medicines posted a modest CAGR as supermarket consolidation and private-label competition eroded branded demand. Health Canada’s breakthrough pathway now halves median review times for life-threatening conditions, yet provincial reimbursement negotiations still extend the journey to bedside by up to a year. Ontario caps most generic prices at 25% of the corresponding brand, squeezing margins but sustaining widespread access. Removal of codeine-containing analgesics from OTC shelves in 2024 shifted an estimated CAD 180 million (USD 133 million) in sales to prescription settings.


By Therapeutic Class: Oncology Dominates, Anti-Infectives Rise
Antineoplastics and immunomodulators controlled 26.34% of therapeutic spending in 2025, underscoring continued investment in targeted and cell-based oncology treatments. Anti-infectives are projected to rise at 7.02% CAGR to 2031, buoyed by stockpiling programs and rising antimicrobial-resistance rates. Drugs for the alimentary tract and metabolism held 18.2% share, bolstered by strong demand for SGLT2 and GLP-1 agents. Nervous-system medications accounted for 15.7%, while cardiovascular drugs contributed 12.4% as PCSK9 inhibitors countered generic statin erosion. Health Canada cleared 14 novel anti-infectives in 2024, and reserve antibiotics such as cefiderocol have become integral to hospital protocols. Oncology spending per capita reached CAD 412 (USD 305) in 2025, although confidential rebates reduce net impact on budgets.
By Route of Administration: Parenteral Gathers Momentum
Oral formulations maintained 55.32% share in 2025, yet parenteral options are slated to grow at 5.44% CAGR through 2031 as the biologic pipeline matures. Hospital infusion suites added capacity in Ontario and Quebec during 2025 to cope with higher outpatient volumes. Subcutaneous versions of trastuzumab and rituximab shortened chair time by 60%, easing throughput constraints. Inhalation therapies saw new triple-combination approvals, though device complexity limits adoption among older adults.

By Distribution Channel: Hospital Pharmacies Expand Specialty Reach
Retail pharmacies retained 59.77% market share in 2025, supplying chronic-disease pharmacotherapy and consumer health products. Hospital pharmacies are growing at 6.37% CAGR, reflecting payer stipulations that complex drugs be dispensed in settings equipped for monitoring and adverse-event management. Ontario designated 42 hospitals as specialty hubs, centralizing CAR-T and gene therapy distribution. Mail-order platforms now hold 11.4% share, leveraging automated robotics and same-day delivery to urban customers while reaching remote users within 48 hours.
By Payer Type: Cost Shifts Spur Advocacy
Public drug plans financed 41.22% of 2025 spending, private insurers covered 36.5%, and patients paid 22.3% out-of-pocket. British Columbia raised deductibles for higher-income households, generating CAD 62 million (USD 46 million) in additional cost-sharing. Step-therapy rules adopted by private payers delayed access to some branded biologics, raising administrative burdens for prescribers and patient groups alike. Calls for a single national formulary continue to intensify.
Geography Analysis
Ontario, Quebec, and British Columbia together represented 72% of Canada pharmaceutical market spending in 2025. Ontario reimbursed 4,400 listed products for 4.8 million beneficiaries, negotiating average rebates of 28% off list prices. Quebec’s hybrid insurance model covered 8.2 million residents and retains autonomy over formulary additions, though it aligns with pan-Canadian Pharmaceutical Alliance pricing mandates. British Columbia achieved 74% adalimumab and infliximab biosimilar penetration after expanding its switching policy in 2024.
Alberta insured 1.2 million residents via Alberta Blue Cross, which secures volume-based discounts with generic manufacturers. Atlantic provinces harmonize reviews through the Atlantic Common Drug Review, improving bargaining leverage for high-volume generics. Manitoba and Saskatchewan piloted zero co-pays for diabetes drugs in 2025 under the federal pharmacare initiative, reducing diabetic ketoacidosis emergency visits by 14%.
Northern territories face limited pharmacy infrastructure, high transportation costs, and workforce gaps. Digital platforms partly fill these voids, yet shipping fees and cold-chain reliability challenges cap full parity of access.
Competitive Landscape
The top 10 firms accounted for roughly more than half of prescription revenue in 2025, indicating moderate market concentration. Pfizer, AstraZeneca, and Novo Nordisk dominated patented categories, mainly in oncology and metabolic disorders. Sandoz, Amgen, and Pfizer controlled 64% of biosimilar revenue on the back of aggressive discounting and payer collaborations. Domestic generics suppliers such as Apotex and Teva compete on cost and supply reliability, but still face tight provincial price caps.
Manufacturers increasingly employ real-world evidence to forge outcomes-based deals. Novartis’s 2024 agreement for tisagenlecleucel ties payment to 12-month remission in pediatric leukemia. Health Canada guidance on decentralized trials has cut site costs by 22% and lifted enrollment in rare-disease studies.
Patent litigation remains active, with 37 infringement suits filed in 2024; courts have leaned toward invalidating secondary patents lacking inventive merit. Larger hospital networks installed e-prescribing with decision-support modules, lowering errors by 31%, though many smaller pharmacies struggle with integration costs.
Canada Pharmaceutical Industry Leaders
Johnson & Johnson (Janssen)
Novo Nordisk
AbbVie
Novartis
AstraZeneca
- *Disclaimer: Major Players sorted in no particular order

Recent Industry Developments
- July 2025: Bora Pharmaceuticals installed a high-speed Norden filling line at its Mississauga site, boosting capacity for dermatology products.
- March 2025: Delpharm reached a 10-year pact with Sandoz and Canada’s government to modernize sterile-injectable production in Boucherville, securing supply of 20 critical medicines.
- March 2025: Entos Pharmaceuticals began constructing a CAD 198.5 million (USD 137.2 million) R&D and biomanufacturing hub in Edmonton to scale its Fusogenix proteolipid platform.


Research Methodology Framework and Report Scope
Market Definitions and Key Coverage
Our study defines Canada's pharmaceutical market as the total ex-manufacturer value of prescription and over-the-counter human medicines legally registered with Health Canada, spanning small-molecule drugs and biologics that reach patients through hospital, retail, and licensed online pharmacies.
Scope Exclusions: Veterinary medicines, wellness nutraceuticals, active ingredient exports, and excipient sales sit outside this assessment.
Segmentation Overview
- By Product Type
- Prescription Drugs
- Patented
- Generics
- OTC
- Prescription Drugs
- By Therapeutic Class
- Antineoplastics & Immunomodulators
- Alimentary Tract & Metabolism
- Nervous System
- Cardiovascular
- Respiratory
- Anti-infectives
- Blood & Blood-forming
- Sensory Organs
- Others
- By Route of Administration
- Oral
- Parenteral
- Topical
- Inhalation
- Others
- By Distribution Channel
- Retail Pharmacies
- Hospital Pharmacies
- Mail-Order / Online Pharmacies
- Specialty Pharmacies
- Wholesalers & Distributors
- By Payer Type
- Public Drug Plans
- Private Insurance
- Out-of-Pocket
Detailed Research Methodology and Data Validation
Primary Research
Mordor analysts held structured interviews with hospital pharmacy chiefs, provincial formulary officials, community pharmacists, and payor economists across Ontario, Québec, Alberta, and British Columbia. These conversations clarified rebate ranges, biosimilar adoption rates, and likely policy shifts, letting us verify desk-research signals and fine-tune province-level assumptions.
Desk Research
We started by compiling multi-year spending and volume series from tier-1 outlets such as Statistics Canada health expenditure tables, the Patented Medicine Prices Review Board annual reports, CIHI's National Drug Spending dashboard, Health Canada's Drug Product Database, and trade shipment data from Canada Border Services. Company 10-Ks, investor decks, and peer-reviewed journals on specialty-drug uptake added clinical and pricing context. Subscription tools, including D&B Hoovers for company revenues and Dow Jones Factiva for deal flow, filled remaining financial gaps. This list is illustrative; many other sources were screened and cross-checked for factual consistency.
Market-Sizing & Forecasting
A top-down reconstruction blends national drug-purchase audits with province-level population health metrics, which are then corroborated through selective bottom-up checks on sampled manufacturer revenues and channel mark-ups. Key variables like per-capita prescription volumes, specialty-drug share, patent-cliff timelines, average selling-price index, chronic-disease prevalence, and biosimilar penetration feed a multivariate regression. ARIMA smoothing tempers short-term volatility, before scenario analysis adjusts for policy or currency shocks. Data gaps in bottom-up estimates are bridged using median ASPs from verified transactions.
Data Validation & Update Cycle
Outputs pass a multi-step review: variance scans against PMPRB benchmarks, anomaly flags for outlier provinces, senior-analyst sign-off, and a final refresh each year, with interim revisions triggered by material regulatory or macro events. Clients therefore receive the latest vetted view.
Why Mordor's Canada Pharmaceutical Baseline Commands Reliability
Published estimates often diverge because firms count different product baskets, apply dissimilar price levels, or stretch forecasts with unvetted trend multipliers.
Key gap drivers here include competitor studies folding in vitamins, wholesale mark-ups, or North American roll-ups without isolating Canadian consumption; some rely on single-source audit data and omit reconciliation with manufacturer disclosures, whereas Mordor's balanced top-down and bottom-up crosswalk, plus annual refresh cadence, curbs such drift.
Benchmark comparison
| Market Size | Anonymized source | Primary gap driver |
|---|---|---|
| USD 34.91 B (2025) | Mordor Intelligence | - |
| USD 54.90 B (2025) | Global Consultancy A | Includes vitamins and dietary supplements; relies on global price averages |
| USD 40.58 B (2024) | Regional Consultancy B | Uses retail sales only; lacks hospital channel and currency normalization |
These comparisons show that, by anchoring numbers to transparent variables and routine validation steps, Mordor delivers a balanced, decision-ready baseline that buyers can retrace and replicate with confidence.


Key Questions Answered in the Report
How large is the Canada pharmaceutical market in 2026 and where is it heading by 2031?
The market stood at USD 43.55 billion in 2026 and is on track to reach USD 55.29 billion by 2031, advancing at a 4.89% CAGR.
Which therapeutic area currently dominates spending across provinces?
Oncology, grouped under antineoplastics and immunomodulators, led with 26.34% of national spending in 2025.
What is driving the rapid rise of biosimilars in British Columbia and Alberta?
Mandatory non-medical switching programs instituted by both provinces have accelerated uptake and produced sizable savings that fund new therapies.
How are digital pharmacies changing drug access for remote Canadians?
Platforms that link teleconsults, automated dispensing, and cold-chain shipping now serve more than 2 million users and significantly cut travel costs in northern territories.
What impact will national pharmacare have on employers’ drug plans?
Centralized procurement is expected to lower generic prices, yet private insurers may face reduced roles and could shift higher co-pays onto supplemental benefits.
Why are some manufacturers delaying new drug launches in Canada?
Stricter PMPRB price caps, which exclude high-price markets like the United States from reference baskets, have lowered list prices and raised launch-sequence risk.
Page last updated on:


