
Liver Health Supplements Market Size and Share
Market Overview
| Study Period | 2020 - 2031 |
|---|---|
| Market Size (2026) | USD 15.23 Billion |
| Market Size (2031) | USD 19 Billion |
| Growth Rate (2026 - 2031) | 4.52 % |
| Fastest Growing Market | Asia Pacific |
| Largest Market | North America |
| Market Concentration | Medium |
Major Players *Disclaimer: Major Players sorted in no particular order Image © Mordor Intelligence. Reuse requires attribution under CC BY 4.0. | |
Liver Health Supplements Market Analysis by Mordor Intelligence
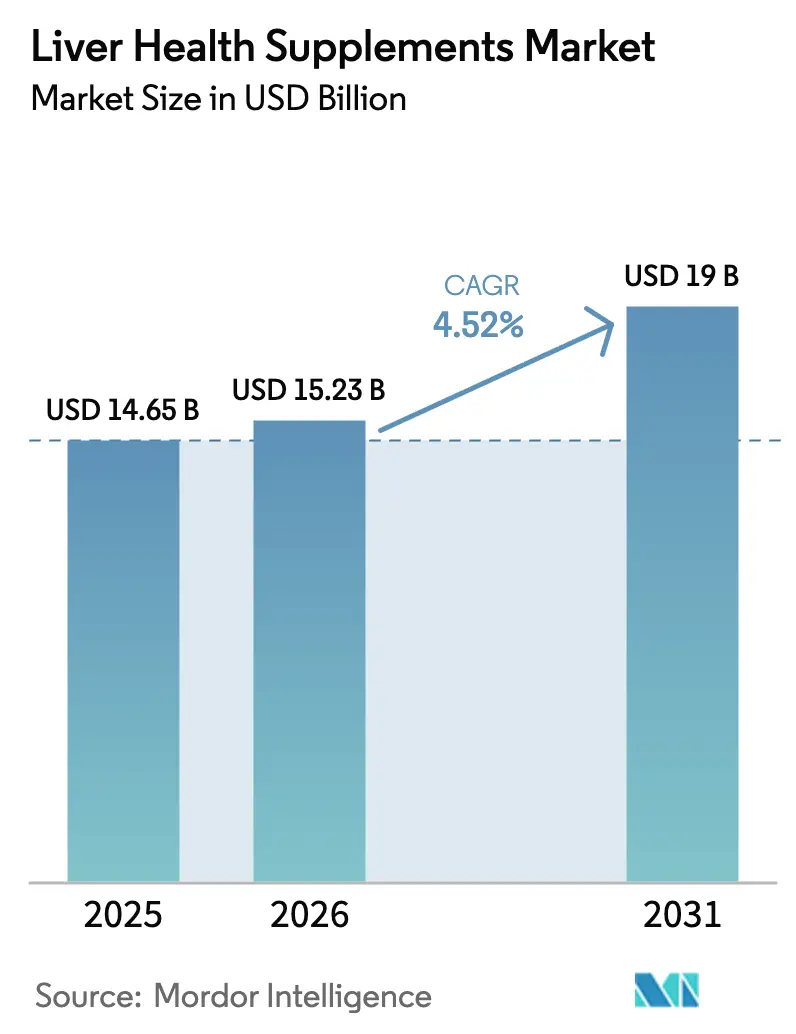
The Liver Health Supplements Market size is expected to increase from USD 14.65 billion in 2025 to USD 15.23 billion in 2026 and reach USD 19 billion by 2031, growing at a CAGR of 4.52% over 2026-2031.
Market growth is primarily driven by the rising prevalence of metabolic-associated steatotic liver disease (MASLD), increasing consumer emphasis on preventive wellness, and advancements in delivery technologies. Herbal formulations, particularly those incorporating turmeric, dominate revenue generation, while innovative amino-acid and liposomal formats enable premium pricing opportunities. The competitive landscape is undergoing a significant transformation due to the rise of digital commerce, with algorithm-driven platforms like Amazon and iHerb outpacing traditional merchandising strategies. Regulatory scrutiny, highlighted by the FDA’s March 2024 guidance on New Dietary Ingredients, is increasing compliance costs. However, this shift favors well-capitalized brands capable of demonstrating safety, bioavailability, and supply chain transparency, positioning them for long-term success.
Key Report Takeaways
- By product type, herbal supplements led with 45.32% of the liver health supplements market share in 2025, whereas “Other Products” are forecast to expand at a 6.43% CAGR through 2031.
- By dosage form, capsules accounted for 46.76% of the market in 2025, but powders are projected to grow at 6.87% CAGR to 2031.
- By end user, adults aged 19-64 years accounted for 55.76% of the 2025 revenue, while the geriatric cohort is projected to advance at a 7.32% CAGR through 2031.
- By distribution channel, pharmacies secured 42.43% of 2025 sales; however, online retailers are expected to represent the fastest growth, with a 7.54% CAGR forecasted to 2031.
- By geography, North America captured 42.67% of the global revenue in 2025, whereas the Asia-Pacific region is pacing the field at a 5.64% CAGR toward 2031.
Note: Market size and forecast figures in this report are generated using Mordor Intelligence’s proprietary estimation framework, updated with the latest available data and insights as of January 2026.
Market Trends and Insights
Drivers Impact Analysis of Liver Health Supplements Market*
| Driver | (~) % Impact on CAGR Forecast | Geographic Relevance | Impact Timeline |
|---|---|---|---|
| Escalating incidence of NAFLD and metabolic syndrome | +1.2% | Global, with highest prevalence in North America, Middle East, and urban Asia-Pacific | Medium term (2-4 years) |
| Rising consumer shift toward herbal & plant-based nutraceuticals | +0.9% | Global, led by North America and Europe; accelerating in India and China | Short term (≤ 2 years) |
| Expansion of e-commerce & direct-to-consumer distribution | +0.8% | Global, strongest uptake in North America and Asia-Pacific | Short term (≤ 2 years) |
| Adoption of precision micro-encapsulation for higher bioavailability | +0.6% | North America, Europe, and premium Asia-Pacific segments | Medium term (2-4 years) |
| Corporate wellness programs integrating routine liver-function screening | +0.5% | North America, expanding to Europe and Asia-Pacific | Short term (≤ 2 years) |
| Product innovation in controlled-release and liposomal delivery systems | +0.4% | Global, concentrated in North America and Europe; emerging in premium Asia-Pacific channels | Medium term (2-4 years) |
| Source: Mordor Intelligence | |||
Escalating Incidence of NAFLD and Metabolic Syndrome
MASLD now affects approximately 30% of the adult population worldwide, with a prevalence of 25.6% among adults and around 10% among children. About 20% of MASLD cases progress to metabolic-associated steatohepatitis, elevating risks of cirrhosis and hepatocellular carcinoma[1]. Primary-care physicians increasingly recommend adjunctive nutraceuticals despite 2024 EASL-EASD-EASO guidance that found insufficient therapeutic evidence[2]. Pediatric MASLD growth is driving the development of child-friendly formats, while adults view supplements as low-risk preventive aids, even as institutional adoption remains limited.
Rising Consumer Shift Toward Herbal & Plant-Based Nutraceuticals
Turmeric-based liver products are projected to post 28% year-over-year Amazon sales growth through 2024. Cultural familiarity with Ayurveda and Traditional Chinese Medicine reinforces demand for milk thistle, dandelion root, and bupleurum. However, a 2024 review identified that 7% of U.S. adults ingest botanicals linked to hepatotoxicity, and herb-induced liver injury shows 5-19% mortality. FDA’s tightened 2024 NDI rules raise the bar on safety data, rewarding brands that obtain USP or NSF certifications.
Expansion of E-Commerce & Direct-To-Consumer Distribution
Online retailers are on track for 7.54% CAGR through 2031 as subscription models boost lifetime value. iHerb logged USD 2.4 billion in 2024 sales after onboarding 250 new brands. Amazon holds 70-80% of U.S. vitamin and supplement e-commerce, with NOW Foods surpassing USD 200 million in trailing-12-month revenue. Success now hinges on A9 search optimization, sponsored placements, and influencer partnerships that pharmacies cannot replicate at scale.
Adoption of Precision Micro-Encapsulation for Higher Bioavailability
Siliphos delivers 4.6-fold better absorption than standard silymarin. Liposomal glutathione, nano-emulsified curcumin, and enteric-coated NAC illustrate the premium shift, enabling 30-50% price uplifts. Cymbiotika’s Liver Health+ launch in 2024 at USD 68 per month exemplifies consumer willingness to pay for delivery science. With no FDA or EFSA mandate for demonstrating bioavailability, contract manufacturers can monetize their proprietary encapsulation platforms.
Restraints Impact Analysis of Liver Health Supplements Market*
| Restraint | (~) % Impact on CAGR Forecast | Geographic Relevance | Impact Timeline |
|---|---|---|---|
| Fragmented & stringent global supplement regulations | −0.7% | Global, with highest compliance costs in EU and rising friction in India and China | Long term (≥ 4 years) |
| Limited large-scale clinical evidence for efficacy claims | −0.6% | Global, most restrictive in EU and U.S. for structure-function or health-claim approvals | Long term (≥ 4 years) |
| Adulteration & contaminant-related safety concerns | −0.5% | Global, acute enforcement gaps in North America and Asia-Pacific e-commerce channels | Short term (≤ 2 years) |
| Climate-sensitive medicinal-plant supply volatility | −0.4% | India, China, Southeast Asia, and Latin America (key herb-growing regions) | Medium term (2-4 years) |
| Source: Mordor Intelligence | |||
Fragmented & Stringent Global Supplement Regulations
FDA’s 2024 NDI guidance demands safety submissions for post-1994 ingredients, inflating compliance budgets by USD 50,000-150,000 per SKU. EFSA bars liver-health claims without randomized trials, India’s FSSAI and China’s NMPA require country-specific dossiers, and timelines stretch 18-36 months. Smaller brands lacking regulatory staff often face delayed launches and higher costs, which pushes them toward e-commerce gray zones, while multinationals deploy global compliance teams.
Adulteration & Contaminant-Related Safety Concerns
Heavy metals, microbial loads, and undeclared pharmaceuticals persist in imported botanicals, according to NSF International audits[3]. HILI mortality ranges 5-19%, with turmeric, green tea extract, and Ashwagandha frequently cited. Amazon’s third-party model allows counterfeit SKUs to slip through despite Brand Registry controls. Brands that invest in vertical integration and third-party testing command premiums, yet require sizable capital outlays.
*Our forecasts treat driver/restraint impacts as directional, not additive. The impact forecasts reflect baseline growth, mix effects, and variable interactions.
Liver Health Supplements Market Segment Analysis
By Product:
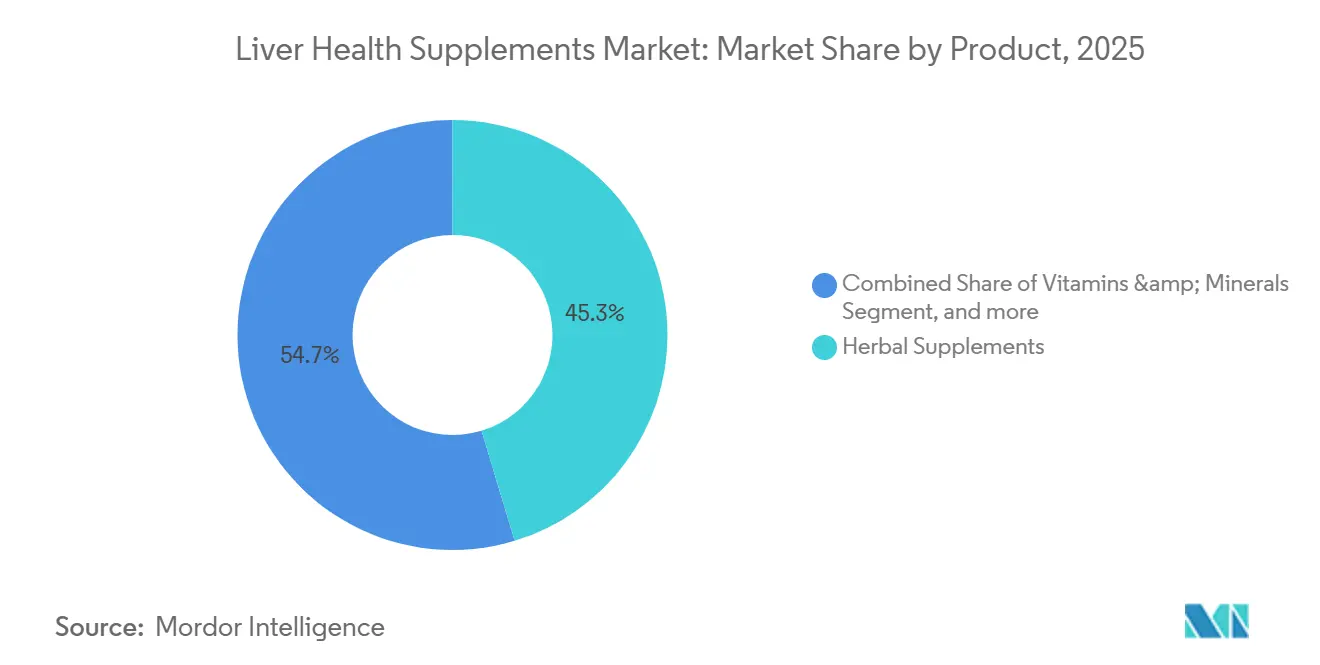
Herbal Formulations Anchor Share Despite Safety HeadwindsHerbal supplements captured 45.32% of 2025 revenue, underscoring consumer preference for plant-based options. Turmeric, milk thistle, and dandelion root dominate shelves, while turmeric SKUs logged a 28% Amazon sales jump through 2024. The “Other Products” category, including NAC and liposomal glutathione, is projected to achieve a 6.43% CAGR, reflecting renewed FDA clarity that has allowed NAC to remain within the supplement category. Brands licensing Siliphos or liposomal technologies differentiate on efficacy rather than price, positioning the category for outsized gains.
Siliphos reduces the required silymarin dose from 420 mg to approximately 100 mg while maintaining the endpoints. Jarrow Formulas and Life Extension have already reformulated their flagship lines, whereas commodity suppliers struggle with shrinking margins. Because neither the FDA nor EFSA mandates bioavailability proof, early-mover brands are banking on premium pricing before standards tighten, steering the liver health supplements market toward two-tier competition.
By Dosage Form:
Capsules Dominate, Yet Powders Gain on Customization DemandCapsules accounted for 46.76% of 2025 sales, driven by precise dosing and consumer familiarity. Enteric coatings are now featured in many premium SKUs, mitigating gastric discomfort and enhancing reviews. Tablets trail due to binders and slower disintegration. Powders, aided by smoothie-friendly positioning and 15-20% lower manufacturing costs, are poised for 6.87% CAGR. Search volume for “liver detox powder” rose 42% in 2024, signaling sustained demand.
NOW Foods’ 2024 Liver Refresh powder blends milk thistle, NAC, and methionine, targeting fitness users. Gummies and liquid drops cater to pediatric and geriatric users, yet formulators wrestle with sugar and stability constraints. The FDA’s December 2024 “healthy” label update favors powders and liquids that can display claims prominently, reinforcing the channel’s momentum.
By End User:
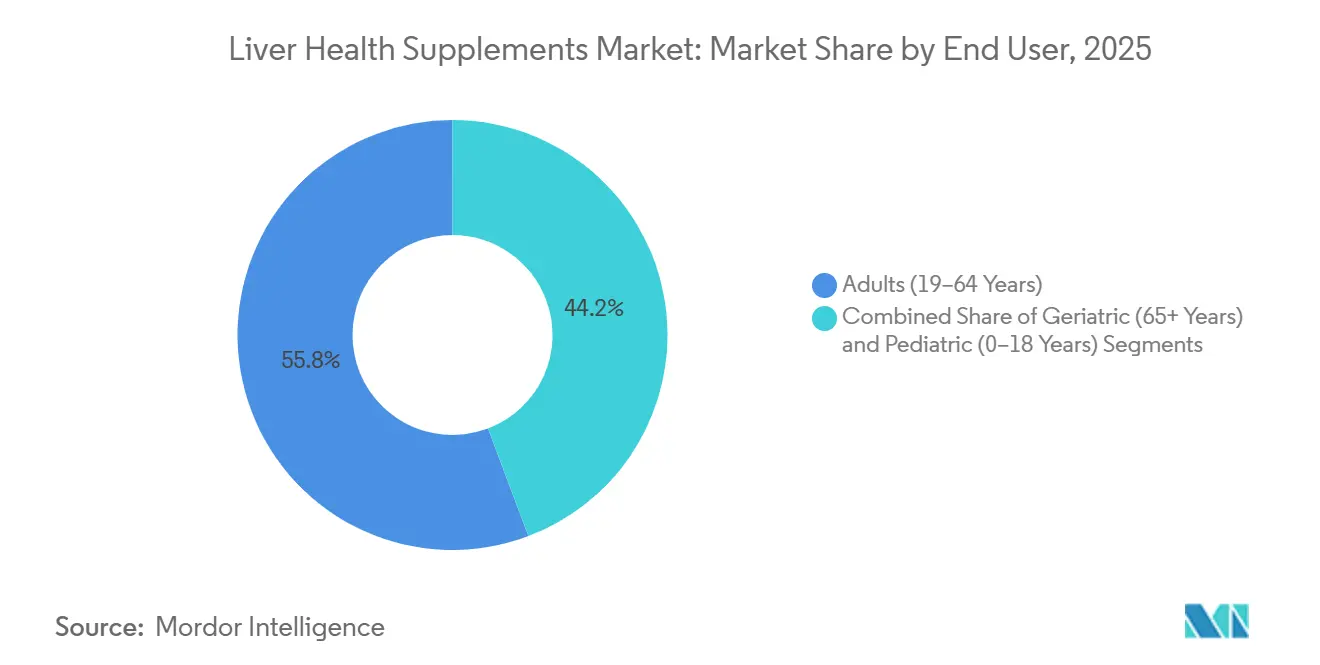
Geriatric Cohort Drives Fastest ExpansionAdults aged 19-64 years accounted for 55.76% of 2025 purchases, partly due to corporate wellness programs embedding liver-function tests. Quest Diagnostics processed 3.5 million biometric screenings in 2024, converting elevated enzyme reports into sales of supplements. The geriatric segment, however, is projected to have a 7.32% CAGR, as polypharmacy increases the risk of hepatotoxicity and glutathione levels decline with age.
Pediatric MASLD affects about 10% of U.S. children, yet few child-appropriate SKUs exist. Sugar-free gummies could unlock this high-margin niche once brands surmount regulatory and formulation hurdles. Preventive positioning resonates with parents aware of obesity risks, suggesting a future tailwind for the liver health supplements market.

By Distribution Channel:
Online Retailers Disrupt Pharmacy IncumbentsPharmacies captured 42.43% of 2025 revenue, aided by pharmacist trust and prescription-linked impulse buys. Slotting fees and curated assortments limit SKU diversity, pressuring margins. Online retailers, forecast for a 7.54% CAGR, win on convenience, infinite shelf space, and data-driven upselling. iHerb’s 14.5% 2024 sales jump to USD 2.4 billion highlights the pivot.
Amazon’s grip on 70-80% of U.S. supplement e-commerce forces brands to master keyword algorithms, A+ content, and sponsored placements. Specialty chains like GNC are facing shrinking foot traffic and rising rents, as evidenced by the 1,200 closures since 2020. Practitioner-only channels remain small but command monthly price points of USD 60-120 when physician endorsement validates claims.
Geography Analysis
North America Liver Health Supplements Market
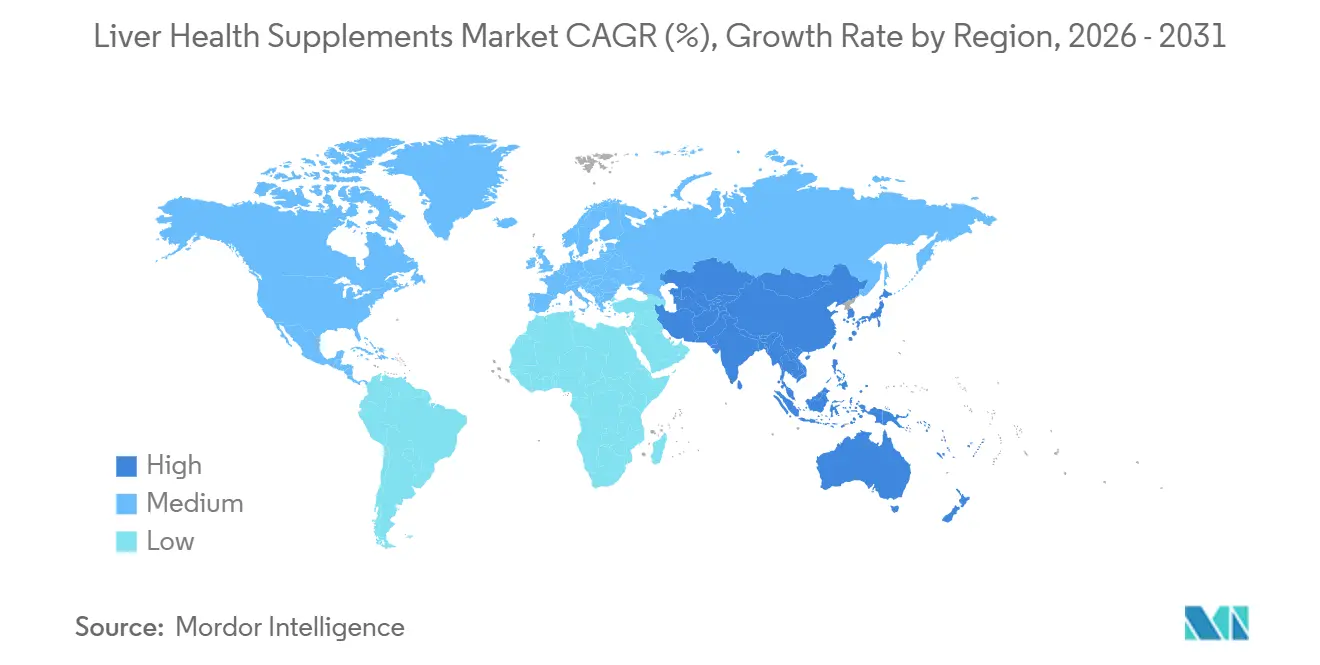
North America generated 42.67% of global revenue in 2025, driven by high per-capita spending, mature retail networks, and the FDA’s 2024 guidance that clarified compliance expectations. Corporate wellness screenings mainstreamed liver enzyme testing, prompting asymptomatic adults to consider preventive supplementation. Market growth, however, is slowing as penetration surpasses 60% across key demographics and as regulatory costs rise.
APAC Liver Health Supplements Market
Asia-Pacific is projected to have a 5.64% CAGR to 2031, propelled by rising disposable income, herbal heritage, and liberalizing rules. The April 2024 Nestlé–Dr. Reddy’s joint venture brought Nature’s Bounty to India’s INR 47,000-crore nutraceutical arena. India’s FSSAI now approves Ayurvedic formulations in 12-18 months, while China broadens its “blue hat” registration to imported botanicals. Localization—turmeric-ashwagandha blends in India, bupleurum-schisandra mixes in China—helps multinationals resonate with regional traditions.
EMEA and South America Liver Health Supplements Market
Europe, the Middle East & Africa, as well as South America, contribute smaller shares yet present focused opportunities. Gulf Cooperation Council nations buy premium Western SKUs via medical tourism corridors, while South America’s wellness influencers drive awareness among urban millennials. EFSA’s stringent claim rules dampen European growth, but high consumer trust enables premium pricing once claims are validated, sustaining the liver health supplements market in the region.
Regulatory Landscape
Regulation of liver health supplements continues to tighten around ingredient safety, claim substantiation, and borderline classification between foods/supplements and herbal medicines. In the United States, FDA oversight under DSHEA is being reinforced through process and scope work, including the Office of Dietary Supplement Programs public meeting in March 2026 on the scope of dietary supplement ingredients (including proteins, enzymes, and microorganisms). Enforcement risk remains tied to misbranding and adulteration, while FTC oversight of advertising adds a parallel requirement that marketed benefits be truthful and substantiated.
In Europe, the operating environment reflects both novel foods control and herbal-medicinal frameworks. The European Commission published Implementing Regulation (EU) 2026/1306 in June 2026 authorizing a specific novel food (rhamnogalacturonan-I enriched carrot extract) for use in food supplements, and in January 2026 the EU Novel Food Catalogue was updated to clarify Greater celandine (Chelidonium majus) as unauthorized for food/supplement use. Separately, UK scrutiny of herb-induced liver injury intensified in July 2026 when the Committee on Toxicity reviewed HILI risks and highlighted turmeric supplements as a concern for genetically susceptible individuals (for example, HLA-B*35:01), reinforcing the need for stronger safety dossiers, quality controls, and more conservative consumer-facing positioning for common botanicals used in liver support products.
Value Chain Analysis
The value chain covers botanical and nutrient inputs (for example, milk thistle and turmeric extracts, NAC, amino acids, vitamins/minerals), ingredient processors and standardizers, contract manufacturers (often operating dietary-supplement cGMP), brand owners, and distribution through pharmacies, specialty retail, and, increasingly, online marketplaces. Ingredient-side capability upgrades are reinforcing the shift toward delivery science and premiumization, including EmerWell Bio releasing a liposomal milk thistle extract powder produced in cGMP-certified cleanrooms (April 2026) and Natac highlighting industrial-scale milk thistle extract production standardized to 80% silymarin (June 2026).
Key bottlenecks and cost drivers sit upstream in botanical quality variability and logistics, which can force blending, tighter incoming QC, and longer lead times (including reported shipping time increases from India to the United States from about four weeks to six-to-eight weeks). Trade frictions such as US-China tariffs also add volatility for certain TCM-sourced botanicals with limited alternative origins. Downstream, commercialization is constrained by claim and labeling compliance, with FDA governing labeling and structure-function boundaries and FTC governing advertising substantiation. That raises the importance of documentation packages (COAs, contaminant testing, and third-party certifications) and pushes many brands toward fewer, higher-margin SKUs with differentiated formats such as liposomal and phytosome systems.
Competitive Landscape
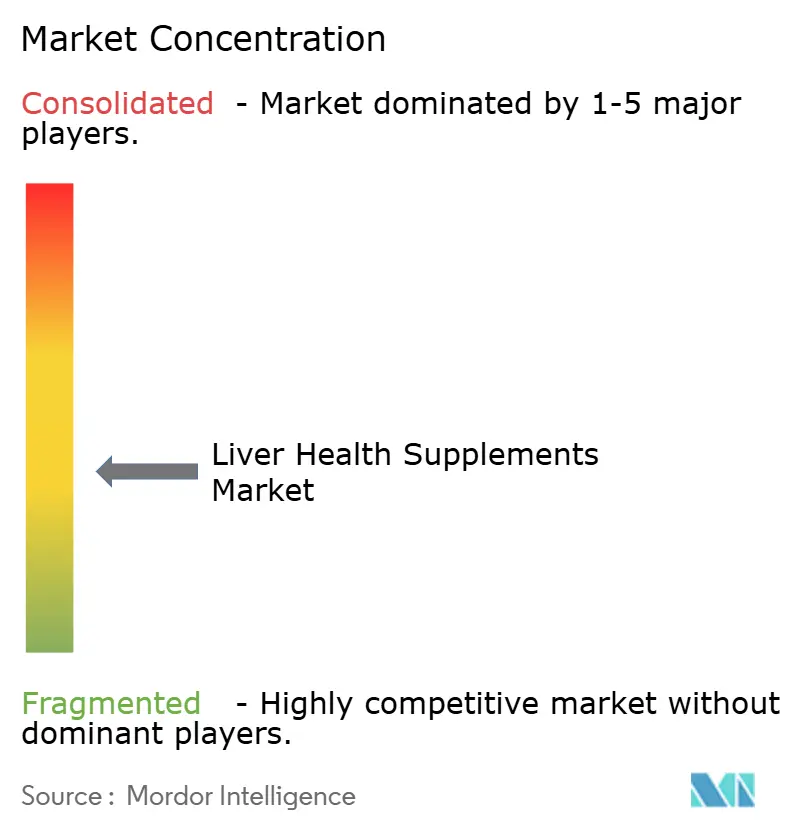
The global market remains highly fragmented, with no single company holding more than a 10% share, reflecting low entry barriers and diverse demand. Established players like Amway, Nature’s Bounty, and GNC leverage their scale and pharmacy partnerships but face increasing price competition from direct-to-consumer disruptors such as Cymbiotika and mindbodygreen. The competitive intensity is further heightened by iHerb’s addition of 250 new brands in 2024 and Amazon’s algorithm-driven sales strategies, which contribute to SKU proliferation and shift market power toward platforms rather than producers.
Bioavailability has become a critical differentiator in the market. Companies adopting advanced technologies such as Siliphos, liposomal encapsulation, or nanoemulsion are able to justify price premiums of 30% to 50%. Practitioner channels continue to provide a competitive edge for clinically supported products like 1MD LiverMD, which integrates telehealth services with physician endorsements. Additionally, fitness-conscious consumers, wary of hepatotoxicity risks associated with performance supplements, are increasingly drawn to powder formulations integrated into greens or pre-workout products. This trend highlights a significant opportunity for innovation in the liver health supplements segment.
Long-term success in the market will depend on a combination of third-party certifications, transparent sourcing practices, and adaptive digital marketing strategies. While resource-efficient entrants may initially gain traction on platforms like Amazon, rising compliance and advertising costs are expected to drive out underfunded brands. This dynamic is likely to lead to moderate market consolidation while still preserving opportunities for niche differentiation.
Liver Health Supplements Industry Leaders
-
Enzymedica
-
Gaia Herbs
-
Jarrow Formulas, Inc.
-
Nutralife Health Products Inc.
-
Himalaya Wellness Company
- *Disclaimer: Major Players sorted in no particular order
Liver Health Supplements Market Companies Covered in this Report
- Amway
- Blackmores
- BodyBio
- Cymbiotika
- Enzymedica
- Gaia Herbs
- GNC
- Himalaya
- Integria Healthcare (Thompson’s)
- Irwin Naturals
- Jarrow Formulas
- Life Extension
- Nature's Bounty
- Nature's Way Brands
- NOW Foods
- Nutralife Health Products
- Pure Encapsulations
- Renew Life Formulas
- Solgar
- Swanson Health Products
- Swisse Wellness
Market Opportunities and Future Outlook
Opportunities are concentrated where brands can pair liver-support supplementation with measurable outcomes, safer ingredient strategies, and channel-native digital execution. A diagnosis-first or monitoring-enabled approach that links supplement regimens to biomarkers is emerging, as shown by Untoxicate launching a liver support system in April 2026 that combines a functional hydration formula with at-home enzyme testing and tracking (including ALT, AST, and GGT). This model supports higher retention and premium positioning relative to stand-alone bottles sold on marketplaces.
A second opportunity is clinically anchored, multi-ingredient formulations aligned to MASLD/NAFLD awareness and rising scrutiny of botanicals. This includes combinations that blend traditional extracts (milk thistle, artichoke, dandelion) with metabolic cofactors such as NAC, alpha lipoic acid, and TUDCA, as reflected by PureHealth Research introducing a hepatic wellness collection in May 2026 that includes these ingredient families. Alongside product innovation, ongoing clinical programs and registrations (for example, MASLD-focused nutraceutical trials and published ingredient research on liver enzymes and steatosis outcomes) provide an evidence pathway for practitioner and pharmacy channels where stricter claim interpretation and consumer skepticism limit generic "detox" positioning.
Recent Industry Developments in Liver Health Supplements Market
- May 2026: PureHealth Research launched a liver support collection positioned around hepatic wellness formulas featuring ingredients such as milk thistle, artichoke extract, dandelion, and TUDCA. The launch signals continued movement from single-herb staples toward multi-ingredient systems designed for broader metabolic and bile-acid support narratives. It also increases competitive pressure on mainstream brands to match formulation complexity while maintaining substantiation and quality controls.
- June 2025: Guttify expanded its Liver Lift Kit initiative with a multi-market rollout and partner-enabled at-home diagnostic workflow. It moves beyond a single-market product toward a broader services-led offering.
- January 2024: Cymbiotika launched Liver Health+, a premium liver-support formula positioned around enhanced delivery and high-end ingredient stacks. The launch highlighted consumer willingness to pay for perceived bioavailability and quality cues in liver wellness categories. It also accelerated competitive emphasis on format innovation (for example, liposomal approaches) alongside traditional botanical lineups.
Liver Health Supplements Market Report Scope and Research Methodology
Market Definition and Coverage
This market covers finished liver health supplement products that are bought for routine liver support, cleansing, or detox positioning, and that are sold through retail and professional channels. Our sizing reflects value sales of these supplements across major regions and key consuming countries.
Scope exclusions: It excludes prescription liver drugs, hospital-administered nutrition, and non-ingestible wellness services.
Segments Covered in This Report
- By Product
- Vitamins & Minerals
- Herbal Supplements
- Other Products
- By Dosage Form
- Capsules
- Tablets
- Powder
- Others
- By End User
- Adults (19–64 Years)
- Geriatric (65+ Years)
- Pediatric (0–18 Years)
- By Distribution Channel
- Online Retailers
- Pharmacies & Drugstores
- Supermarkets / Hypermarkets
- Specialty Stores
- Practitioner / Clinic Dispensed
- Geography
- North America
- United States
- Canada
- Mexico
- Europe
- Germany
- United Kingdom
- France
- Italy
- Spain
- Rest Of Europe
- Asia-Pacific
- China
- Japan
- India
- Australia
- South Korea
- Rest Of Asia-Pacific
- Middle East And Africa
- GCC
- South Africa
- Rest Of Middle East And Africa
- South America
- Brazil
- Argentina
- Rest Of South America
- North America
Data Sources, Market Sizing, and Validation
Desk Research
Desk work was used to build the model structure and anchor country-level demand signals before moving into assumptions. We relied on public health and nutrition references such as the World Health Organization, the US NIH Office of Dietary Supplements, the US CDC, and similar government health portals to understand liver disease burden and supplement use patterns. We also reviewed trade and retail signals using sources such as UN Comtrade, customs statistics portals, and consumer price index series where supplement baskets are reported.
To connect demand to supply, we screened company annual reports, investor presentations, product labels, and press coverage to understand portfolio mix and route to market by channel. Patent databases were also referenced to sense ingredient and formulation activity when it appeared relevant to liver positioning. For cross-checking financial direction and corporate events, we used paid subscriptions focused on company financials and news, plus an import-export shipment-level database for selected ingredient flows. These source examples are illustrative, and other public and paid references were also used for data collection, validation, and clarification.
Primary Interviews and Surveys
Primary work focused on validating what sells as a liver health supplement in practice, and how pricing and channel shares move by region. We spoke with supplement brand teams, contract manufacturers, distributors, pharmacy and specialty retail contacts, and a few nutrition and practitioner voices to pressure-test adoption, typical pack sizes, and promo intensity across APAC, EMEA, and the Americas. Where desk data was thin, these inputs helped us set realistic ranges for ingredient mix, online share growth, and consumer repeat purchase behavior.
Distribution of primary research fieldwork respondents
| Company type | Respondent position | Region |
|---|---|---|
| Top tier: 30% | CXOs: 15% | APAC: 41% |
| Mid tier: 48% | Functional/Unit leaders: 42% | EMEA: 34% |
| Smaller Players: 22% | Managers: 43% | Americas: 25% |
Market-Sizing & Forecasting
Sizing started with a top-down build where population and adult cohort splits were tied to liver health interest and supplement participation rates, which were then converted into value using typical pack pricing. The model was then corroborated with selective bottom-up approximations, mainly by sampling brand and channel price points, checking reported supplement revenue mixes where available, and validating realistic volume-throughput for key channels.
A few practical inputs drove most of the work in the model. These included age cohort shares (adult, geriatric, and pediatric where applicable), channel mix across online, pharmacies, supermarkets, specialty retail, and practitioner-dispensed pathways, and dosage-form preferences such as capsules and tablets. Ingredient and claim direction was treated as a demand shaper rather than a separate market, with checks on how often botanicals and vitamin-mineral combinations show up in liver positioning. Price movement assumptions were built from observed shelf prices and promo frequency, then adjusted for currency timing and inflation patterns in each region.
For forecasting, we used scenario analysis supported by simple trend smoothing on the key drivers, so short-term channel shifts did not overstate long-run growth. Where bottom-up views were incomplete for smaller brands or fragmented online sellers, we used calibrated expansion factors, reviewed against retailer assortment depth and distributor feedback.
Data Validation & Update Cycle
Outputs were validated through multiple checks, including cross-referencing implied per-capita spend against nutrition and wellness spend patterns, and reviewing whether country splits align with known supplement penetration differences. Large swings in ASP, channel mix, or regional growth were flagged, and the underlying assumptions were re-opened before sign-off. When inconsistencies persisted, we re-contacted a small set of experts to confirm whether the change was real or driven by temporary promotions or one-off stocking.
Each report is refreshed annually, and interim updates are made when material events occur, such as major regulatory actions, a sharp pricing reset, or a visible channel disruption. Before delivery, a final analyst pass is completed so the dataset, assumptions, and recent developments match the latest available information.
Mordor Intelligence's Liver Health Supplements Market Size Measured Against Other Published Estimates
Published numbers for liver health supplements can look far apart, even when they seem to describe the same space, because the product boundary is not consistently applied across studies. Differences usually come from what is counted as a liver product versus a general digestive or detox supplement, plus how online and practitioner sales are treated.
The table points to a spread that is mostly explained by scope and pricing logic. In Mordor Intelligence's model, we count only supplements that are explicitly positioned for liver support, rather than folding in broader detox blends. We build pricing from observed pack prices by channel, then normalize for currency timing.
Benchmark comparison
| Source | Market Size | Gaps in Research Methodology |
|---|---|---|
| Mordor Intelligence | USD 14.65 B (2025) | |
| Global Consultancy A | USD 16.00 B (2025) | This estimate appears to include broader detox and digestive wellness supplements that are not always liver-specific, which can inflate totals in markets where blended products dominate retail shelves. |
| Trade Journal B | USD 11.19 B (2025) | This figure seems to lean on conservative sell-in style assumptions and narrower channel capture, especially for online retailers and practitioner-dispensed sales that can be material in supplements. |
After aligning the definitions, the remaining gap is mainly about how adjacent categories and channel coverage are treated, not about a single growth assumption. By tying the estimate to clear product positioning, channel-level pricing, and repeatable demand inputs, our number stays traceable and easier to reconcile during planning discussions.
Key Questions Answered in the Report
How large is the liver health supplements market in 2026?
The liver health supplements market size is USD 15.23 billion in 2026.
What is the forecast CAGR for liver health supplements to 2031?
The market is expected to register a 4.52% CAGR through 2031.
Which product category grows fastest within liver support supplements?
The “Other Products” segment, including NAC and liposomal glutathione, is forecast at a 6.43% CAGR to 2031.
Why are online retailers important for liver supplement sales?
Online platforms enable subscription models and algorithm-driven discovery, supporting a 7.54% CAGR - the fastest among all channels.
Which region is set to outpace others in growth?
Asia-Pacific is projected to expand at a 5.64% CAGR, driven by rising incomes and herbal traditions.
What makes bioavailability a competitive differentiator?
Technologies such as Siliphos and liposomal encapsulation deliver higher absorption, justifying 30-50% price premiums and brand loyalty.