Venezuela Container Glass Market Size and Share
Market Overview
| Study Period | 2020 - 2031 |
|---|---|
| Base Year For Estimation | 2025 |
| Forecast Data Period | 2026 - 2031 |
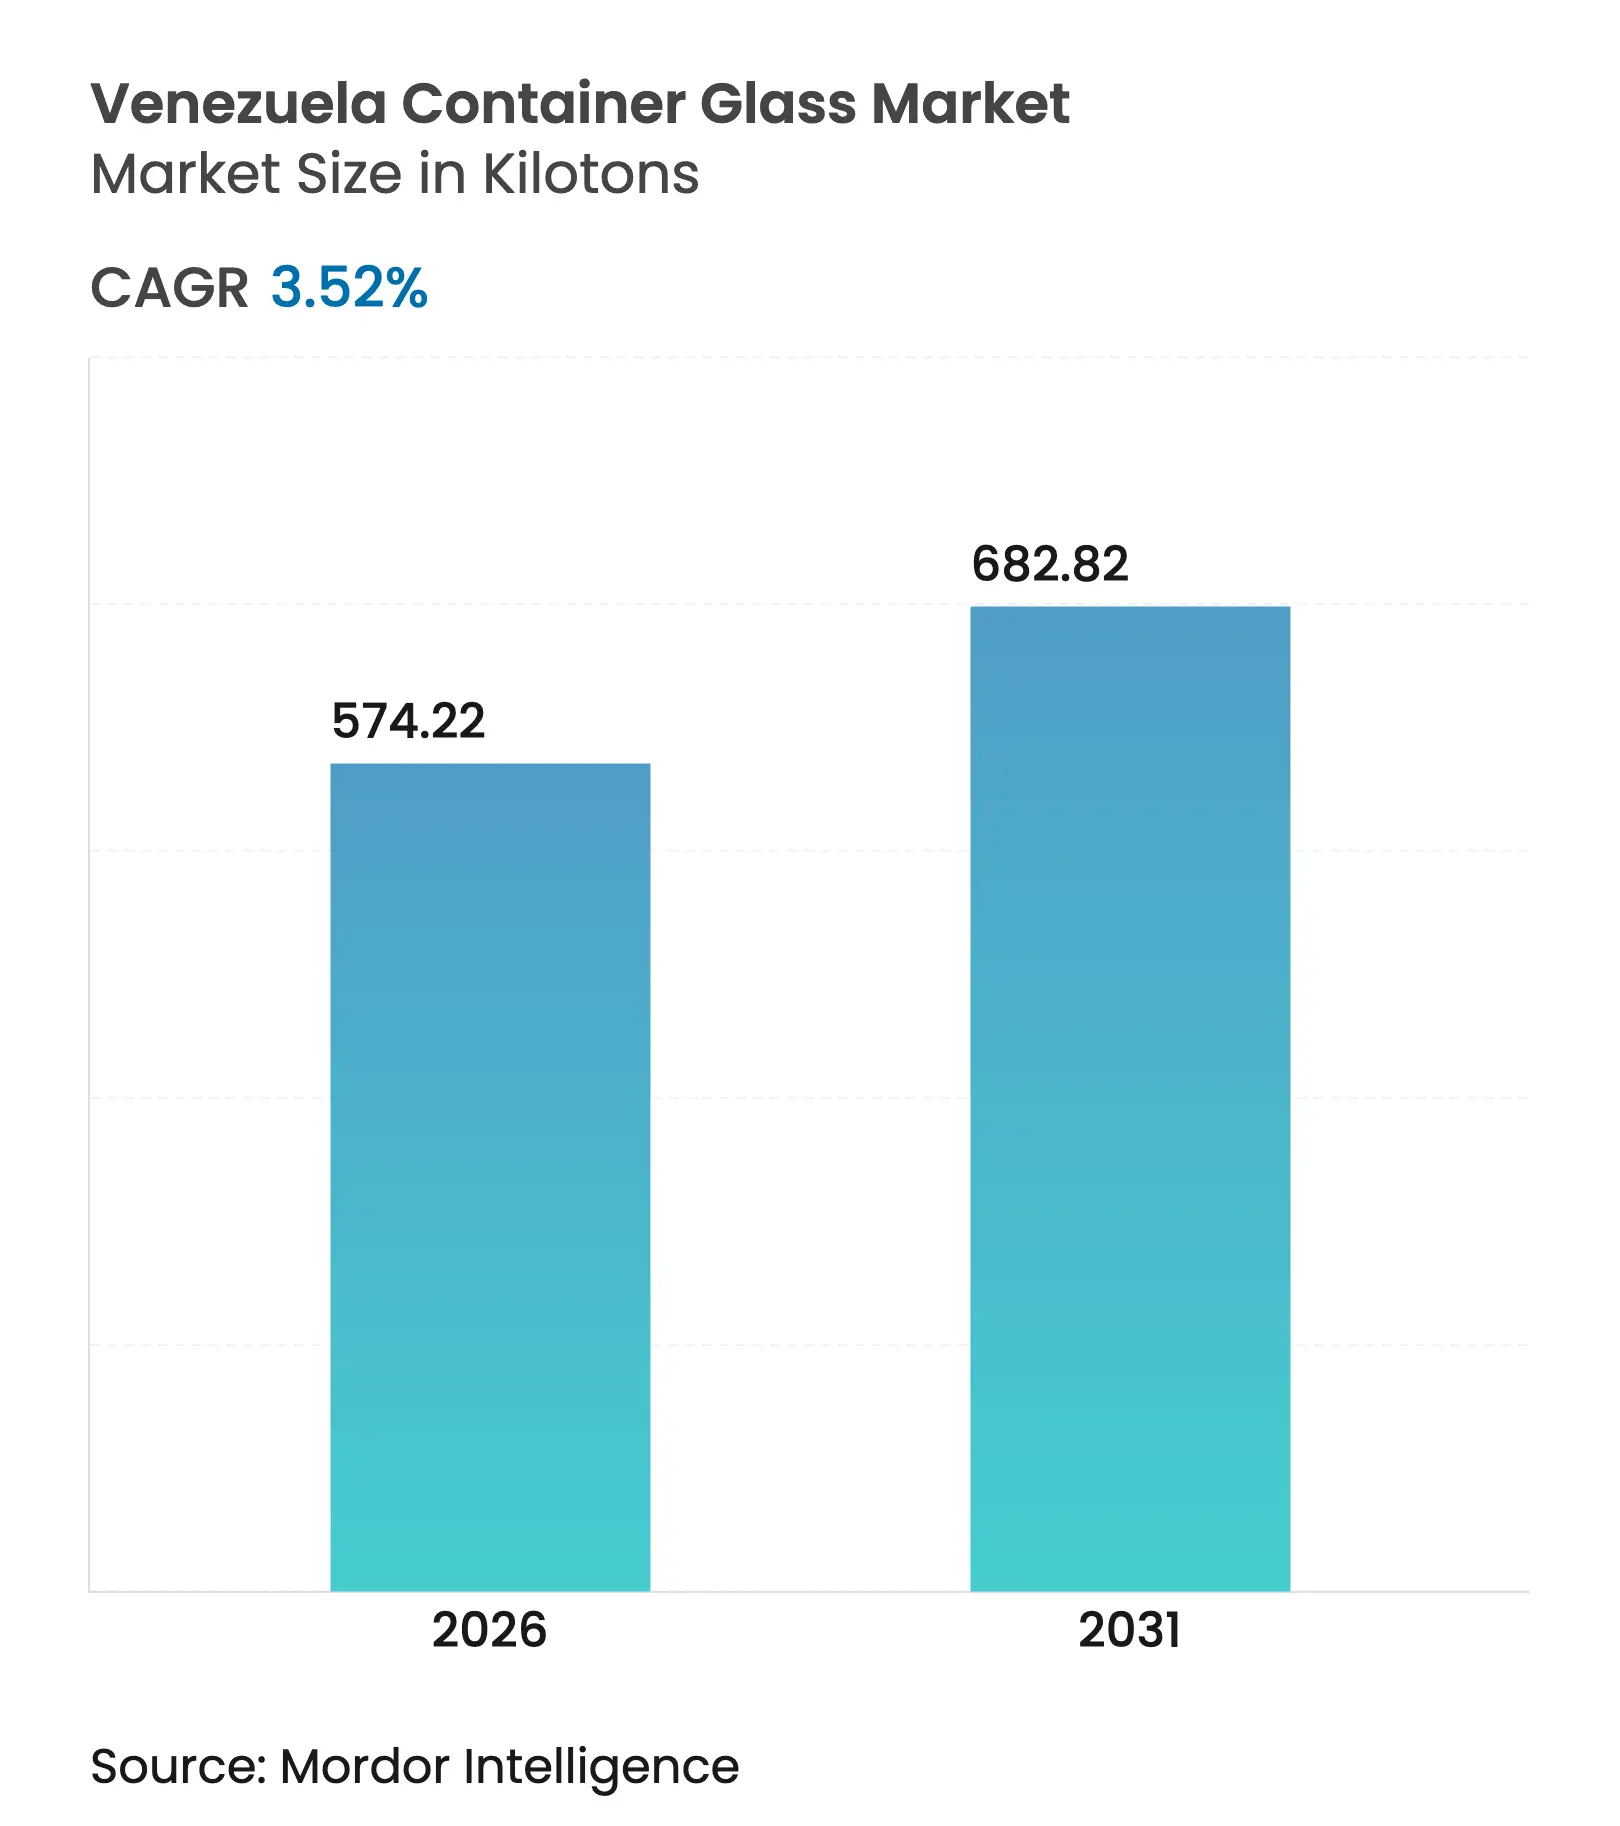
| Market Volume (2026) | 574.22 kilotons |
| Market Volume (2031) | 682.82 kilotons |
| CAGR | 3.52 % |
| Market Concentration | High |
Major Players *Disclaimer: Major Players sorted in no particular order. Image © Mordor Intelligence. Reuse requires attribution under CC BY 4.0. |
Venezuela Container Glass Market Analysis by Mordor Intelligence
The Venezuela container glass market size was valued at 554.69 kilotons in 2025 and estimated to grow from 574.22 kilotons in 2026 to reach 682.82 kilotons by 2031, at a CAGR of 3.52% during the forecast period (2026-2031). The market has preserved volume growth despite hyperinflation that touched 140% in 2024 and new sanctions in 2025 that tightened access to foreign inputs. Essential demand for beverage, pharmaceutical, food, and export-oriented premium goods sustains baseline consumption, while the returnable-bottle culture prevalent among breweries and soft-drink fillers keeps circulation losses low. Beverage-tax incentives encourage refillable glass loops, the government’s Extended Producer Responsibility (EPR) regime favors recyclable materials, and growing craft alcohol exports shape specialty bottle orders. However, energy-supply volatility, an unstable exchange rate, and limited cullet collection raise input costs and cap utilization rates across furnaces.
Key Report Takeaways
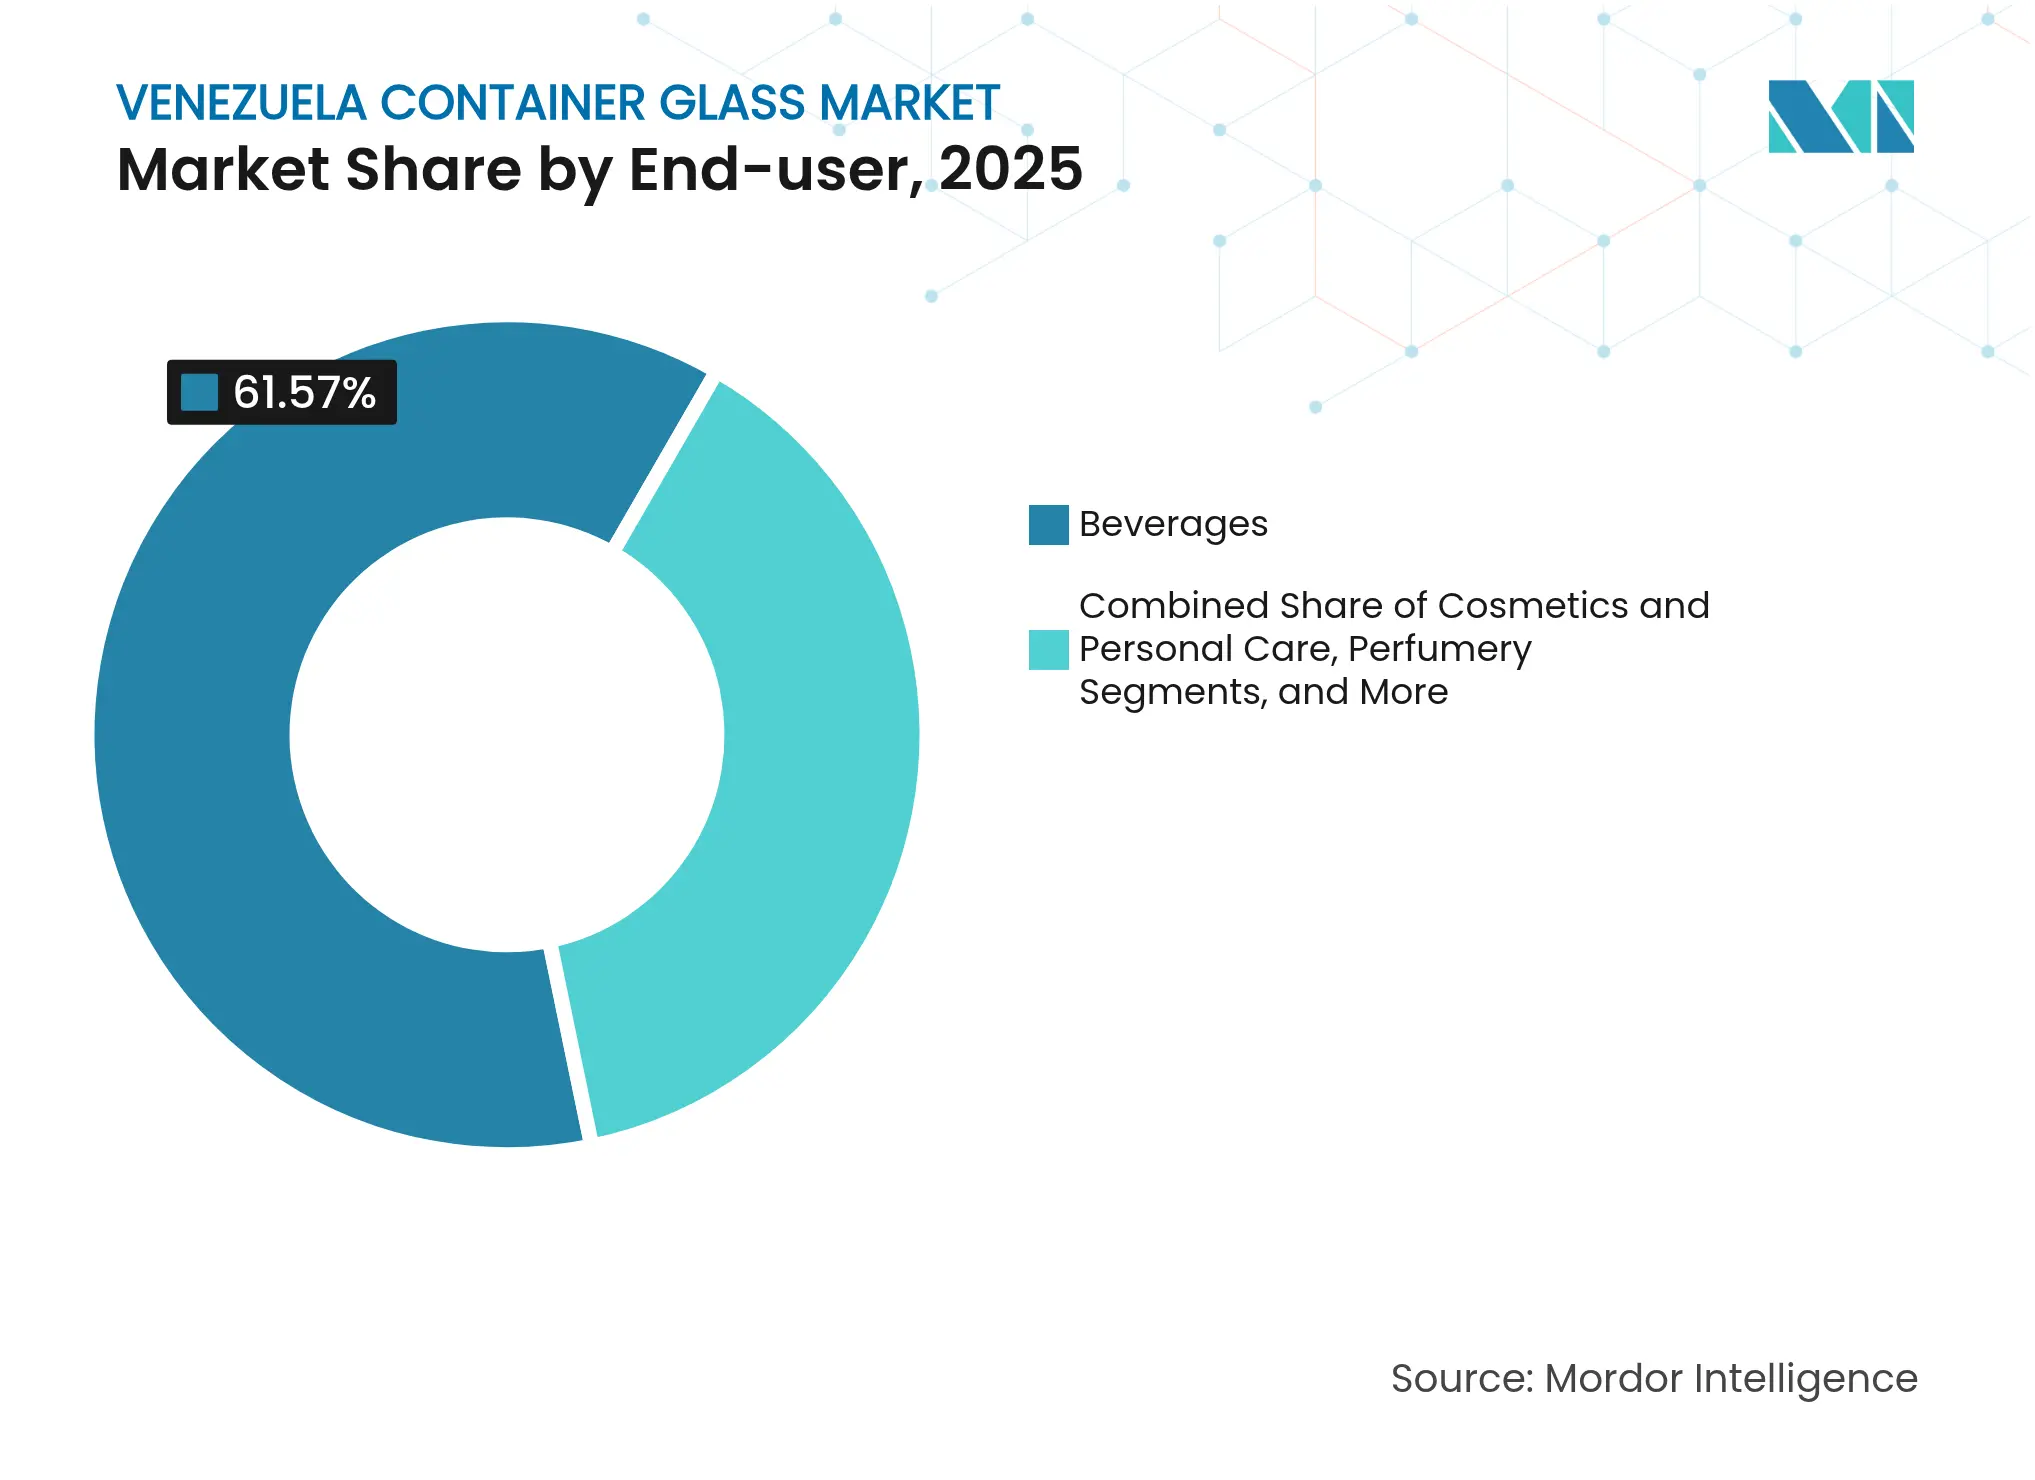
- By end user, beverages held 61.57% of the Venezuela container glass market share in 2025.
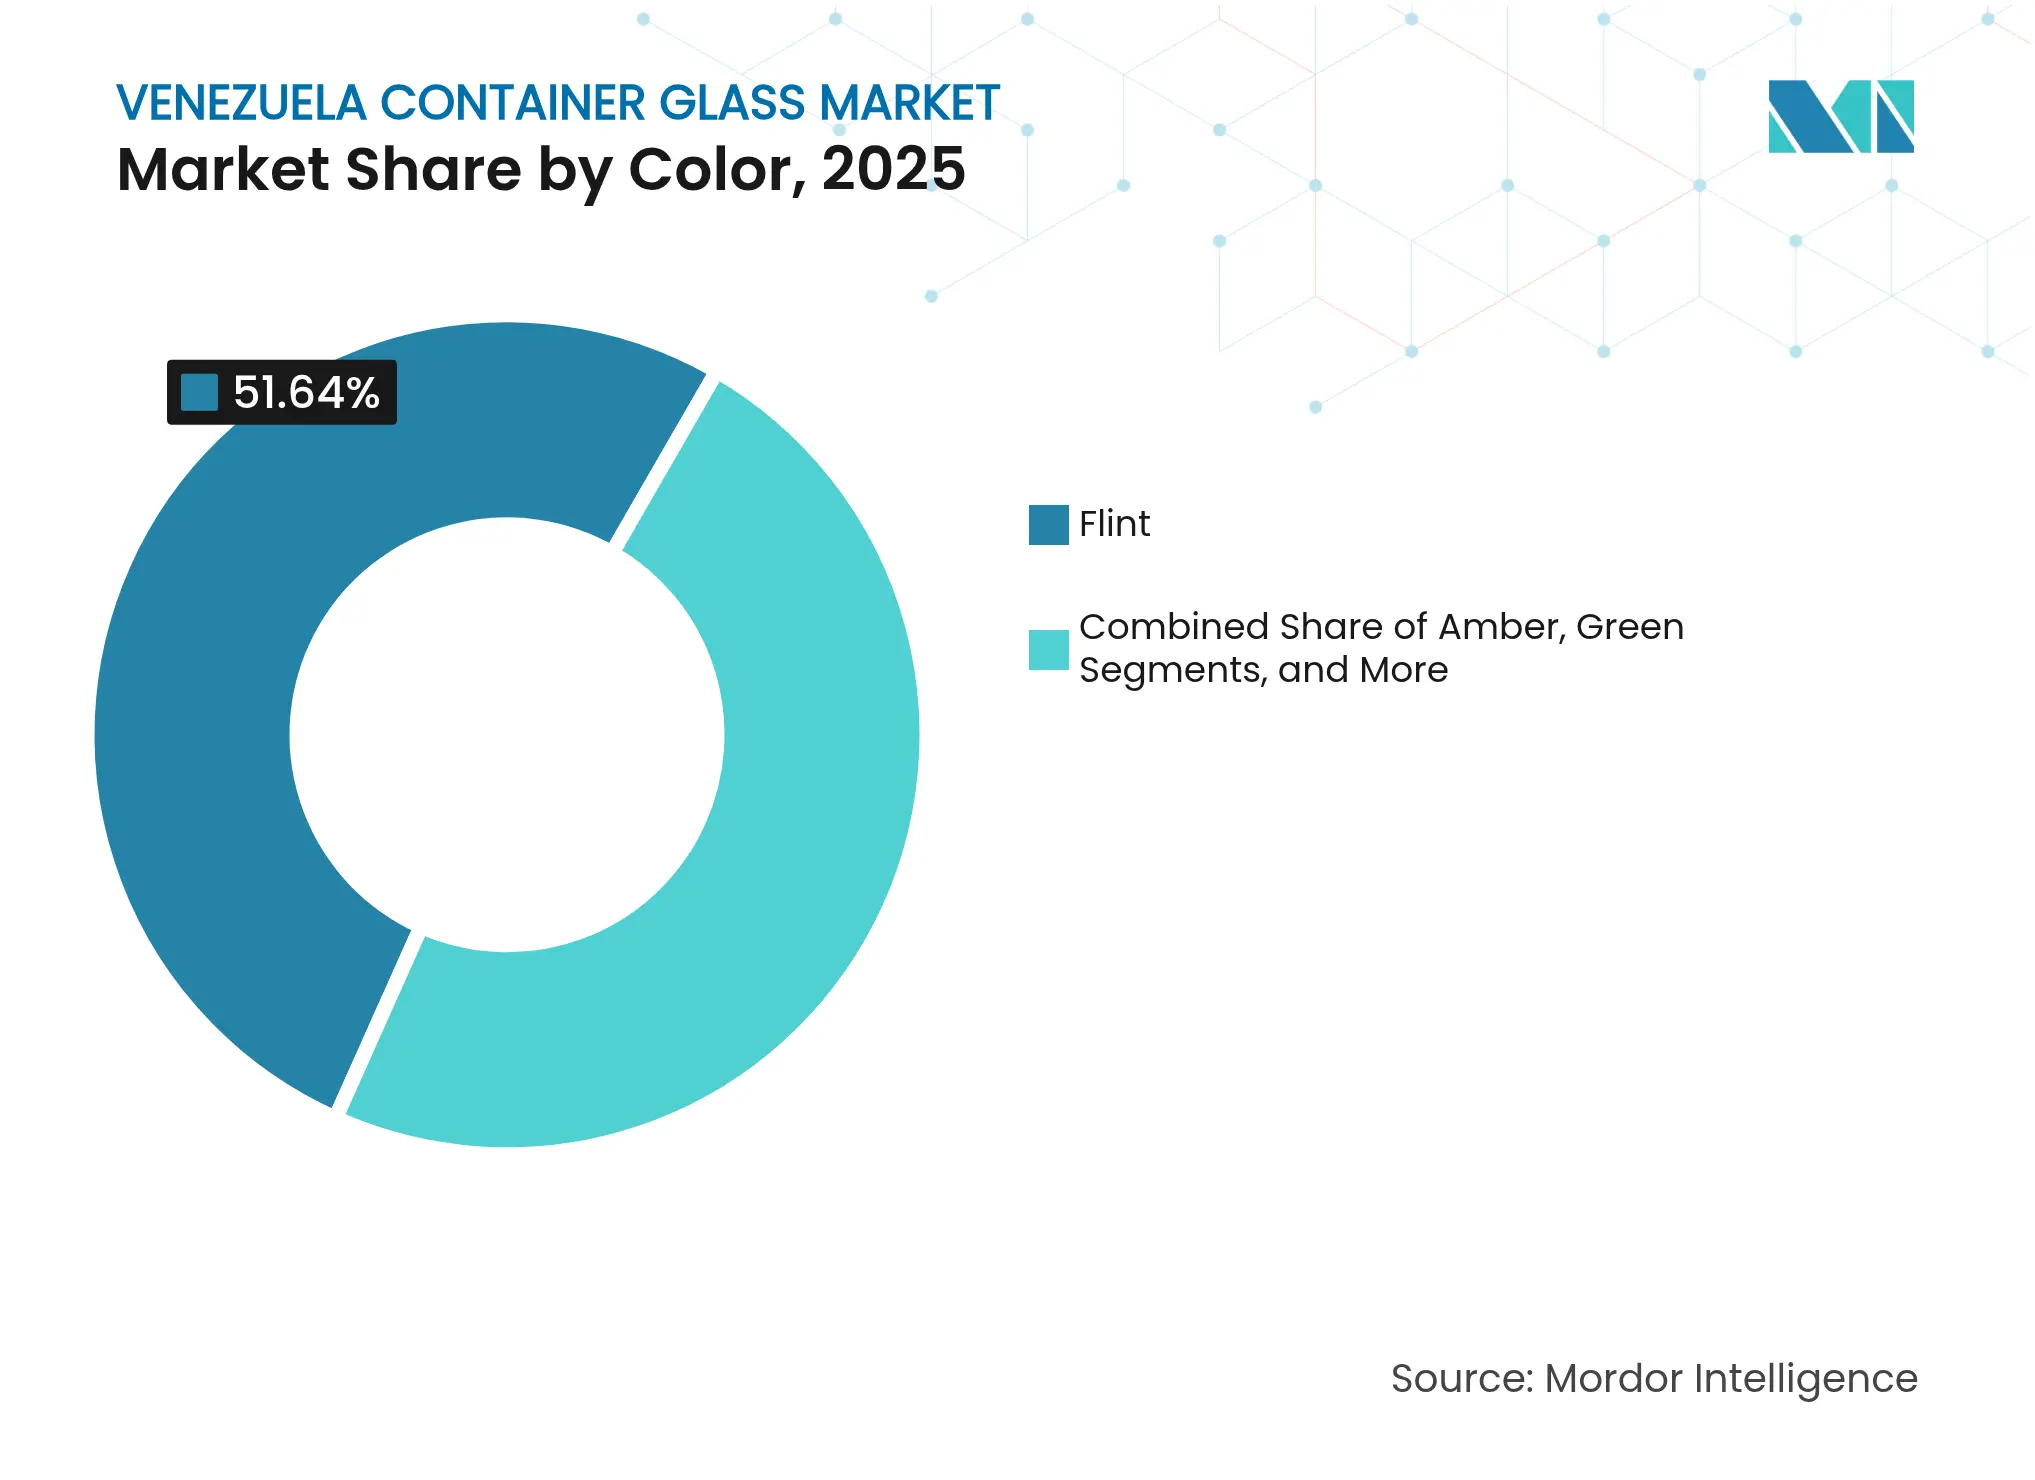
- By color, the Venezuela container glass market size for amber is forecast to expand at the strongest 3.74% CAGR through 2031.
Note: Market size and forecast figures in this report are generated using Mordor Intelligence's proprietary estimation framework, updated with the latest available data and insights as of 2026.
Venezuela Container Glass Market Trends and Insights
Drivers Impact Analysis
| Driver | (~) % Impact on CAGR Forecast | Geographic Relevance | Impact Timeline | |||
|---|---|---|---|---|---|---|
Surging FMCG brands adopting premium glass packaging Surging FMCG brands adopting premium glass packaging | +0.8% | National - Caracas and Valencia industrial zones | Medium term (2-4 years) | (~) % Impact on CAGR Forecast:+0.8% | Geographic Relevance:National - Caracas and Valencia industrial zones | Impact Timeline:Medium term (2-4 years) |
Government push for recyclable materials in food contact applications Government push for recyclable materials in food contact applications | +0.6% | National - compliance concentrated in major cities | Long term (≥ 4 years) | |||
Craft alcohol export revival boosting specialty bottles Craft alcohol export revival boosting specialty bottles | +0.4% | National production - exports to the United States, Colombia, Caribbean | Short term (≤ 2 years) | |||
Rising domestic pharmaceutical output needing inert containers Rising domestic pharmaceutical output needing inert containers | +0.5% | National pharmaceutical hubs | Medium term (2-4 years) | |||
Beverage tax incentives favoring returnable glass systems Beverage tax incentives favoring returnable glass systems | +0.3% | National beverage manufacturing centers | Long term (≥ 4 years) | |||
Venezuelan diaspora demand driving gourmet food glass exports Venezuelan diaspora demand driving gourmet food glass exports | +0.4% | Exports to the United States, Colombia, Spain | Short term (≤ 2 years) | |||
| Source: Mordor Intelligence | ||||||
Surging FMCG Brands Adopting Premium Glass Packaging
Domestic fast-moving consumer goods owners enhance brand perception in export outlets by switching to heavier, more highly decorated containers that align with diaspora expectations of authenticity and quality. The country’s EPR rules, which started in January 2021 under Resolution 0191, reward recyclable solutions, steering buyers toward glass that can demonstrate 25–30 refill turns per bottle.[1]PACKAGING SCHOOL, “EPR for Packaging in South America,” packagingschool.com Producers see higher shelf prices in the United States and European ethnic aisles, offsetting the up-front bottle cost, and international distributors report sell-in margins improving by 8–10 percentage points on “heritage” lines packaged only in flint or antique-tone flint. Order volumes have risen fastest in Caracas and Valencia, where integrated fillers can react quickly to export surges, encouraging independent mold investments at Venvidrio and Envases Venezolanos.
Government Push for Recyclable Materials in Food Contact Applications
The Ministry of Popular Power for Ecosocialism requires bi-annual EPR plans and fee payments in Petro cryptocurrency, raising the compliance bar for mono-material plastic packs. Harmonization with MERCOSUR food-contact rules further tightens thresholds for non-recyclable or multilayer substrates. Glass enjoys a 98% domestic recycling acceptance and negligible migration risk, helping brand owners meet local disclosure demands and European Shortened Nutrient Listing norms. Refillable glass loops trim foreign exchange outflow because every 10 million returnable bottles averts an estimated USD 3.2 million in fresh-pack imports at 2025 exchange rates. Over the long term, the mandate is expected to lift the Venezuela container glass market by around 0.6 percentage points of CAGR.
Craft Alcohol Export Revival Boosting Specialty Bottles
Rum and dark-spirit micro-distillers have revived Venezuela’s heritage styles, now offering premium 700ml expressions at duty-free and gourmet retailers across North America. Specialty amber bottles with embossing or ceramic-texture coatings protect light-sensitive liquors and support shelf prices above USD 40 per unit. Small-batch runs accelerate mold turnover at Venvidrio, whose short campaign furnace staged 22 job changes in 2024 compared with 12 in 2023.[2]KHS, “75 Percent Market Share for Beer, 90 Percent Market Share for Malt Beverages,” khs.com Export demand for alcohol is front-loaded in 2025-2026 because new bilateral agreements with Russia and China temporarily bypass some sanction-related port bottlenecks. The upside contributes approximately +0.4% to the CAGR of the Venezuela container glass market.
Rising Domestic Pharmaceutical Output Needing Inert Containers
Government healthcare self-sufficiency targets drive joint ventures with Russian and Chinese laboratories for injectables, suspensions, and ophthalmic solutions. Glass vials, ampules, and dropper bottles remain the only materials accepted for many sterile fills due to their zero extractables and thermal stability. Pharmaceutical fillers located in Guacara and Anzoátegui increased their procurement of Type III flint vials by 15% year-over-year in 2024 and expect another 9% rise in 2025, absorbing the slack created by weaker demand for soft-drink bottles. Over the medium term, this demand adds about +0.5% to the overall CAGR.
Restraints Impact Analysis
| Restraint | (~) % Impact on CAGR Forecast | Geographic Relevance | Impact Timeline | |||
|---|---|---|---|---|---|---|
High costs of production and energy supply High costs of production and energy supply | -1.2% | National manufacturing regions | Short term (≤ 2 years) | (~) % Impact on CAGR Forecast:-1.2% | Geographic Relevance:National manufacturing regions | Impact Timeline:Short term (≤ 2 years) |
Unstable foreign-exchange regime inflating import-dependent inputs Unstable foreign-exchange regime inflating import-dependent inputs | -0.9% | National, strongest at import-dependent plants | Medium term (2-4 years) | |||
Limited cullet collection infrastructure raising raw-material costs Limited cullet collection infrastructure raising raw-material costs | -0.3% | Urban centers | Long term (≥ 4 years) | |||
Competition from lightweight PET in carbonated drinks Competition from lightweight PET in carbonated drinks | -0.4% | Beverage segments | Medium term (2-4 years) | |||
| Source: Mordor Intelligence | ||||||
High Costs of Production and Energy Supply
Container-glass melting relies on continuous furnace temperatures of nearly 1,560 °C, rendering operations vulnerable to a grid that experienced 22 unplanned outages lasting longer than two hours in 2024. Although 84.24% of the generation is renewable hydro, falling reservoir levels at Guri Dam increase the frequency of load shedding. Furnaces cool by 20–30 °C during each outage, introducing batch instability and glass cord defects that elevate rejection rates to 7%, almost triple the South American average. Producers now maintain 18 hours of diesel for standby power, which increases variable costs by approximately USD 6.50 per ton of glass packed.[3]World Bank, “Venezuela Trade | WITS Data,” worldbank.org The resulting -1.2% drag is the single largest restraint on the Venezuela container glass market.
Unstable Foreign-Exchange Regime Inflating Import-Dependent Inputs
The bolivar depreciated from 69 to 91 per USD between March and May 2025. The implied 32% erosion in soda ash, feldspar, and cullet additives is priced on a CIF Miami parity. Import permits issued at the “exchange table” rate lag behind procurement cycles, forcing producers to pre-pay spare parts orders or risk multi-week furnace idling. Currency mismatch cost the industry an estimated USD 9 million in working capital in 2024, cutting EBITDA margins by around 140 basis points. This volatility lowers steady-state capacity utilization and removes 0.9 percentage points from the container glass market’s CAGR in Venezuela.
Segment Analysis
By End-User: Beverages Drive Volume While Pharmaceuticals Command Premiums
The beverage segment secured 61.57% of the Venezuela container glass market size in 2025, anchored by Cervecería Polar, whose four breweries fill nearly 23 million hectoliters and use returnable 222 ml flint bottles for 85% of stock. Refill fleets last up to 35 cycles, smoothing furnace pull rates at Venvidrio and supporting an efficient circular economy loop. Carbonated soft-drink brands, such as Maltín Polar, hold a 90% domestic share but are increasingly splitting volumes with PET in 1.5-liter take-home packs, diverting some growth pressure away from glass. Alcoholic ready-to-drink variants, energy drinks, and functional teas nonetheless favor glass for shelf differentiation, mitigating substitution losses over the forecast period.
Cosmetics and personal care contribute only 3.92% by weight but expand at a 3.12% CAGR to 2031. Marketers target Venezuelan diaspora clusters in Florida, Bogotá, and Madrid with “heritage” sacha inchi oil serums and cocoa-butter creams, packaged in thick-walled flint jars that mimic European pharmacy aesthetics. Export dealers report wholesale prices USD 1.80 higher on glass-jar SKUs versus plastic equivalents, allowing brand owners to absorb shipping surcharges while maintaining a 22% gross margin. Pharmaceutical demand for parenteral vials retains premium price realization and taps into capacity freed by line conversions in the beverage category.
Note: Segment shares of all individual segments available upon report purchase
By Color: Flint Dominance Challenged by Amber Growth
Flint captured 51.64% of the Venezuela container glass market share in 2025, long favored by breweries and preserve producers that rely on product visibility. Unit pull for Flint is strongly correlated with domestic consumption cycles, showing slight seasonality peaks around Christmas. Amber, at 38.55%, exhibits the fastest trajectory with a 3.74% CAGR, driven by a combination of pharmaceutical and craft-rum orders. Amber’s UV-blocking qualities raise specification compliance in new injectable lines funded under Russia-Venezuela technology transfer accords, while premium rum bottlers command elevated shelf prices using embossed amber designs. Green glass remains stable at 8.02% for niche malt beverages and mineral water, and “other colors” fill the balance at 1.79% for perfumery and giftware.
Note: Segment shares of all individual segments available upon report purchase
Geography Analysis
Production hubs concentrate around Caracas, Valencia, and Maracaibo, where furnace infrastructure, rail sidings, and bulk LPG lines date back to the 1990s modernization programs. The central-coastal corridor between Catia and Guatire supplies over 60% of glass containers in circulation. Western plants in Zulia leverage proximity to Maracaibo’s brewery and tanker port, but face a higher power stability risk due to grid fragmentation.
Domestic logistics costs average USD 35 per ton for a 450 km truck haul from Valencia to Puerto La Cruz. Frequent diesel shortages lead to queuing delays, which increase turnaround times by 18%. Consequently, bottle manufacturers locate production as close as possible to fillers, reinforcing regional clustering and inhibiting new entrants in peripheral states such as Amazonas or Delta Amacuro.
Exports account for roughly 4% of output by weight but more than 11% by revenue. Shipments to the United States reached USD 1.31 million in 2024, primarily craft-spirit bottles entering through Port Everglades. Colombia and Spain represent the next largest outlets, served by road and short-sea routes, respectively. Ongoing port-terminal closures triggered by 2025 sanctions extend cargo dwell times up to 11 days, pushing exporters toward overland options like the Cúcuta route for Colombian deliveries. Growth strategies now prioritize higher-margin United States diaspora channels over bulk sales into Latin America, supporting the value mix but adding route risk.

Competitive Landscape
Market Concentration
The domestic supply base shows moderate concentration. Venvidrio and Envases Venezolanos together held an estimated 64% of packed-glass output in 2024. O-I maintains a representative office and technical staff to review joint-venture or licensing opportunities, although no new furnace build has been announced since 2018. Cervecería Polar contracts exclusively with Venvidrio for small-format returnable bottles, and Coca-Cola FEMSA uses Productos de Vidrio S.A. as its lone qualified supplier for Venezuelan operations. This single-sourcing heightens counterparty risk but enables fast bottle redesign cycles to accommodate relief embossing and lightweighting.
Firms emphasize export-grade quality certification, such as ISO 15378, for pharmaceutical primary packaging to tap hard-currency orders. Energy-management retrofits dominate capital budgets, with oxy-fuel burners and phase-change heat recuperators promising fuel savings of 8-10%. However, financing remains scarce; most upgrades rely on vendor credit from European furnace service companies or bilateral credit lines anchored by hydrocarbons collateral.
Strategic partnerships broaden. In May 2025, the government ratified a 10-year accord with Russia covering finance, technology, and manufacturing, opening paths for furnace refractories and IS machine components to bypass conventional dollar clearing. Chinese National Petroleum Corporation (CNPC) re-entered discussion rounds in February 2025 regarding grid reinforcement investments that could indirectly enhance glass-plant uptime. These moves illustrate how geopolitical alliances dictate competitive positioning more than purely commercial factors.
Venezuela Container Glass Industry Leaders

*Disclaimer: Major Players sorted in no particular order
Recent Industry Developments
- May 2025: Caracas signed a 10-year cooperation pact with Russia covering pharmaceuticals and heavy industry, offering potential credit for bottle-furnace upgrades.
- April 2025: United States introduced secondary tariffs up to 45% on goods from countries buying Venezuelan crude, disrupting inbound logistics for glass-making inputs.
- March 2025: Official USD exchange rate weakened from 69 to 91 bolivars, widening import-cost gaps for soda ash and spare parts.
- February 2025: Government began talks with CNPC on potential reinvestment in the oil sector to stabilize industrial energy supply.
Table of Contents for Venezuela Container Glass Industry Report
1. INTRODUCTION
- 1.1Study Assumptions and Market Definition
- 1.2Scope of the Study
2. RESEARCH METHODOLOGY
3. EXECUTIVE SUMMARY
4. MARKET LANDSCAPE
- 4.1Market Overview
- 4.2Market Drivers
- 4.2.1Surging FMCG brands adopting premium glass packaging
- 4.2.2Government push for recyclable materials in food contact applications
- 4.2.3Craft alcohol export revival boosting specialty bottles
- 4.2.4Rising domestic pharmaceutical output needing inert containers
- 4.2.5Beverage tax incentives favouring returnable glass systems
- 4.2.6Venezuelan diaspora demand driving gourmet food glass exports
- 4.3Market Restraints
- 4.3.1High costs of production and energy supply
- 4.3.2Unstable foreign-exchange regime inflating import-dependent inputs
- 4.3.3Limited cullet collection infrastructure raising raw-material costs
- 4.3.4Competition from lightweight PET in carbonated drinks
- 4.4PESTEL Analysis
- 4.5Industry Value Chain Analysis
- 4.6Container Glass Furnace Capacity and Locations in Venezuela
- 4.6.1Plant Locations and Year of Commencement
- 4.6.2Production Capacities
- 4.6.3Types of Furnaces
- 4.6.4Color of Glass Produced
- 4.7Export-Import Data of Container Glass - Covering Key Import and Export Destinations
- 4.7.1Import Volume and Value, 2021-2024
- 4.7.2Export Volume and Value, 2021-2024
- 4.8Porter's Five Forces Analysis
- 4.8.1Threat of New Entrants
- 4.8.2Bargaining Power of Suppliers
- 4.8.3Bargaining Power of Buyers
- 4.8.4Threat of Substitutes
- 4.8.5Competitive Rivalry
- 4.9Raw Material Analysis
- 4.10Recycling Trends for Glass Packaging
- 4.11Demand vs Supply Analysis for Glass Packaging
5. MARKET SIZE AND GROWTH FORECASTS (VOLUME)
- 5.1By End-user
- 5.1.1Beverages
- 5.1.1.1Alcoholic
- 5.1.1.1.1Beer
- 5.1.1.1.2Wine
- 5.1.1.1.3Spirits
- 5.1.1.1.4Other Alcoholic Beverages (Cider and Other Fermented Drinks)
- 5.1.1.2Non-Alcoholic
- 5.1.1.2.1Juices
- 5.1.1.2.2Carbonated Drinks (CSDs)
- 5.1.1.2.3Dairy Product Based Drinks
- 5.1.1.2.4Other Non-Alcoholic Beverages
- 5.1.2Food (Jam, Jelly, Marmalades, Honey, Sausages and Condiments, Oil, Pickles)
- 5.1.3Cosmetics and Personal Care
- 5.1.4Pharmaceuticals (excluding Vials and Ampoules)
- 5.1.5Perfumery
- 5.2By Color
- 5.2.1Green
- 5.2.2Amber
- 5.2.3Flint
- 5.2.4Other Colors
6. COMPETITIVE LANDSCAPE
- 6.1Market Concentration
- 6.2Strategic Moves and Developments
- 6.3Company Market Share Analysis, (Based on Latest Production Capacity)
- 6.4Company Profiles (includes Global level Overview, Market level overview, Core Segments, Financials as available, Strategic Information, Market Rank/Share for key companies, Products and Services, and Recent Developments)
- 6.4.1Glass Products S.A. - Produvisa
- 6.4.2Venezolana del Vidrio C.A.
- 6.4.3Venezuelan Packaging S.A.
- 6.4.4Anayansi C.A.
- 6.4.5Vidrios Domesticos MAV C.C.S.
- 6.4.6O-I Peldar Venezuela C.A.
- 6.4.7Envases Venezolanos S.A.
- 6.4.8Vidrios Venvidrio S.A.
- 6.4.9Atlantic Packaging C.A.
- 6.4.10Vidrios Venezolanos Planos C.A.
- 6.4.11Cristaleria Nacional C.A.
- 6.4.12Saint-Gobain Containers Venezuela C.A.
- 6.4.13Fabrica de Vidrios los Andes C.A.
- 6.4.14C.A. Lajasmil
- 6.4.15Vidrieria Industrial de Oriente C.A.
- 6.4.16Vidrios La Victoria C.A.
- 6.4.17Vidrios del Centro C.A.
- 6.4.18Grupo Venebar S.A.
- 6.4.19Vidrios El Paso C.A.
- 6.4.20Vidrios Carabobo C.A.
7. MARKET OPPORTUNITIES AND FUTURE OUTLOOK
- 7.1White-space and Unmet-Need Assessment
Venezuela Container Glass Market Report Scope
Container glass is used in the alcoholic and non-alcoholic beverage industries due to its ability to maintain chemical inertness, sterility, and non-permeability. Glass packaging is valued for its unique properties, including its transparency, inertness, and ability to preserve the quality and integrity of its contents. It is often chosen for products where purity, safety, and environmental sustainability are paramount concerns.
The Venezuela Container Glass Market is segmented by end-user vertical (beverages [alcoholic beverages (beer, wine, spirits, and other alcoholic beverages {cider and other fermented drinks}), non-alcoholic beverages (juices, carbonated drinks (CSDs), dairy product-based drinks, other non-alcoholic beverages)], food [jam, jelly, marmalades, honey, sausages and condiments, oil, pickles], cosmetics and personal care, pharmaceuticals (excluding vials and ampoules), and perfumery, and by color (green, amber, flint and other colors). The report offers market forecasts and size in volume (kilotons) for all the above segments.