Ukraine Container Glass Market Size and Share
Market Overview
| Study Period | 2020 - 2031 |
|---|---|
| Base Year For Estimation | 2025 |
| Forecast Data Period | 2026 - 2031 |
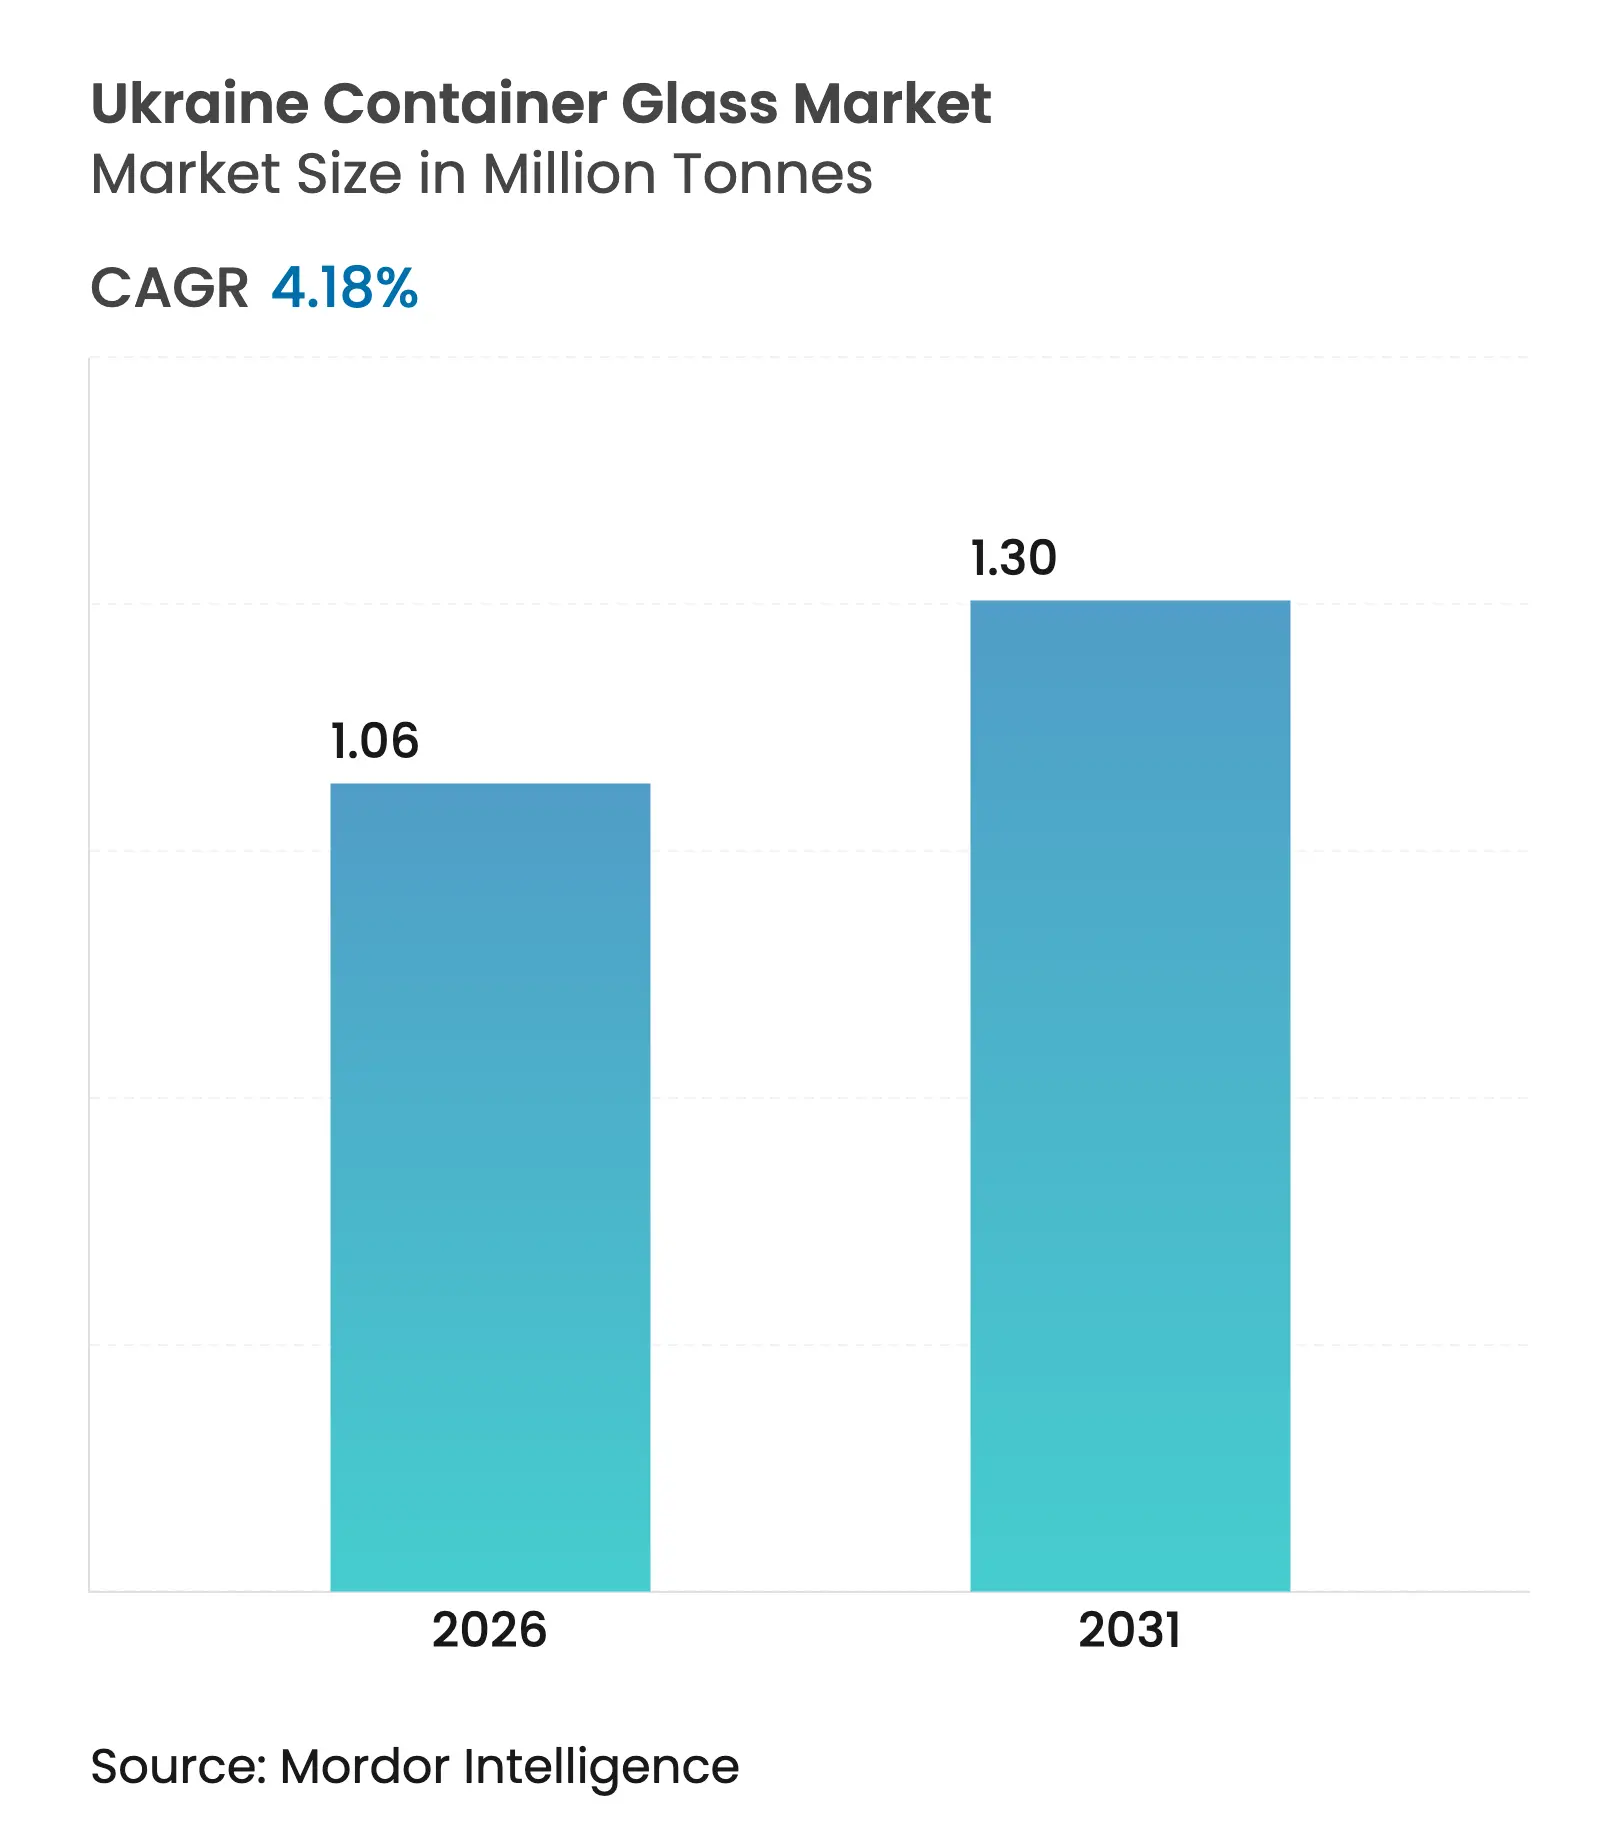
| Market Volume (2026) | 1.06 Million tonnes |
| Market Volume (2031) | 1.3 Million tonnes |
| CAGR | 4.18 % |
| Market Concentration | High |
Major Players *Disclaimer: Major Players sorted in no particular order. Image © Mordor Intelligence. Reuse requires attribution under CC BY 4.0. |
Ukraine Container Glass Market Analysis by Mordor Intelligence
The Ukraine Container Glass Market size was valued at 1.02 million tonnes in 2025 and estimated to grow from 1.06 million tonnes in 2026 to reach 1.3 million tonnes by 2031, at a CAGR of 4.18% during the forecast period (2026-2031). In the short term, reconstruction‐driven demand, EU tariff-free access under the DCFTA, and the rapid rebound of alcoholic beverage production underpin steady volume growth. Over the medium term, the rising preference for eco-friendly, chemically inert packaging strengthens glass’s competitive edge versus plastics, while investments in lightweighting and decoration broaden end-use possibilities. Long-term opportunities hinge on securing affordable energy and higher cullet ratios that temper cost volatility and support carbon-reduction goals. Competitive dynamics remain moderate; the Sklo Alliance leverages its four-color capability and 18-country export reach, while smaller, agile firms use customized runs to target premium craft beverages and cosmetics.
Key Report Takeaways
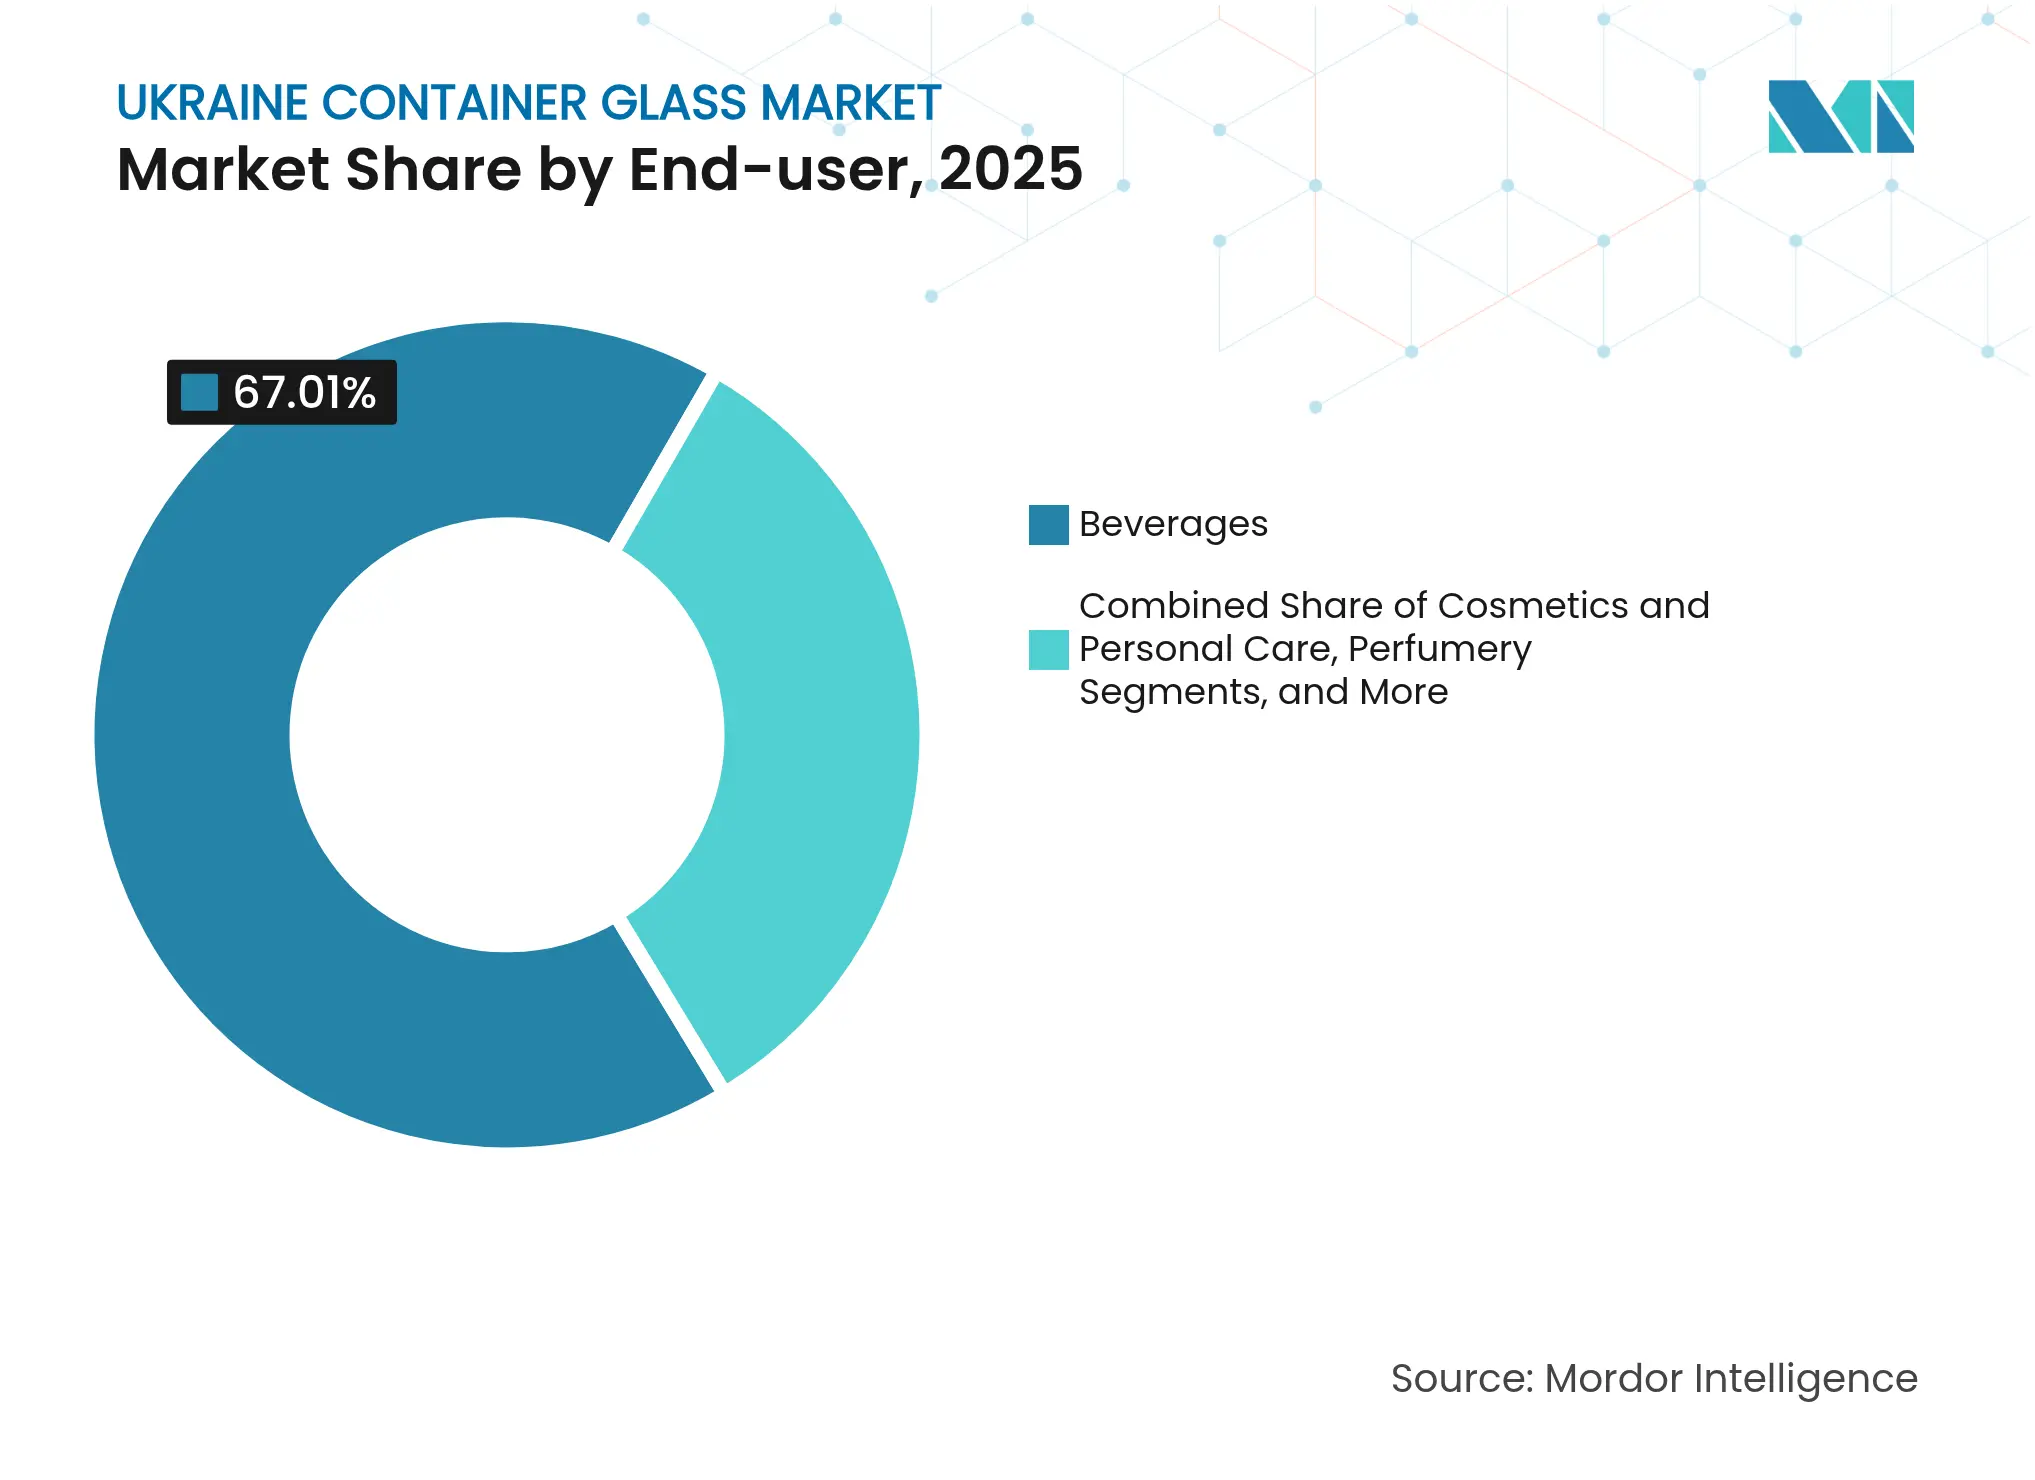
- By end-user, beverages captured 67.01% of the Ukraine container glass market share in 2025.
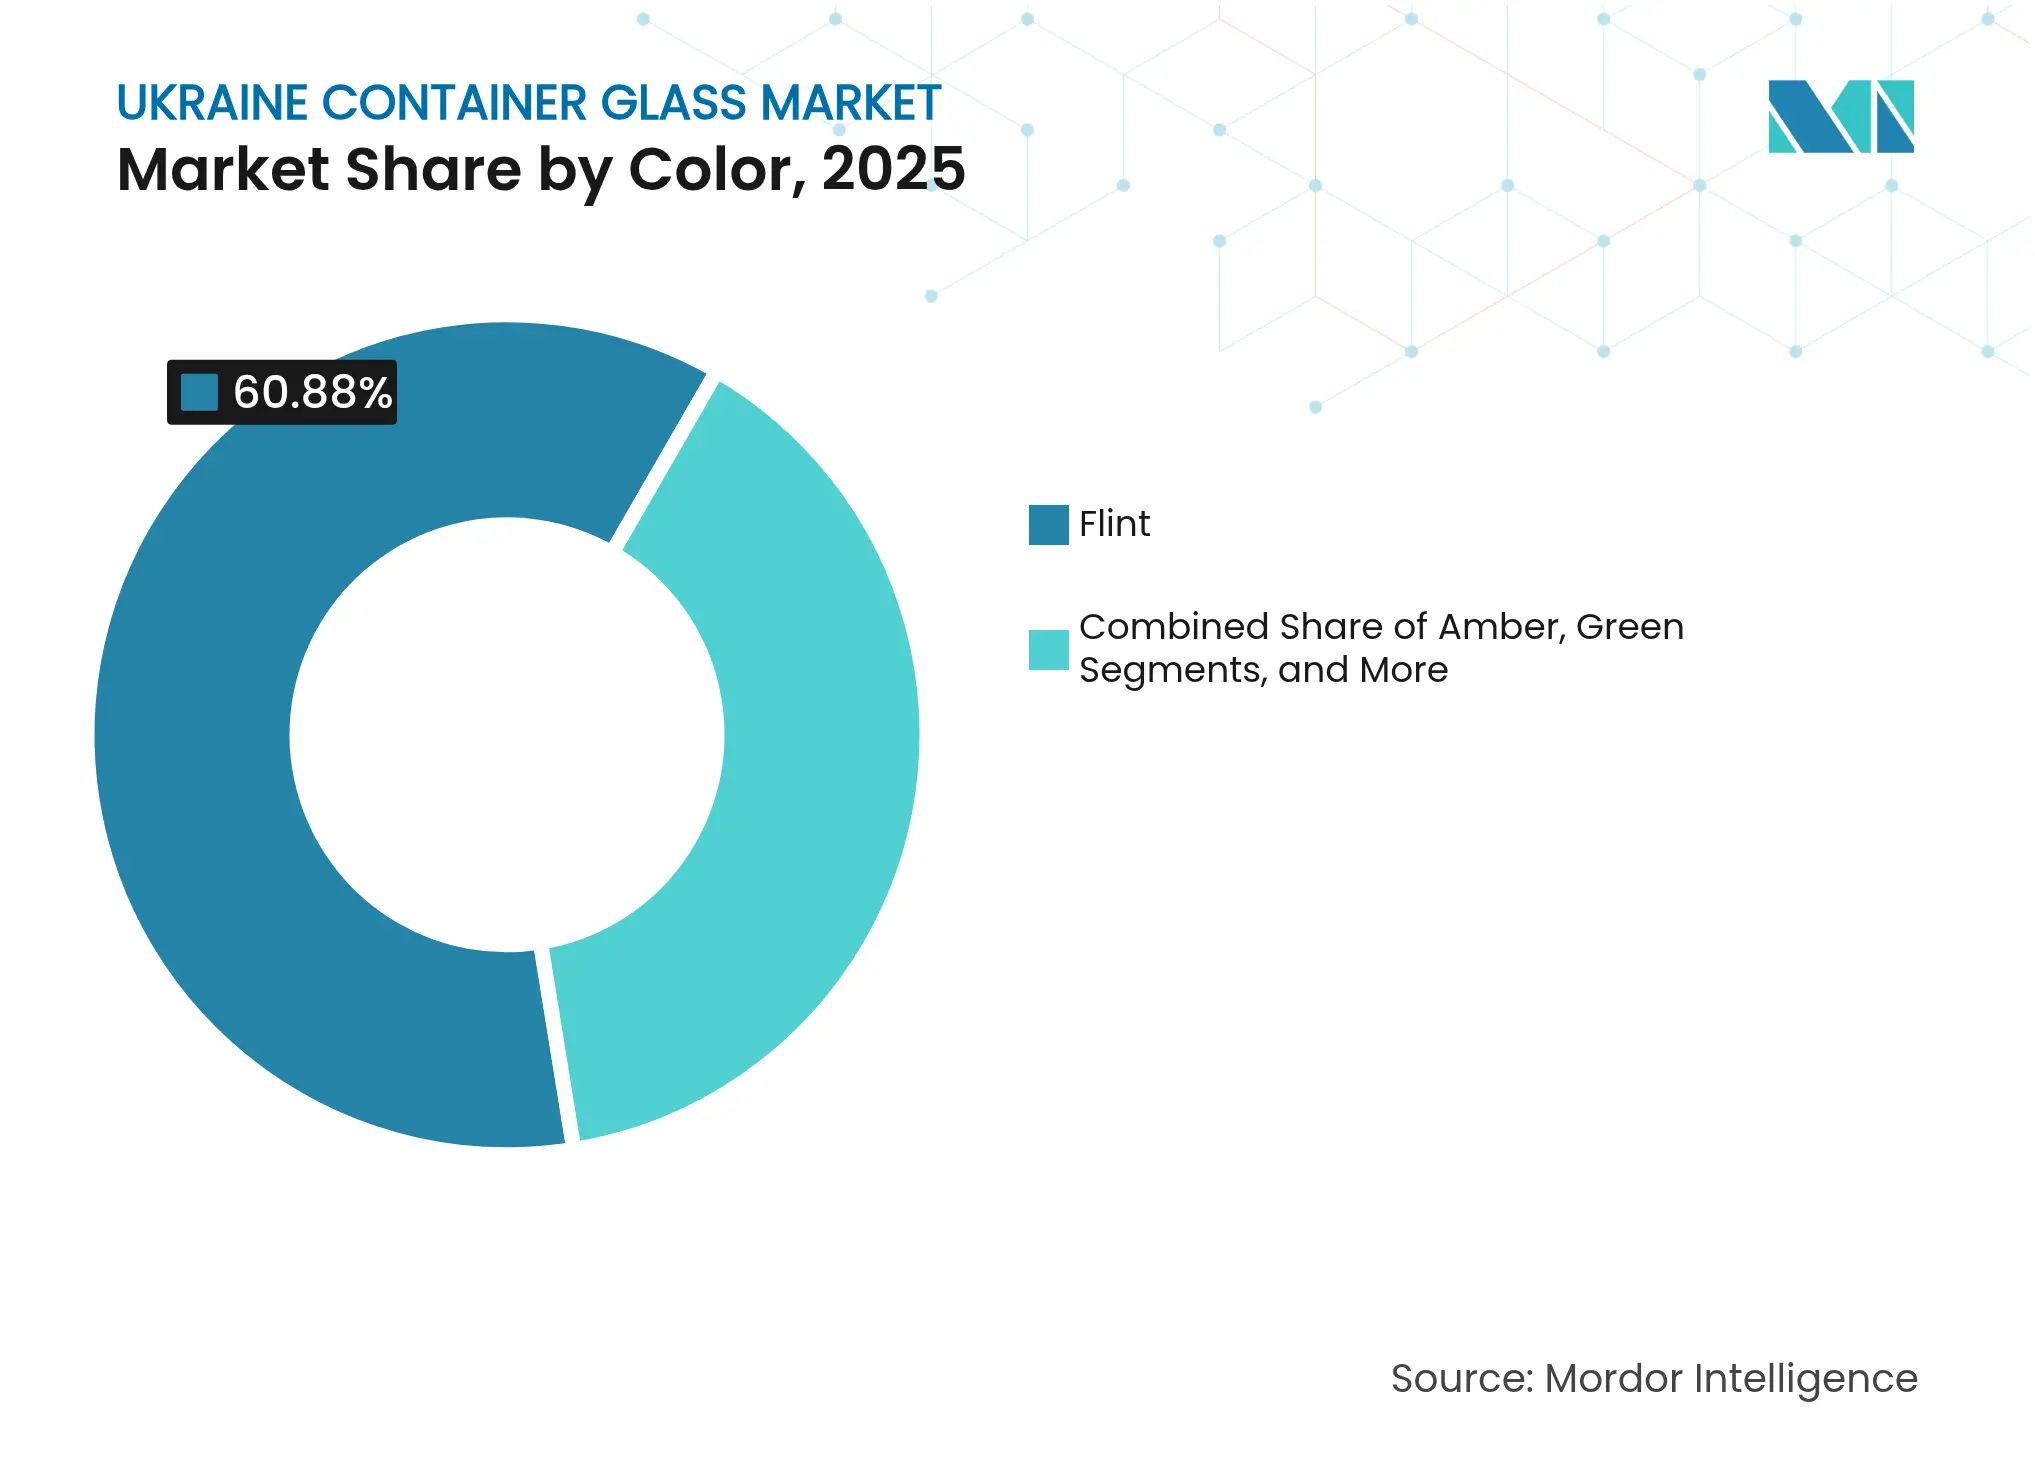
- By color, the Ukraine container glass market for amber glass is projected to grow at a 5.23% CAGR between 2026-2031.
Note: Market size and forecast figures in this report are generated using Mordor Intelligence's proprietary estimation framework, updated with the latest available data and insights as of 2026.
Ukraine Container Glass Market Trends and Insights
Drivers Impact Analysis
| Driver | (~) % Impact on CAGR Forecast | Geographic Relevance | Impact Timeline | |||
|---|---|---|---|---|---|---|
Eco-friendly and inert packaging preference Eco-friendly and inert packaging preference | +0.8% | Global with EU focus | Medium term (2-4 years) | (~) % Impact on CAGR Forecast:+0.8% | Geographic Relevance:Global with EU focus | Impact Timeline:Medium term (2-4 years) |
Alcoholic and non-alcoholic drinks growth Alcoholic and non-alcoholic drinks growth | +1.2% | National with EU spillover | Short term (≤ 2 years) | |||
Food and cosmetics sector expansion Food and cosmetics sector expansion | +0.9% | National, western regions | Medium term (2-4 years) | |||
EU export opportunities via DCFTA EU export opportunities via DCFTA | +1.1% | EU-oriented | Long term (≥ 4 years) | |||
Technological advancements in forming methods Technological advancements in forming methods | +0.4% | National, with technology transfer from EU partners | Long term (≥ 4 years) | |||
Brand differentiation through decoration and customization Brand differentiation through decoration and customization | +0.3% | Premium segments, EU export markets | Medium term (2-4 years) | |||
| Source: Mordor Intelligence | ||||||
Consumer preference for eco-friendly and inert packaging
Heightened sustainability mandates across EU markets make fully recyclable, chemically inert containers a procurement priority for food and beverage brands sourcing from Ukraine's container glass market suppliers. A 10% rise in cullet use reduces melting energy by roughly 3%, lowering costs and emissions that matter under Extended Producer Responsibility rules adopted by Ukraine’s export partners. Domestic fillers of jams, honey, and condiments use this narrative to command shelf premiums at German and Polish retailers. Larger producers embed QR-coded “recycle me” labels to encourage take-back loops, which boosts cullet availability. Combined, these initiatives reinforce glass as the circular-economy solution of choice, translating into stable baseline demand for the Ukrainian container glass market.
Growth in alcoholic beverages and non-alcoholic drinks
Beer, wine, and spirits production rebounded quickly as breweries relocated westward and tapped the craft movement, requesting short-run amber and green bottles with heavier embossing for brand differentiation. Ukrainian vintners added 1,800 ha of vineyards in 2024 and shipped record volumes to Slovakia, propelling steady orders for premium flint and specialty tinted containers. Soft-drink fillers revived idle lines under licensing deals with global soda brands, each deal adding multi-year procurement contracts that anchor furnace utilization. Health-centric juices utilize clear, lightweight bottles that trim freight costs by 18% while maintaining visual appeal. Collectively, beverage momentum contributes a 1.2% uplift to the segment-level CAGR and underpins the furnace expansion projects announced for 2026 commissioning.
Expansion of food and cosmetics sectors driving premium glass packaging
Reconstruction incentives channeled USD 31.5 billion into housing and agri-processing, spurring dozens of jam, sauce, and condiment plants that specify flint jars with narrow tolerances for hot-fill performance. Simultaneously, L’Oréal and Beiersdorf's contract manufacturers opened workshops adjacent to Kyiv, demanding pharmaceutical-grade containers with pristine surface quality. Glass decorators installed multi-color UV inks to supply limited-edition runs, which increased unit prices by 25%. Rising disposable incomes in urban centers drive domestic demand for premium skincare lines that require inert, non-leaching packaging. This multi-sector pull raises baseline utilization, cushioning the Ukraine container glass market from cyclical swings in any single vertical.
Export opportunities to EU markets due to proximity and trade agreements
The DCFTA eliminated 98.1% of EU tariffs on Ukrainian industrial goods, making door-to-door deliveries to Poland or Germany as quick as 36-48 hours and 7-9% cheaper than Turkish alternatives. Mutual recognition of conformity certificates slashed administrative lead times, allowing Ukrainian fillers to load containers directly to retail buyers. Western-region factories invested in rail sidings synchronized with European Union EU) gauge routes, thereby compressing logistics bottlenecks.
Restraints Impact Analysis
| Restraint | (~) % Impact on CAGR Forecast | Geographic Relevance | Impact Timeline | |||
|---|---|---|---|---|---|---|
High energy costs High energy costs | -1.4% | Nationwide | Short term (≤ 2 years) | (~) % Impact on CAGR Forecast:-1.4% | Geographic Relevance:Nationwide | Impact Timeline:Short term (≤ 2 years) |
PET and aluminum packaging competition PET and aluminum packaging competition | -0.9% | Nationwide, cost-sensitive niches | Medium term (2-4 years) | |||
Supply chain disruptions due to geopolitical instability Supply chain disruptions due to geopolitical instability | -0.7% | National, with spillover effects on export operations | Short term (≤ 2 years) | |||
Limited domestic raw material availability for soda-lime glass Limited domestic raw material availability for soda-lime glass | -0.5% | National, requiring increased import dependency | Long term (≥ 4 years) | |||
| Source: Mordor Intelligence | ||||||
High energy costs for glass melting and forming
Glass melting requires continuous firing at 1,500 °C, and volatile Ukrainian gas tariffs increased average furnace energy bills by 38% in 2024, eroding price competitiveness.[1]Hanno Böck, “Reducing Glass Industry Emissions with Sodium Hydroxide,” Industry Decarbonization, industrydecarbonization.com Bombed grid assets add outage risk, forcing diesel backup that further inflates overheads. Firms have installed waste-heat recovery systems to trim usage by 8% and are trialing electric boosts paired with rooftop solar to reduce peak demand. Yet capital-expenditure requirements delay full decarbonization, keeping the Ukrainian container glass market exposed to energy-price swings that reduce the prospective CAGR by 1.4 percentage points until 2027.
Competition from PET and aluminum packaging alternatives
PET bottles weigh 10 times less than glass, translating into a 40% freight savings for mass-market sodas. Meanwhile, aluminum cans chill faster and simplify stackability, luring breweries that are pursuing convenience-store growth. Unit pricing gaps widened as resin costs decreased in 2024, prompting value brands to consider replacing glass. Ukraine's container glass market leaders counter with 18-20% lightweighting, refillable-bottle schemes, and premium storytelling around product purity; yet, the allure of cheaper, lighter rivals still clips the forecast CAGR by 0.9 points through mid-decade.
Segment Analysis
By End-User: Beverages dominate but cosmetics surge
The beverages segment accounted for 67.01% of Ukraine's container glass market share in 2025, primarily driven by export orders for beer, wine, and spirits. Consequently, the segment’s volume equaled 683.5 kilotons, underpinning utilization across five major furnaces. Non-alcoholic drinks added diversity, with lactose-free kefir in clear flint bottles gaining shelf space in Baltic supermarkets. Export wineries favor heavier punted bottles signaling premium cues, whereas craft breweries specify short-neck amber formats conducive to small-batch runs. With reconstruction encouraging local juice processors, beverages are expected to still command more than 63% of Ukraine's container glass market share by 2031.
Cosmetics and personal care, though representing just 4.32% of 2025 volumes, are advancing at a 5.43% CAGR, the fastest among all uses. Multinational brands capitalize on duty-free EU access to position Ukraine as a near-shore hub for small-lot, high-margin skincare lines. Producers demand crystal-clear Type III glass with tight colorimetric tolerances, driving investments in inspection cameras and cold-end coating. Over the period, cosmetics could surpass pharmaceuticals to become the fourth-largest application, reinforcing the value-over-volume dimension within the broader Ukraine container glass market.
Note: Segment shares of all individual segments available upon report purchase
By Color: Flint remains staple as amber accelerates
Flint vessels retained 60.88% of 2025 volume, owing to their compatibility with food, pharma, and high-visibility cosmetics. Food processors appreciate transparency that allows consumers to inspect the purity of honey or fruit spreads, while pharmaceutical fillers require clear bottles for particulate checks. Brewery adoption of clear bottles for shandies and radlers provides incremental lift, although UV concerns still limit this use to select SKUs. Continuous quality upgrades, such as new online spectrophotometers, help assure consistent clarity, preserving Flint’s dominant role within the Ukrainian container glass market.
Amber, with a 5.23% CAGR, is the fastest-growing color category, transitioning from niche to mainstream as craft beer and artisanal spirit labels proliferate. The addition of a new amber line by Sklo Alliance in 2024 increased national capacity by 15%, easing the previous supply tightness. UV-blocking traits extend shelf stability for hop-forward IPAs, which are now exported to Germany and the Netherlands, while whiskey distillers opt for heavyweight amber bottles to convey authenticity. By 2031, Amber may capture nearly one-quarter of Ukraine's container glass market share if projected line startups stay on schedule.
Note: Segment shares of all individual segments available upon report purchase
Geography Analysis
The western oblasts, led by Lviv and Volyn, host three of the five largest furnaces and account for 41.60% of 2025 output, leveraging intact infrastructure and 200 km proximity to EU borders that shave transit times to Kraków or Košice to under eight hours. These plants specialize in flint jars and amber beer bottles destined for Polish supermarket chains, illustrating how geographic adjacency converts into freight savings that reinforce the competitiveness of the Ukrainian container glass market.
Central Ukraine, anchored by Kyiv and Poltava, supplies 38.20% of 2025 volumes and balances domestic fillers with export programs. PJSC Poltava Medical Glass Factory achieved ISO 15378 in late 2024, upgrading pharmaceutical-grade capacity and enabling 20% volume contracts with German generic-drug packers. Still, sporadic grid outages prompt dual-fuel furnace designs and on-site LNG storage, factors that marginally elevate cost per ton compared with western peers.
Southern oblasts, including Odesa and Mykolaiv, contributed only 20.20% in 2025 due to port disruptions; however, the reconstruction of logistics corridors and prospective sea-lane security guarantees could elevate their share to around 24.80% by 2031. Planned brown-field rebuilds aim to restart idle lines, integrating cold-end robotics to leapfrog legacy inefficiencies. With the reopening of Black Sea shipping lanes, these plants would enable direct container-glass exports to Mediterranean customers, thereby diversifying the geographic reach of the Ukrainian container glass market.

Competitive Landscape
Market Concentration
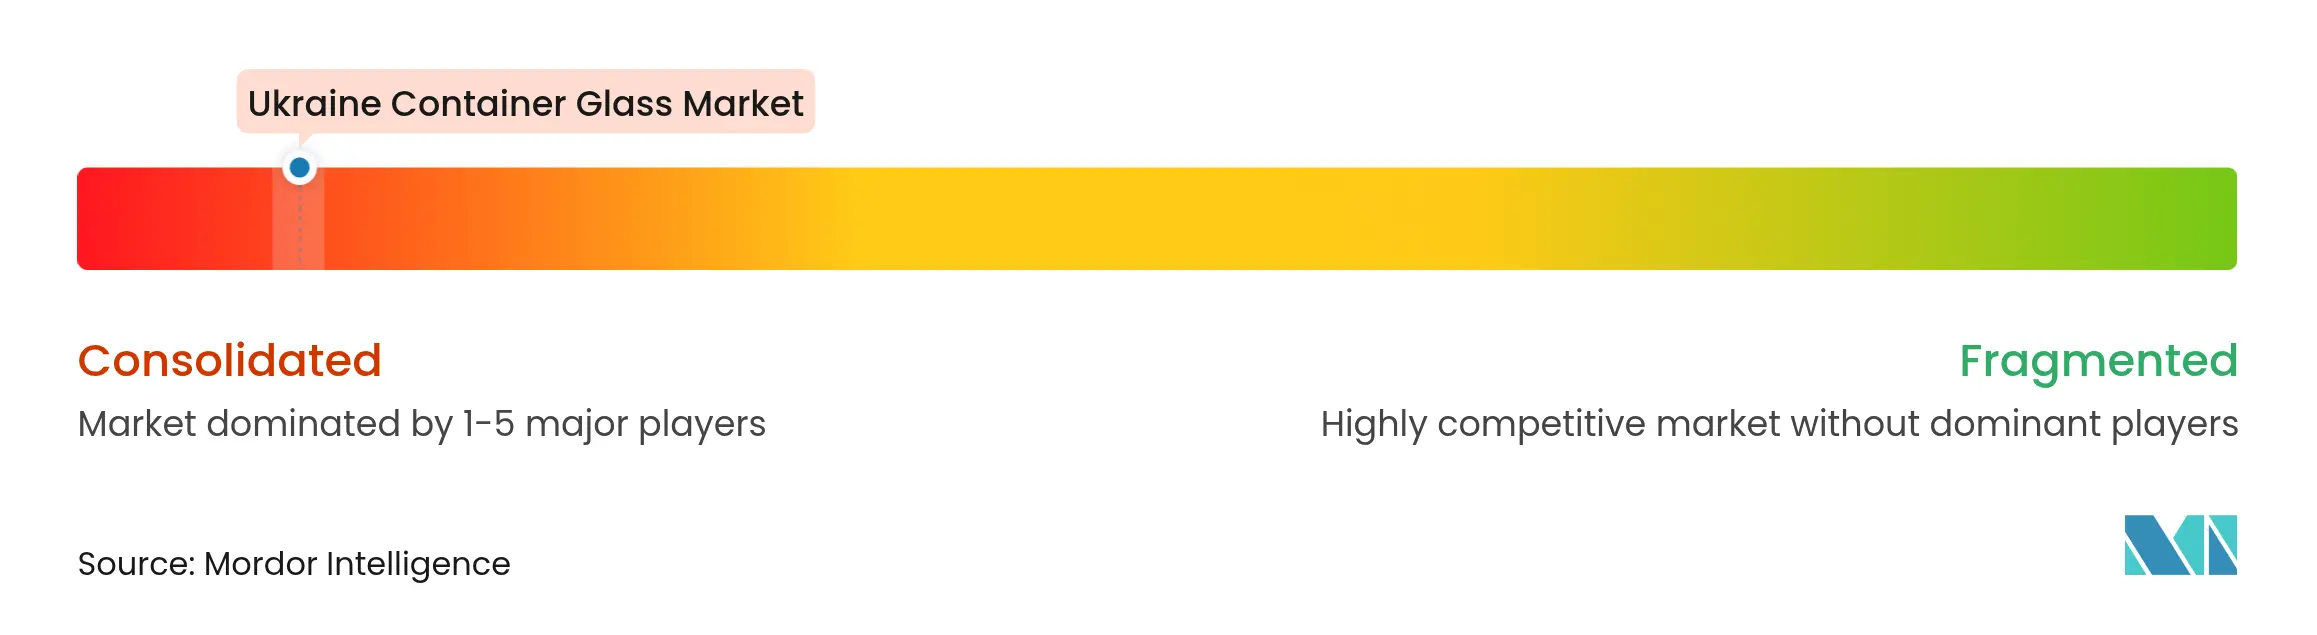
The market structure is moderately fragmented, with the top five firms controlling around 62% of the national melting capacity, indicating balanced rivalry yet leaving room for niche specialists to emerge. Sklo Alliance leads thanks to four-color flexibility and exports spanning 18 countries.[3]Sklo Alliance, “About Us,” vlnglass.com The firm modernized its Volnogorsk furnace with oxy-fuel burners, cutting specific gas use by 11% and supporting ISO 14001 compliance, a must-have for EU beverage clients.
NovaSklo plans a USD 256 million float-glass plant that will indirectly free container-glass raw sand supplies by 2027, easing procurement constraints faced by existing bottle producers. Meanwhile, PJSC Poltava Medical Glass Factory carved a lucrative lane in pharmaceutical vials, signing supply agreements with two Swiss CDMOs in 2025. Smaller outfits, such as DanCo Decor or Glasstech, specialize in value-added decoration and lightweight wine bottles, which command higher margins despite lower tonnage.
Competitive emphasis is shifting to secure energy at predictable prices. Enerhlas reduced consumption by 8% through waste-heat recovery, demonstrating that efficiency upgrades yield quick paybacks and support price parity with PET in certain SKUs. Contender firms explore power-purchase agreements with renewable developers to hedge tariff spikes. For those able to guarantee supply continuity, DCFTA access unlocks contracts with EU food majors seeking geographically diversified risk. Collectively, these factors define a Ukrainian container glass market where technology adoption, energy strategy, and export agility outweigh sheer scale.
Ukraine Container Glass Industry Leaders

*Disclaimer: Major Players sorted in no particular order
Recent Industry Developments
- February 2025: NovaSklo completed financing for its EUR 240 million (USD 256 million) float-glass plant, backed by German ECA guarantees.
- December 2024: Antimonopoly Committee approved Ukrenergo’s takeover of Lviv Insulator Company, nationalizing the country’s only glass-insulator plant.
- October 2024: PJSC Poltava Medical Glass Factory secured ISO 15378 certification, unlocking global pharma vial contracts.
- September 2024: DanCo Decor invested USD 12 million in advanced decoration gear for premium cosmetics bottles.
Table of Contents for Ukraine Container Glass Industry Report
1. INTRODUCTION
- 1.1Study Assumptions and Market Definition
- 1.2Scope of the Study
2. RESEARCH METHODOLOGY
3. EXECUTIVE SUMMARY
4. MARKET LANDSCAPE
- 4.1Market Overview
- 4.2Market Drivers
- 4.2.1Consumer preference for eco-friendly and inert packaging
- 4.2.2Growth in alcoholic beverages (beer, wine, spirits) and non-alcoholic drinks
- 4.2.3Expansion of food and cosmetics sectors driving premium glass packaging demand
- 4.2.4Export opportunities to EU markets due to proximity and trade agreements
- 4.2.5Technological advancements in forming methods
- 4.2.6Brand differentiation through decoration and customization
- 4.3Market Restraints
- 4.3.1High energy costs for glass melting and forming
- 4.3.2Competition from PET and aluminum packaging alternatives
- 4.3.3Supply chain disruptions due to geopolitical instability
- 4.3.4Limited domestic raw material availability for soda-lime glass
- 4.4PESTEL Analysis
- 4.5Industry Supply-Chain Analysis
- 4.6Container Glass Furnace Capacity and Locations in Ukraine
- 4.6.1Plant Locations and Year of Commencement
- 4.6.2Production Capacities
- 4.6.3Types of Furnaces
- 4.6.4Color of Glass Produced
- 4.7Export-Import Data of Container Glass - Covering Key Import and Export Destinations
- 4.7.1Import Volume and Value, 2021-2024
- 4.7.2Export Volume and Value, 2021-2024
- 4.8Porter’s Five Forces Analysis
- 4.8.1Threat of New Entrants
- 4.8.2Bargaining Power of Suppliers
- 4.8.3Bargaining Power of Buyers
- 4.8.4Threat of Substitutes
- 4.8.5Competitive Rivalry
- 4.9Raw Material Analysis
- 4.10Recycling Trends for Glass Packaging
- 4.11Demand vs Supply Analysis for Glass Packaging
5. MARKET SIZE AND GROWTH FORECASTS (VOLUME)
- 5.1By End-user
- 5.1.1Beverages
- 5.1.1.1Alcoholic
- 5.1.1.1.1Beer
- 5.1.1.1.2Wine
- 5.1.1.1.3Spirits
- 5.1.1.1.4Other Alcoholic Beverages (Cider and Other Fermented Drinks)
- 5.1.1.2Non-Alcoholic
- 5.1.1.2.1Juices
- 5.1.1.2.2Carbonated Drinks (CSDs)
- 5.1.1.2.3Dairy Product Based Drinks
- 5.1.1.2.4Other Non-Alcoholic Beverages
- 5.1.2Food (Jam, Jelly, Marmalades, Honey, Sausages and Condiments, Oil, Pickles)
- 5.1.3Cosmetics and Personal Care
- 5.1.4Pharmaceuticals (excluding Vials and Ampoules)
- 5.1.5Perfumery
- 5.2By Color
- 5.2.1Green
- 5.2.2Amber
- 5.2.3Flint
- 5.2.4Other Colors
6. COMPETITIVE LANDSCAPE
- 6.1Market Concentration
- 6.2Strategic Moves and Developments
- 6.3Company Market Share Analysis, (Based on Latest Production Capacity)
- 6.4Company Profiles (includes Global level Overview, Market level overview, Core Segments, Financials as available, Strategic Information, Market Rank/Share for key companies, Products and Services, and Recent Developments)
- 6.4.1Verallia Ukraine
- 6.4.2Sklo Alliance LLC
- 6.4.3Peskovskiy Glass Plant Ltd
- 6.4.4DanCo Decor LLC
- 6.4.5GlassOk LLC
- 6.4.6Enerhlas LLC
- 6.4.7Glasstech LLC
- 6.4.8Harant-Sklo LLC
- 6.4.9S-Interiors Glass Factory
- 6.4.10Orion Glass LLC
- 6.4.11Euroglas LLC
- 6.4.12Malinovsky GlassWorks LTD.
- 6.4.13Vetropak Hostomelʹsʹkyy Sklozavod
7. MARKET OPPORTUNITIES AND FUTURE OUTLOOK
- 7.1White-space and Unmet-Need Assessment
Ukraine Container Glass Market Report Scope
Container glass is used in the alcoholic and non-alcoholic beverage industries due to its ability to maintain chemical inertness, sterility, and non-permeability. Glass packaging is valued for its unique properties, including its transparency, inertness, and ability to preserve the quality and integrity of its contents. It is often chosen for products where purity, safety, and environmental sustainability are paramount concerns.
The Ukraine container glass market is segmented by end-user vertical (beverages [alcoholic beverages (beer, wine, spirits, and other alcoholic beverages {cider and other fermented drinks}), non-alcoholic beverages (juices, carbonated drinks (CSDs), dairy product-based drinks, other non-alcoholic beverages)], food [jam, jelly, marmalades, honey, sausages and condiments, oil, pickles], cosmetics and personal care, pharmaceuticals (excluding vials and ampoules), and perfumery), by color (green, amber, flint and other colors). The report offers market forecasts and size in volume (kilotons) for all the above segments.