Uruguay Container Glass Market Size and Share
Market Overview
| Study Period | 2020 - 2031 |
|---|---|
| Base Year For Estimation | 2025 |
| Forecast Data Period | 2026 - 2031 |
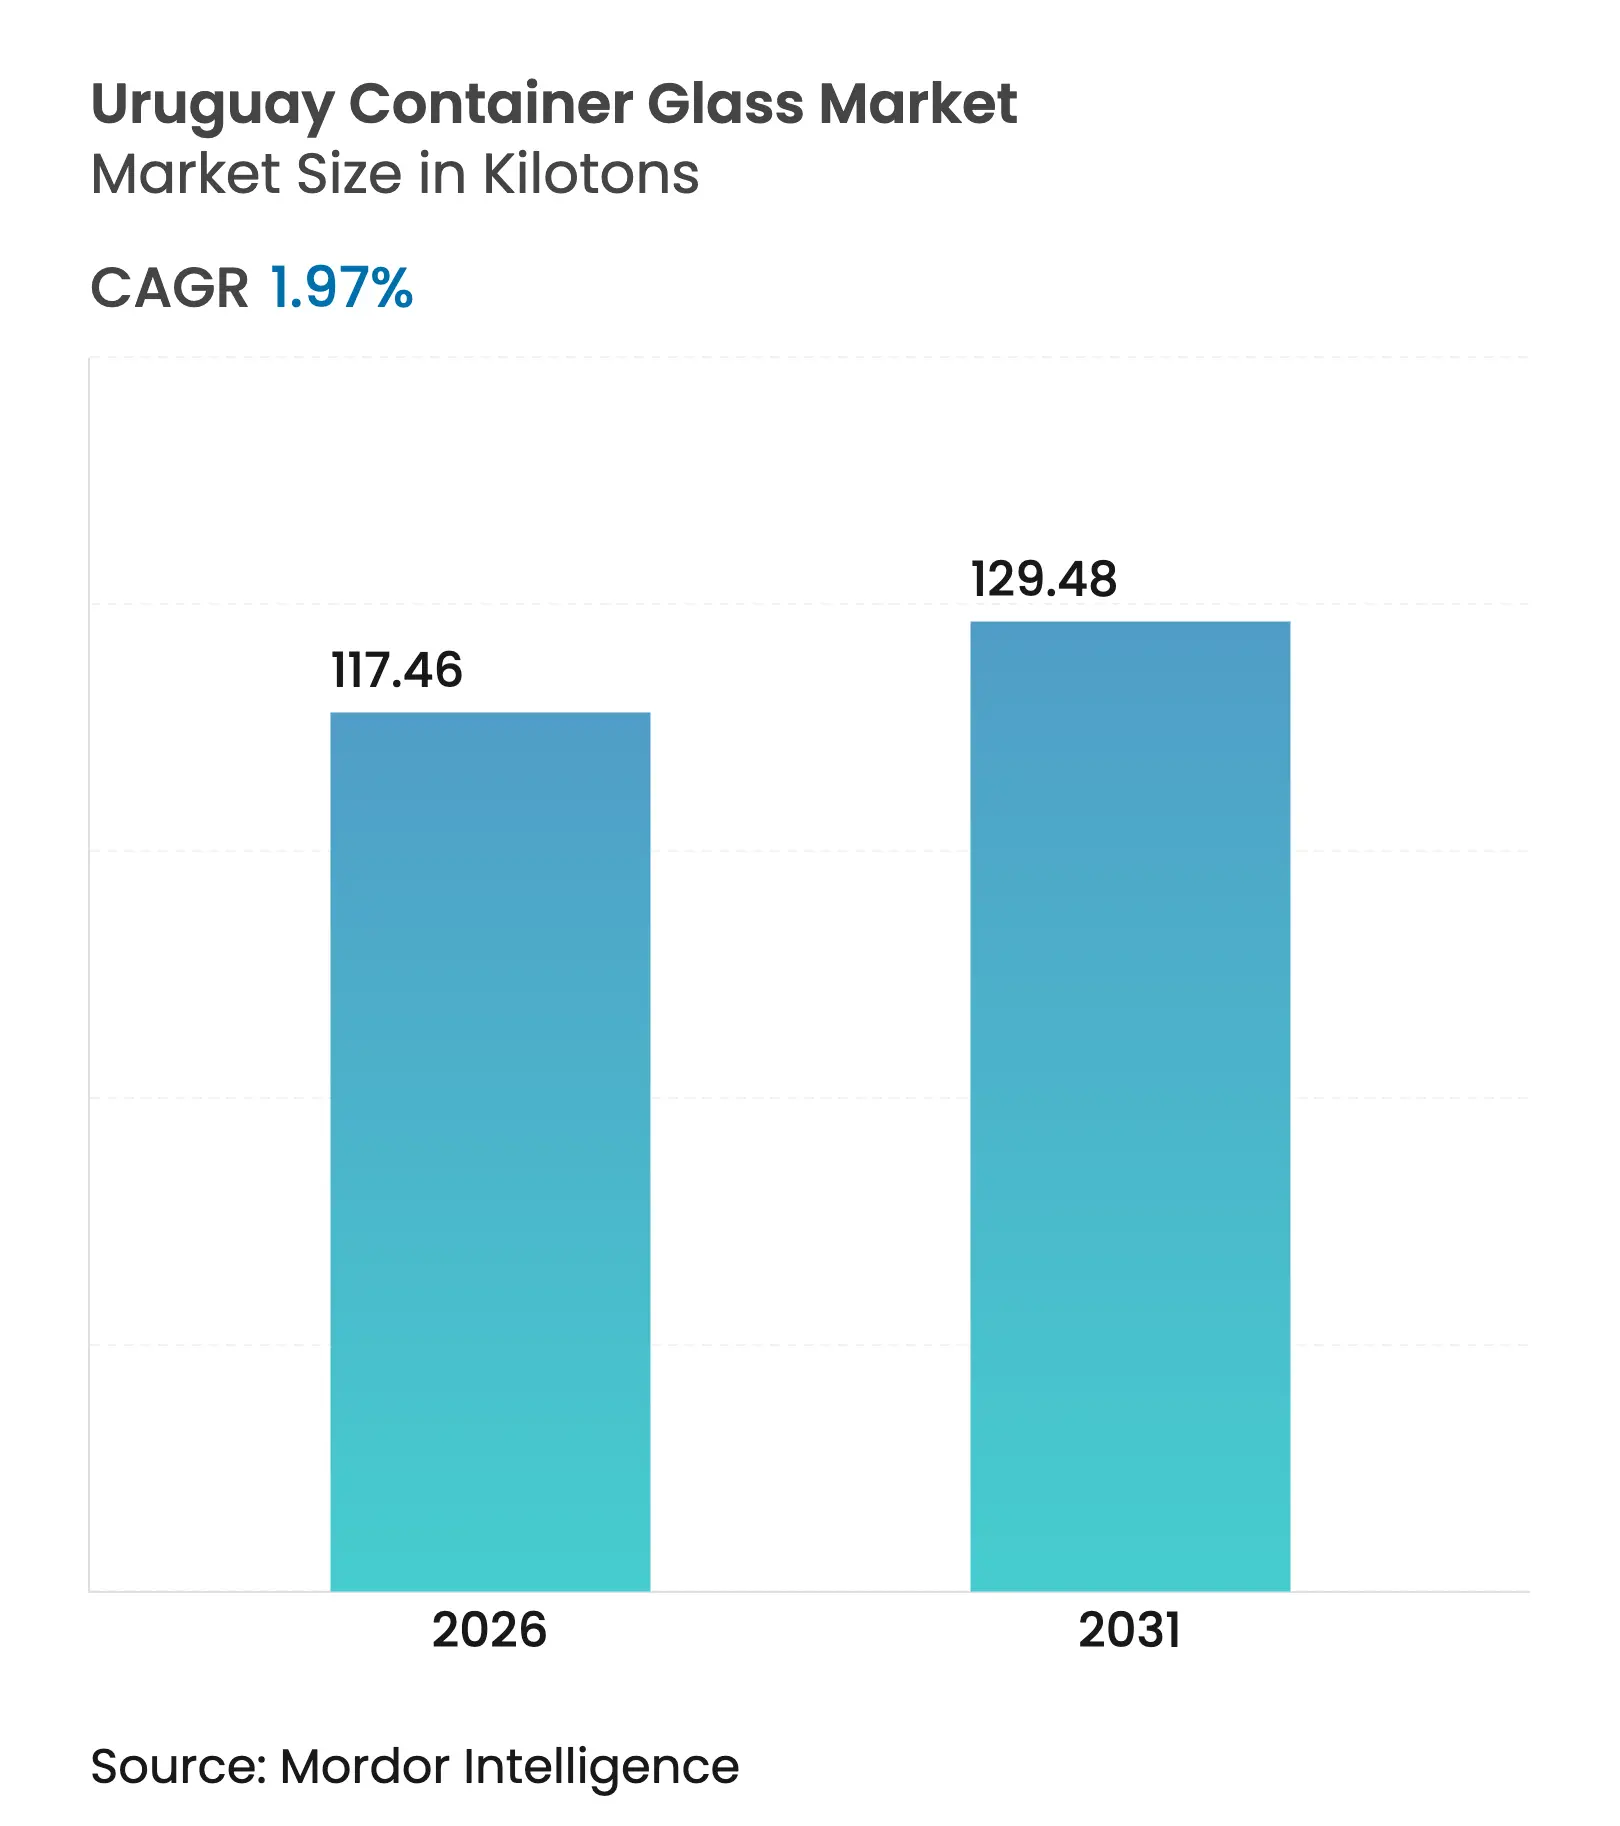
| Market Volume (2026) | 117.46 kilotons |
| Market Volume (2031) | 129.48 kilotons |
| CAGR | 1.97 % |
| Market Concentration | High |
Major Players *Disclaimer: Major Players sorted in no particular order. Image © Mordor Intelligence. Reuse requires attribution under CC BY 4.0. |
Uruguay Container Glass Market Analysis by Mordor Intelligence
The Uruguay container glass market size is expected to grow from 115.19 kilotons in 2025 to 117.46 kilotons in 2026 and is forecast to reach 129.48 kilotons by 2031 at 1.97% CAGR over 2026-2031. Healthy household spending, rising premium-segment exports, and Uruguay’s role as a Mercosur transit hub underpin demand, even as domestic manufacturing faces pressure from energy costs. Beverage brands emphasize glass for quality signaling, sustainability credentials, and compliance with the government’s 50% recycling goal set for 2027. Logistical upgrades at the Port of Montevideo and automatic tax incentives under Law 16,906 enhance cost efficiencies for export-oriented fillers, while limited cullet supply constrains faster growth.
Key Report Takeaways
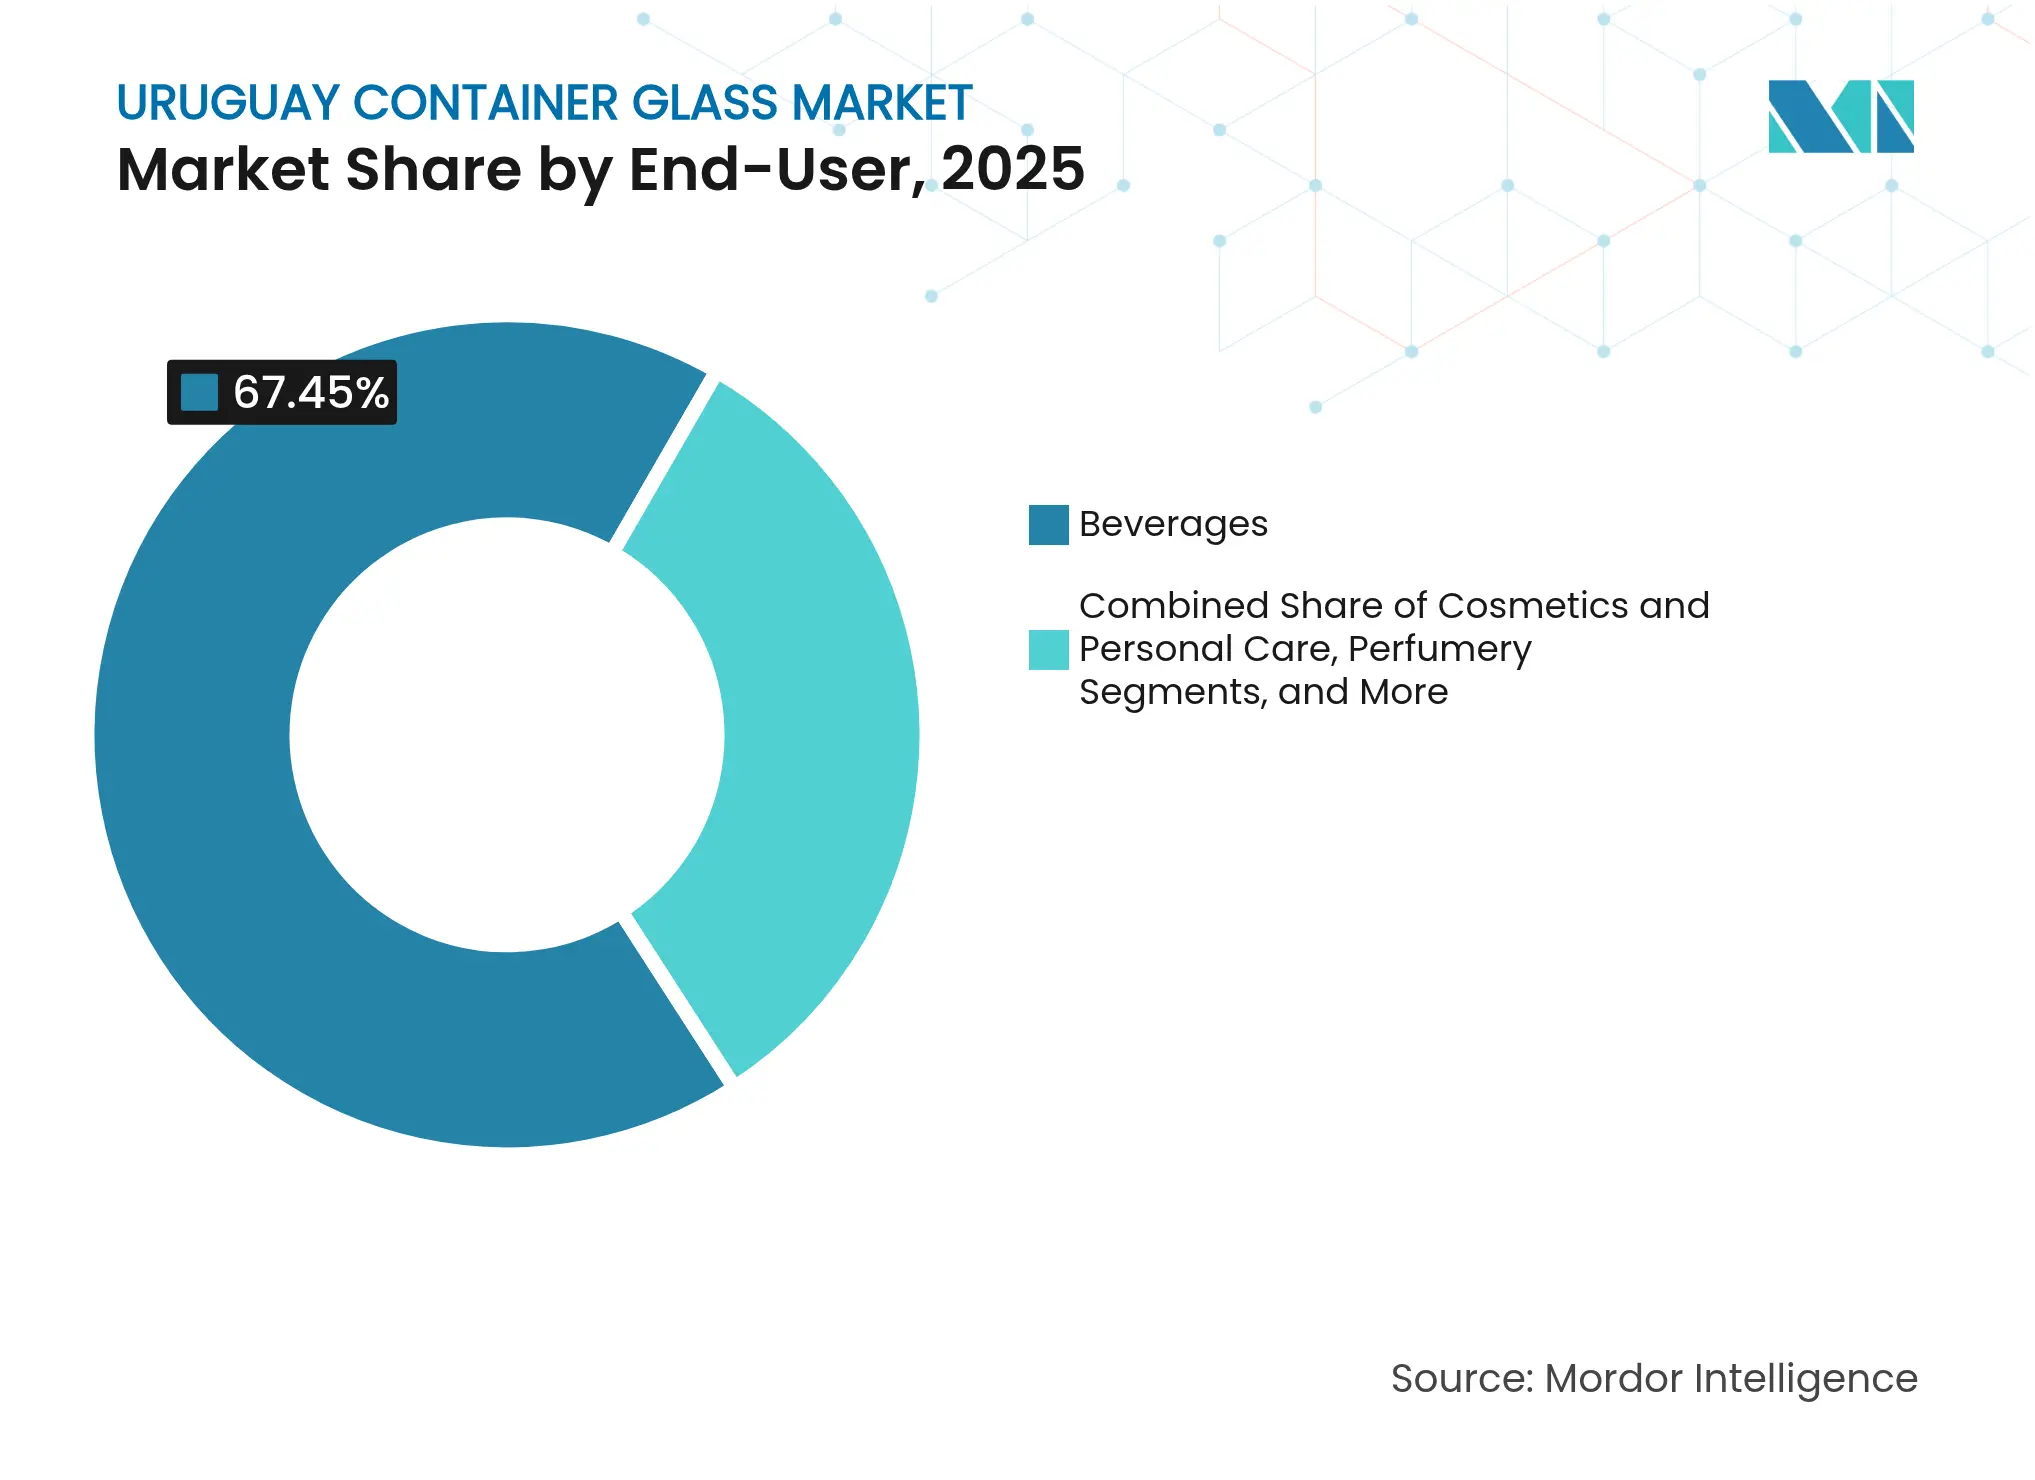
- By end-user, beverages captured 67.45% of the Uruguay container glass market share in 2025.
- By color, the Uruguay container glass market for amber glass is projected to grow at a 3.72% CAGR between 2026-2031.
Note: Market size and forecast figures in this report are generated using Mordor Intelligence's proprietary estimation framework, updated with the latest available data and insights as of 2026.
Uruguay Container Glass Market Trends and Insights
Drivers Impact Analysis
| Driver | (~) % Impact on CAGR Forecast | Geographic Relevance | Impact Timeline | |||
|---|---|---|---|---|---|---|
Government incentives for glass recycling targets Government incentives for glass recycling targets | +0.3% | National, with early gains in Montevideo | Medium term (2-4 years) | (~) % Impact on CAGR Forecast:+0.3% | Geographic Relevance:National, with early gains in Montevideo | Impact Timeline:Medium term (2-4 years) |
Premiumisation of alcoholic beverages Premiumisation of alcoholic beverages | +0.4% | Global export markets, concentrated in EU and Brazil | Long term (≥ 4 years) | |||
Shift from plastic to glass in craft beer and kombucha Shift from plastic to glass in craft beer and kombucha | +0.2% | National, with spillover to regional markets | Short term (≤ 2 years) | |||
Growing exports of Uruguayan wine to Brazil and EU Growing exports of Uruguayan wine to Brazil and EU | +0.5% | Brazil and EU markets, expanding to Asia | Long term (≥ 4 years) | |||
Adoption of lightweight flint bottles in pharma Adoption of lightweight flint bottles in pharma | +0.2% | National, with regional distribution | Medium term (2-4 years) | |||
High-end perfumery demand from duty-free channel High-end perfumery demand from duty-free channel | +0.1% | National airports and border crossings | Short term (≤ 2 years) | |||
| Source: Mordor Intelligence | ||||||
Government Incentives for Glass Recycling Targets
In 2025, the Ministry of Environment maintained its 50% packaging recovery mandate for 2027, accelerating investment in collection, color sorting, and cullet logistics. Beverage fillers incur compliance costs but gain cost relief from lower raw-material inputs and brand equity advantages in sustainability-sensitive export markets.
Premiumisation of Alcoholic Beverages
Fifty-two wineries exported USD 19 million worth of wine to 61 markets in 2024, leveraging geo-referenced terroir data and strict quality seals that require premium primary packs. Spirits and craft beers mirror the trend, opting for embossed, lightweight, or bespoke bottles that highlight provenance in EU and Brazilian shelves.
Shift from Plastic to Glass in Craft Beer and Kombucha
Still-beverage volumes at Coca-Cola FEMSA’s Montevideo plant increased by 34.5% in 2024 as craft kombucha and flavored soda brands transitioned to glass for flavor preservation and reuse systems.[1]Coca-Cola FEMSA, “20-F 2024,” coca-colafemsa.com Equipment makers such as Krones supplied modular fillers that accommodate short production runs and rapid color changeovers.
Growing Exports of Uruguayan Wine to Brazil and EU
Port upgrades, including the addition of a second 700-meter dock, increased Montevideo’s throughput and trimmed lead times to Brazilian and Iberian ports, boosting wine ship-outs in flint and green glass. Free-trade zones and automatic tax perks lower packaging costs, underpinning volume growth in premium channels.
Restraints Impact Analysis
| Restraint | (~) % Impact on CAGR Forecast | Geographic Relevance | Impact Timeline | |||
|---|---|---|---|---|---|---|
High energy tariffs for natural-gas-fired furnaces High energy tariffs for natural-gas-fired furnaces | -0.4% | National, affecting all glass production facilities | Short term (≤ 2 years) | (~) % Impact on CAGR Forecast:-0.4% | Geographic Relevance:National, affecting all glass production facilities | Impact Timeline:Short term (≤ 2 years) |
Limited domestic silica-sand reserves Limited domestic silica-sand reserves | -0.2% | National, with import dependency implications | Long term (≥ 4 years) | |||
Port congestion and high container freight costs Port congestion and high container freight costs | -0.2% | Port of Montevideo and regional shipping routes | Medium term (2-4 years) | |||
Competition from lightweight PET in CSD segment Competition from lightweight PET in CSD segment | -0.3% | National and regional carbonated soft drink markets | Medium term (2-4 years) | |||
| Source: Mordor Intelligence | ||||||
High Energy Tariffs for Natural-Gas-Fired Furnaces
Energy represented 23% of production cost for Verallia’s South American furnaces in 2024, and Uruguay’s tariff hikes following a 9.2% energy-sector contraction amplified cost headwinds for domestic glassmakers. Continuous-fire furnaces cannot shift load during peak hours, eroding margins versus Brazilian and Argentine imports.
Limited Domestic Silica-Sand Reserves
Absent high-grade deposits, producers import silica priced in USD, exposing them to currency swings and shipping delays that raise working-capital needs and risk furnace downtime. Limited domestic raw material availability also restricts opportunities for vertical integration strategies that could improve cost competitiveness and supply chain control, leaving local producers vulnerable to global commodity price volatility and geopolitical supply disruptions.
Segment Analysis
By End-User: Beverages Extend Leadership
The Uruguay container glass market size allocated to beverages totaled 77.7 kilotons in 2025, equivalent to 67.45% of overall demand. Wineries, craft brewers, and spirit distillers rely on heavy flint, green, and increasingly lightweight amber bottles to satisfy EU traceability regimes and Mercosur duty structures. Non-alcoholic fillers diversify into flavored waters and kombucha, yet bottled water in PET lost 20.9% volume, underscoring glass’s resilience in premium SKUs.
Cosmetics and personal care account for only 3.88 kilotons but will post the fastest CAGR at 3.26% through 2031 as duty-free shelves favor heavy-wall flacons and decorated jars. Pharmaceutical liquids maintain steady volume in Type III flint, helped by tamper-evidence rules and emerging e-pharmacy exports into Paraguay and Bolivia. Food processors exporting honey and gourmet sauces to North America and the EU also anchor demand, reinforcing the Uruguay container glass market’s export bias.
Note: Segment shares of all individual segments available upon report purchase
By Color: Flint Dominates, Amber Accelerates
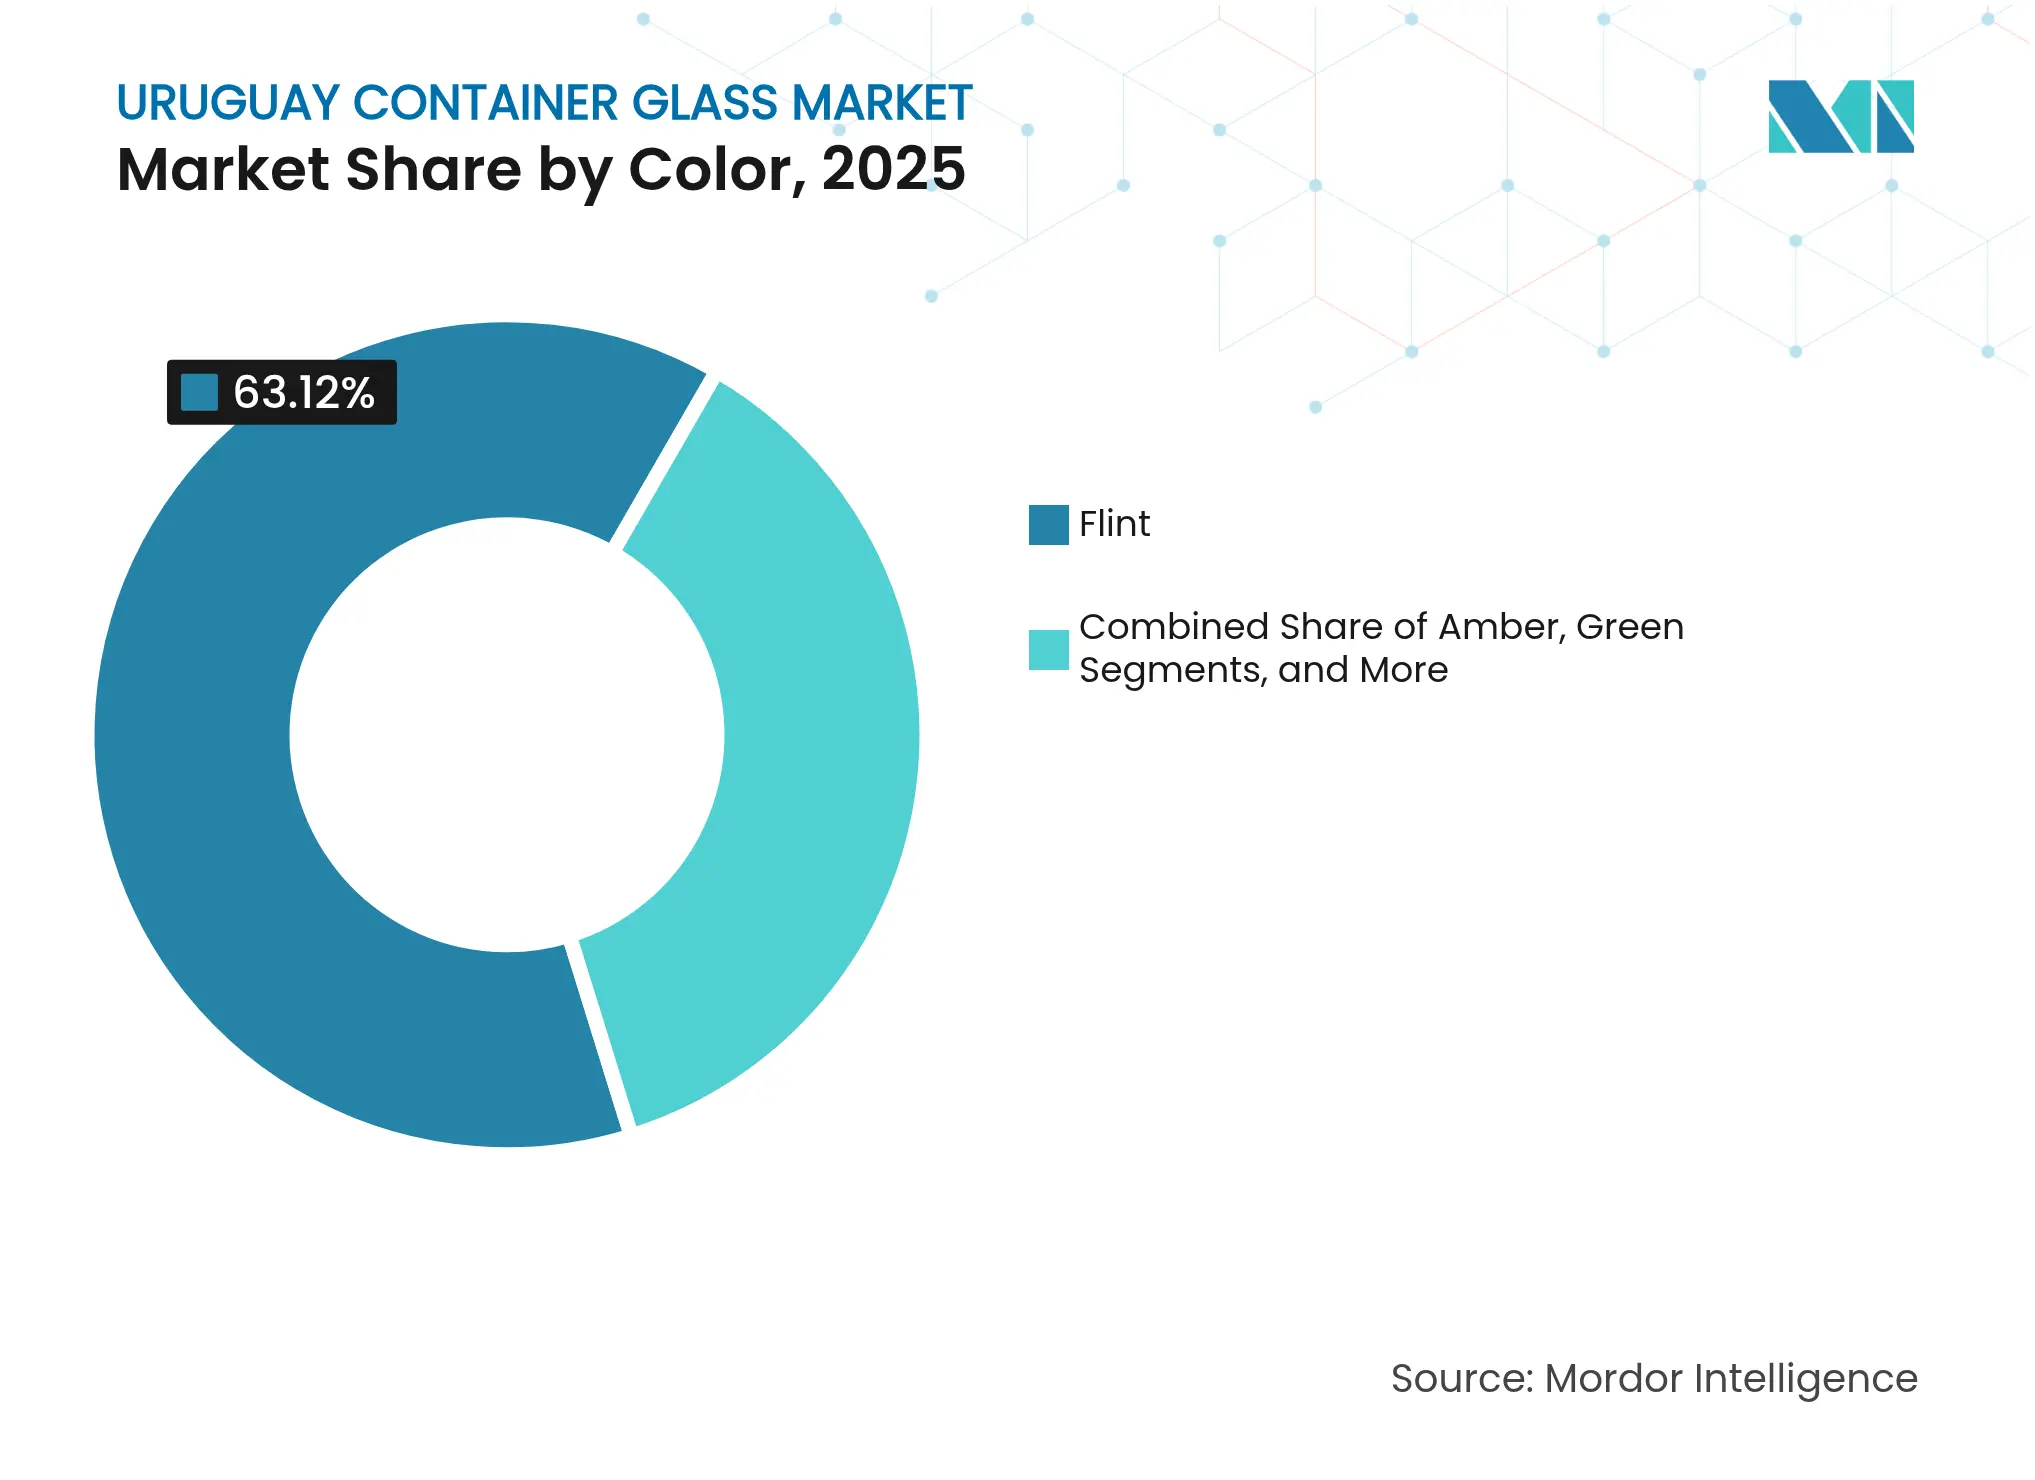
Flint captured 63.12% of Uruguay container glass market share in 2025, serving high-clarity requirements in pharma, cosmetics, and white spirits. Green glass retains relevance in traditional Tannat wine bottling for the EU, while niche cobalt and antique tints differentiate small-batch gins.
Amber is projected to rise at a 3.72% CAGR, adding close to 4.2 kilotons by 2031. Craft beer brands prefer amber for UV protection, and pharmaceuticals specify amber for light-sensitive formulations. Flexible furnace technology enabling mid-run color swaps improves economics for local converters, supporting faster amber uptake.
Note: Segment shares of all individual segments available upon report purchase
Geography Analysis
Exports anchor the Uruguay container glass market, with the Port of Montevideo handling 939,427 TEU in 2024 and slated to exceed 1.2 million TEU post-expansion logcluster. Montevideo-Canelones remains the core consumption zone, housing Coca-Cola FEMSA’s 135,912 thousand-unit-case plant and Envidrio’s legacy furnace complex.
Brazil absorbs the largest share of outbound glass-packed goods, benefitting from zero-tariff Mercosur trade. Argentina follows, despite localized recessionary swings, while EU volume gains from the pending Mercosur-EU agreement promise longer-term upside. China’s 17.4% export share in 2024 is small but rising for premium honey and wine, prompting bottle spec revisions to meet GB food-safety codes.
Interior wine regions such as Canelones and Colonia generate bulk bottle demand, while free-trade zones at Nueva Palmira facilitate duty-free consolidation of empty containers for fillers serving Paraguay and Bolivia. Transportation upgrades, including a 12.6-meter draft guarantee and 500 km of twin-lane highways, shorten door-to-door cycles, enhancing Uruguay container glass market competitiveness.

Competitive Landscape
Market Concentration
Uruguay’s container glass segment is moderately fragmented. Envidrio, Fábrica de Envases de Vidrio, and SIMSA share the domestic furnace base, but Owens-Illinois and Verallia supply via imports and specialty decoration hubs, lifting competitive pressure on price and lead time. High furnce utilization, around 88% in 2024, limits rapid capacity additions, propelling converters to invest in lightweighting and secondary-decoration value-adds.
Circular-economy moves are accelerating. Coca-Cola Latin America rolled out GS1 QR-code tracking for universal returnable bottles, a model slated to reach 40% adoption by 2030 and already piloted in Uruguay duty-free outlets. Local mold makers experiment with NNPB (narrow-neck press-and-blow) to reduce weight by 10% without compromising resistance, alleviating energy and silica burdens.
Strategic partnerships with logistics players such as Katoen Natie provide warehouse automation and cross-dock services that cut handling costs, key for high-mix premium exports. The post-pandemic shift toward near-shoring by Brazilian cosmetic groups offers new supply contracts for Uruguayan glassmakers able to guarantee ISO 9001 and ISO 14001 compliance.
Uruguay Container Glass Industry Leaders

*Disclaimer: Major Players sorted in no particular order
Recent Industry Developments
- March 2025: Katoen Natie completed phase-one port expansion, adding a 700-meter berth and automated stacking cranes to trim vessel dwell time.
- January 2025: Environment Ministry extended the 50% packaging-recovery deadline to Dec 2027, giving fillers two extra years for cullet infrastructure scaling .
- December 2024: Coca-Cola FEMSA posted a 1.9% volume dip to 50.7 million unit cases, with returnable share slipping to 18.5%
- October 2024: Government launched a USD 500 million sanitation push, indirectly boosting beverage demand through improved potable-water access.
Table of Contents for Uruguay Container Glass Industry Report
1. INTRODUCTION
- 1.1Study Assumptions and Market Definition
- 1.2Scope of the Study
2. RESEARCH METHODOLOGY
3. EXECUTIVE SUMMARY
4. MARKET LANDSCAPE
- 4.1Market Overview
- 4.2Market Drivers
- 4.2.1Government incentives for glass recycling targets
- 4.2.2Premiumisation of alcoholic beverages
- 4.2.3Shift from plastic to glass in craft beer and kombucha
- 4.2.4Growing exports of Uruguayan wine to Brazil and EU
- 4.2.5Adoption of lightweight flint bottles in pharma
- 4.2.6High-end perfumery demand from duty-free channel
- 4.3Market Restraints
- 4.3.1High energy tariffs for natural-gas-fired furnaces
- 4.3.2Limited domestic silica-sand reserves
- 4.3.3Port congestion and high container freight costs
- 4.3.4Competition from lightweight PET in CSD segment
- 4.4PESTEL Analysis
- 4.5Industry Supply-Chain Analysis
- 4.6Container Glass Furnace Capacity and Locations in Uruguay
- 4.6.1Plant Locations and Year of Commencement
- 4.6.2Production Capacities
- 4.6.3Types of Furnaces
- 4.6.4Color of Glass Produced
- 4.7Export-Import Data of Container Glass - Covering Key Import and Export Destinations
- 4.7.1Import Volume and Value, 2021-2024
- 4.7.2Export Volume and Value, 2021-2024
- 4.8Porter’s Five Forces Analysis
- 4.8.1Threat of New Entrants
- 4.8.2Bargaining Power of Suppliers
- 4.8.3Bargaining Power of Buyers
- 4.8.4Threat of Substitutes
- 4.8.5Competitive Rivalry
- 4.9Raw Material Analysis
- 4.10Recycling Trends for Glass Packaging
- 4.11Demand vs Supply Analysis for Glass Packaging
5. MARKET SIZE AND GROWTH FORECASTS (VOLUME)
- 5.1By End-user
- 5.1.1Beverages
- 5.1.1.1Alcoholic
- 5.1.1.1.1Beer
- 5.1.1.1.2Wine
- 5.1.1.1.3Spirits
- 5.1.1.1.4Other Alcoholic Beverages (Cider and Other Fermented Drinks)
- 5.1.1.2Non-Alcoholic
- 5.1.1.2.1Juices
- 5.1.1.2.2Carbonated Drinks (CSDs)
- 5.1.1.2.3Dairy Product Based Drinks
- 5.1.1.2.4Other Non-Alcoholic Beverages
- 5.1.2Food (Jam, Jelly, Marmalades, Honey, Sausages and Condiments, Oil, Pickles)
- 5.1.3Cosmetics and Personal Care
- 5.1.4Pharmaceuticals (excluding Vials and Ampoules)
- 5.1.5Perfumery
- 5.2By Color
- 5.2.1Green
- 5.2.2Amber
- 5.2.3Flint
- 5.2.4Other Colors
6. COMPETITIVE LANDSCAPE
- 6.1Market Concentration
- 6.2Strategic Moves and Developments
- 6.3Company Market Share Analysis, (Based on Latest Production Capacity)
- 6.4Company Profiles (includes Global level Overview, Market level overview, Core Segments, Financials as available, Strategic Information, Market Rank/Share for key companies, Products and Services, and Recent Developments)
- 6.4.1Feemio Group Co. Ltd
- 6.4.2Acril Ltda.
- 6.4.3Uruglass Ltda.
- 6.4.4Cattorini Hnos. S.A.
- 6.4.5Vitro Packaging
- 6.4.6Ecovidrio Uruguay
- 6.4.7CCU Inversiones II Ltda.
- 6.4.8Fabrica de Envases de Vidrio SA
7. MARKET OPPORTUNITIES AND FUTURE OUTLOOK
- 7.1White-space and Unmet-Need Assessment
Uruguay Container Glass Market Report Scope
Container glass is used in the alcoholic and non-alcoholic beverage industries due to its ability to maintain chemical inertness, sterility, and non-permeability. Glass packaging is valued for its unique properties, including its transparency, inertness, and ability to preserve the quality and integrity of its contents. It is often chosen for products where purity, safety, and environmental sustainability are paramount concerns.
Uruguay container glass market is segmented by end-user vertical (beverages [alcoholic beverages (beer, wine, spirits, and other alcoholic beverages {cider and other fermented drinks}), non-alcoholic beverages (juices, carbonated drinks (CSDs), dairy product-based drinks, other non-alcoholic beverages)], food [jam, jelly, marmalades, honey, sausages and condiments, oil, pickles], cosmetics and personal care, pharmaceuticals (excluding vials and ampoules), and perfumery), by color (green, amber, flint and other colors). The report offers market forecasts and size in volume (kilotons) for all the above segments.