Market Overview
| Study Period | 2020 - 2031 |
|---|---|
| Forecast Data Period | 2026 - 2031 |
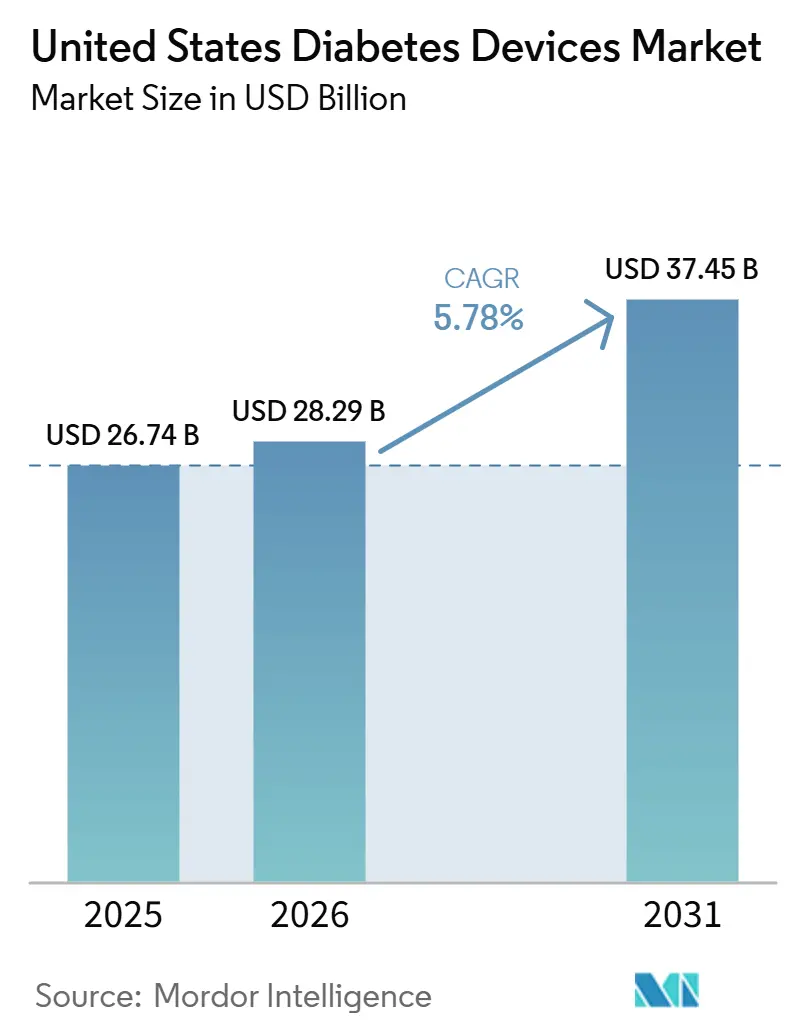
| Base Year Market Size (2025) | USD 26.74 Billion |
| Market Size (2026) | USD 28.29 Billion |
| Market Size (2031) | USD 37.45 Billion |
| Growth Rate (2026 - 2031) | 5.78% CAGR |
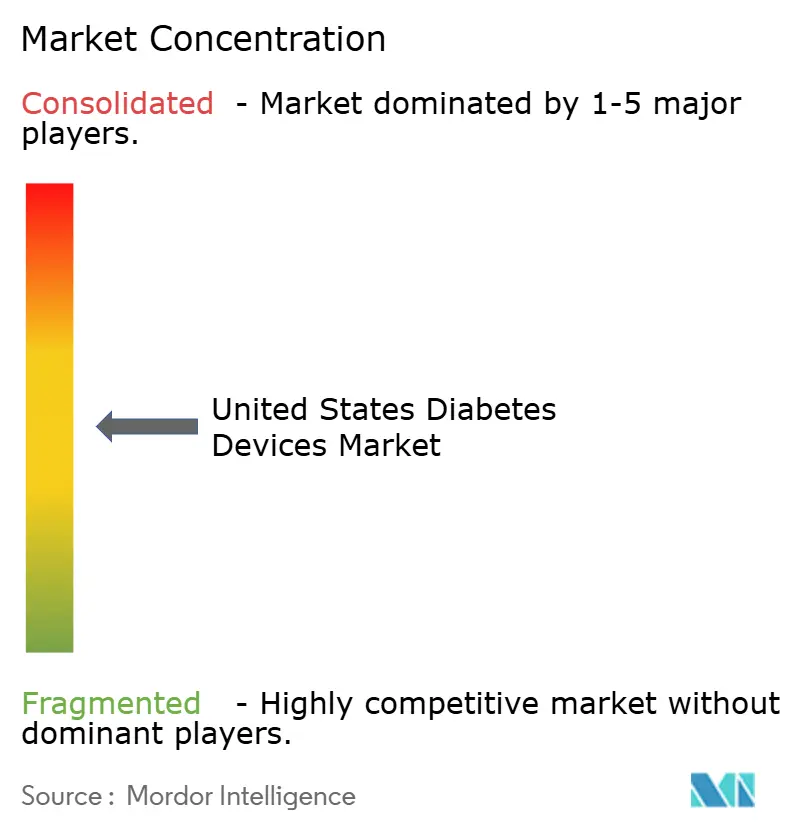
| Market Concentration | Medium |
Major Players *Disclaimer: Major Players sorted in no particular order Image © Mordor Intelligence. Reuse requires attribution under CC BY 4.0. | |
United States Diabetes Devices Market Analysis by Mordor Intelligence
The United States Diabetes Devices Market size is projected to expand from USD 26.74 billion in 2025 and USD 28.29 billion in 2026 to USD 37.45 billion by 2031, registering a CAGR of 5.78% between 2026 to 2031.
This trajectory unfolds against an epidemiological backdrop of 38.4 million Americans living with diabetes, a figure that continues to propel demand for both monitoring and management solutions. The economic burden of USD 413 billion in 2022 further exposes the cost of inadequate control and places medical technology at the center of policy discussions [1]American Diabetes Association Staff, “Statistics About Diabetes,” American Diabetes Association, diabetes.org. One direct consequence is the rising penetration of connected devices, which now underpin remote-first care models across much of the US healthcare system. The sizeable chronic population ensures long product lifecycles, giving manufacturers scope to recoup hefty research outlays while still holding prices within reimbursement ceilings. Because of this combination of persistent clinical need and policy support, the US Diabetes Devices industry has become a crucial bellwether for global product launches, as firms increasingly prioritize stateside clearance before moving into other regions.
Over the next five years, payer rules are set to shape the competitive field almost as strongly as novel engineering. Medicare’s expansion of continuous glucose monitoring (CGM) coverage to all insulin-using beneficiaries has already broadened the eligible pool by several million patients. That decision has also triggered parallel moves among commercial insurers that fear adverse selection if they lag behind federal policy. As the payer landscape liberalizes, suppliers are re-designing workflows to favor pharmacy and direct-to-consumer dispensing, which shorten refill cycles and reduce total cost to serve. An observable result is the convergence of monitoring and dosing hardware inside app-based ecosystems, making software upgrades as strategically important as sensor chemistry. The stronger pull-through of consumables implied by a 6.27 % CAGR therefore hints at widening gross margins, even if average selling prices of base hardware continue their gradual decline.
Key Report Takeaways
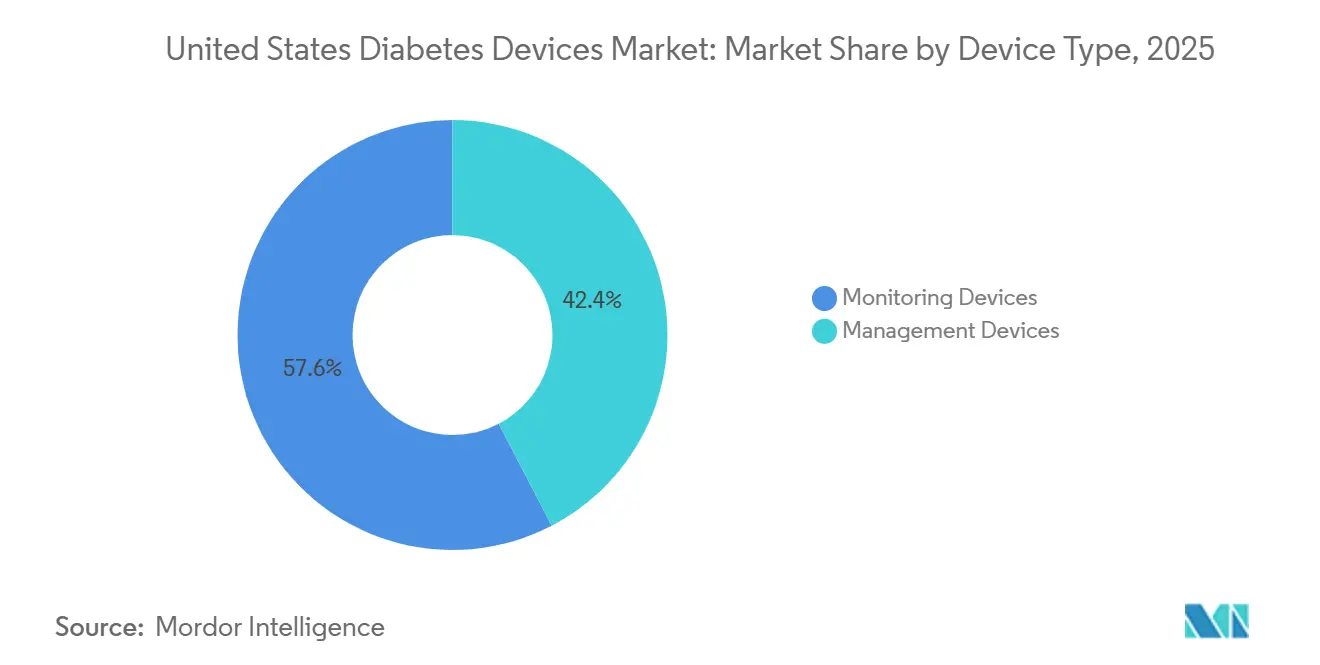
- By device type, monitoring devices captured 57.64% of the United States diabetes devices market share in 2025; continuous glucose monitoring systems are projected to grow at a 7.41% CAGR through 2031.
- By patient type, type 2 diabetes users accounted for 92.05% of total device volume in 2025, and type 1 patients accounted for 7.95% CAGR through 2031.
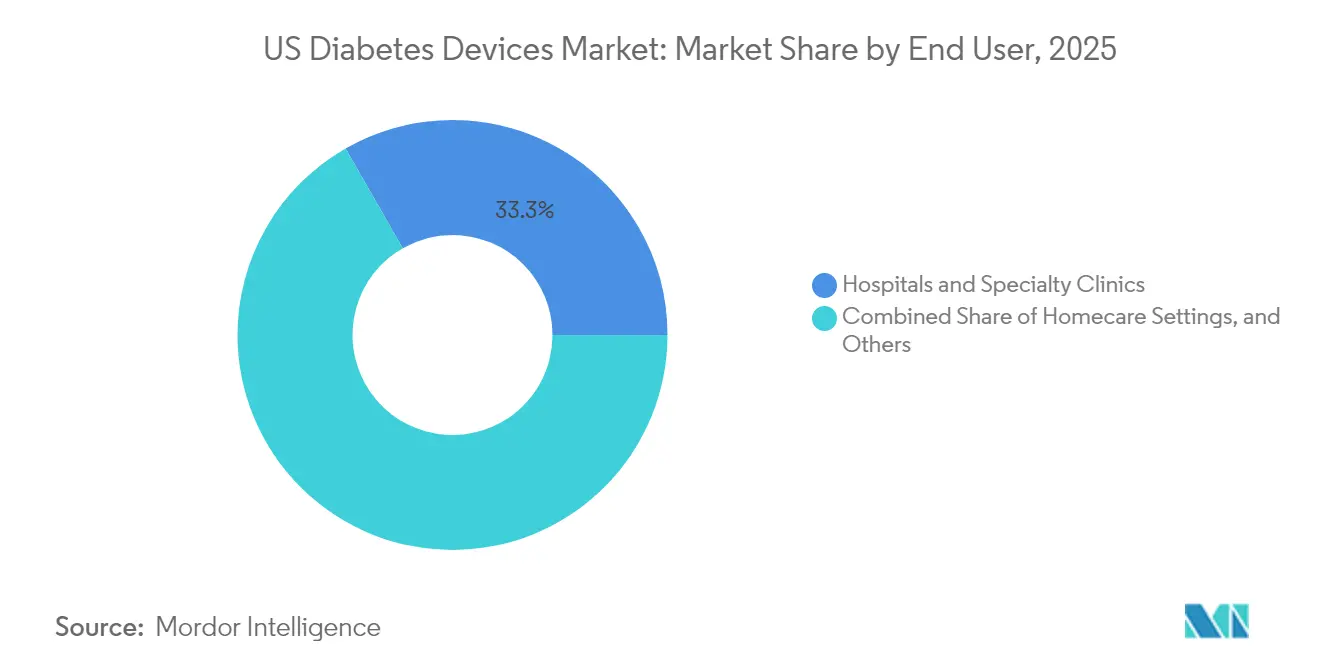
- By end user, home care settings dominated with 66.72% market share in 2025; hospital and specialty clinic deployments are expected to grow at a 6.95% CAGR through 2031.
- By distribution channel, retail pharmacies held 60.52% share in 2025, while e-commerce sales are forecast to expand at a 7.38% CAGR through 2031.
Note: Market size and forecast figures in this report are generated using Mordor Intelligence’s proprietary estimation framework, updated with the latest available data and insights as of 2026.
United States Diabetes Devices Market Trends and Insights
Drivers Impact Analysis*
| Driver | (~) % Impact on CAGR | Geographic Relevance | Impact Timeline |
|---|---|---|---|
| Surge in Adoption of Real-Time CGM | +23.9 % | National, stronger in Northeast & Midwest | Short term (≤ 2 years) |
| Rising Prevalence of Youth Obesity | +12.8 % | National, higher in South & Midwest | Long term (≥ 4 years) |
| Smartphone Ecosystem Integration | +19.1 % | Urban centers nationwide | Medium term (2–4 years) |
| Growing Insulin Delivery Device Usage | +15.9 % | National | Medium term (2–4 years) |
| Shift Toward Value-Based Care | +11.2 % | Early adoption in Northeast | Medium term (2–4 years) |
| Increasing Prevalence of Diabetes | +20.7 % | National | Long term (≥ 4 years) |
| Source: Mordor Intelligence | |||
Surge in Adoption of Real-Time CGM Driven by Medicare Reimbursement Expansion
Medicare’s April 2023 policy update extended CGM eligibility to all insulin users and individuals with problematic hypoglycemia, removing a critical access barrier [2]Sean M. Oser, “Medicare Coverage of Continuous Glucose Monitoring — 2023 Updates,” Family Practice Management, aafp.org. Prescription abandonment rates fell sharply as finger-stick documentation disappeared from coverage requirements. Providers now use automated alerts to intercept glucose excursions, replacing many routine phone calls with data-driven interventions. This operational relief enables clinics to enroll more patients without expanding staffing, a clear productivity dividend.
Rising Prevalence of Obesity Among Youth Increasing Earlier Onset Diabetes
The sharp climb in childhood obesity is translating into more type 2 diagnoses during adolescence, expanding lifetime exposure to device therapy. Manufacturers are releasing youth-oriented form factors, such as smaller on-body transmitters and colorful user interfaces, which help mitigate device stigma in school settings. Because these users may require technology for several decades, product loyalty established in teenage years could create unusually sticky revenue streams. This demographic shift also suggests that long-horizon actuarial models may underestimate the eventual installed base of advanced pumps and sensors.
Integration of Diabetes Devices with Smartphone Ecosystem Boosting Patient Engagement
Hard-wired Bluetooth links between CGMs, smartwatches, and activity trackers are turning previously episodic checks into a continuous feedback loop. Clinical studies indicate that when glucose readings appear beside sleep or exercise metrics, patients are more likely to adjust behavior within the same day [3]Rajesh Kumar, “Effectiveness of a New Smartphone Application on Type 1 Diabetes Control and Self-Management in Times of Covid-19: Randomized Controlled Trial,” International Journal of Environmental Research and Public Health, ncbi.nlm.nih.gov. The generative AI layer introduced by one leading CGM company in late 2024 now parses longitudinal patterns and suggests micro-adjustments, effectively personalizing coaching at population scale. Such real-time nudges are reducing provider workload while driving higher sensor renewal rates, implying a virtuous cycle for both adherence and revenue.
Growing Usage of Insulin Delivery Devices
Automated insulin dosing systems cleared for adult type 2 patients in 2024 opened a previously untouched segment that represents the bulk of nationwide diabetes prevalence. Patch pumps with 300-unit reservoirs now cater to insulin-resistant profiles without frequent cartridge swaps, addressing an inconvenience that had stalled adoption among this group. The result is a gradual migration away from multiple daily injections toward hybrid closed-loop solutions, especially in primary-care-led programs. Early commercial feedback suggests that once wear-time surpasses three months, churn falls sharply, hinting at durable uptake when initial training hurdles are met.
Restraints Impact Analysis*
| Restraint | (~) % Impact on CAGR | Geographic Relevance | Impact Timeline |
|---|---|---|---|
| High Associated Costs | −15.9 % | Rural & low-income urban areas | Short term (≤ 2 years) |
| Insurance Coverage Limitations | −11.2 % | South & rural regions | Medium term (2–4 years) |
| Sustainability Pressure on Single-Use Pens | −4.8 % | Coastal states with green mandates | Long term (≥ 4 years) |
| Stringent Regulatory Requirements | −8.0 % | National | Medium term (2–4 years) |
| Source: Mordor Intelligence | |||
High Associated Costs
Cost remains the single biggest brake on technology penetration. A 2024 claims analysis reported that patients filling CGM prescriptions at retail pharmacies incurred 53 % higher annual medical costs than those using durable medical equipment channels [4]Jason C. Allaire, “Exploring the Impact of Device Sourcing on Real-World Adherence and Cost Implications of Continuous Glucose Monitoring in Patients With Diabetes: Retrospective Claims Analysis,” JMIR Diabetes, diabetes.jmir.org. Even with supplemental coverage, the typical 20 % Medicare co-insurance can deter budget-constrained seniors. Price sensitivity thus skews adoption toward higher-income users, widening glycemic control disparities.
Insurance Coverage Limitations
Commercial payers continue to apply prior-authorization hurdles that differ materially from federal rules, confusing prescribers and slowing onboarding. Formularies can change with little notice, as illustrated by the removal of a disposable infusion device from one major pharmacy benefit manager in favor of a rival patch system. These gyrations force clinicians to master multiple ordering portals and occasionally swap patients to an alternative brand mid-therapy, introducing adherence risk. The administrative burden also discourages small practices from initiating technology discussions, indirectly capping uptake outside major endocrinology centers.
*Our forecasts treat driver/restraint impacts as directional, not additive. The impact forecasts reflect baseline growth, mix effects, and variable interactions.
Segment Analysis
By Device Type: Monitoring Devices Lead Technological Revolution
Monitoring devices account for 57.64% US Diabetes Devices market share in 2025, creating the single largest revenue block within the product taxonomy. Continuous glucose monitoring systems exhibit a forecast 7.41% CAGR from 2026 to 2031, markedly faster than the sector average, and this spread implies progressive mix shift toward higher-margin disposables. Many suppliers now bundle starter kits with smartphone apps that auto-generate time-in-range charts, reducing the need for manual logbooks and boosting perceived value. Because CGM data provide actionable insights every five minutes, clinicians are increasingly comfortable titrating therapy based on trends rather than isolated finger-stick values, reinforcing device indispensability. A notable spillover is the shrinking SMBG strip market, as patients who transition seldom revert, which accelerates revenue cannibalization for firms still heavily exposed to legacy meters.
The FDA’s 2024 clearance of an over-the-counter biosensor specifically aimed at non-insulin users effectively widened the addressable pool by tens of millions of adults, even if near-term monetization relies on cash-pay purchases. Early commercial pilots reveal that retail pharmacy staff can complete onboarding in under 10 minutes, hinting at a scalable point-of-sale model that differs markedly from prescription-based workflows. The move has also introduced consumer electronics players into the conversation, as glucose trend lines fit naturally within broader wellness dashboards. From a competitive standpoint, monitoring giants face the strategic dilemma of balancing medical claims with lifestyle branding, because over-medicalizing messaging may dampen mass-market appeal.


By Patient Type: Type-2 Diabetes Dominates Market Volume
Type 2 patients account for 92.05% of US Diabetes Devices market size in 2025, and their sheer numbers ensure they drive absolute unit growth even if per-capita spend lags type 1 cohorts. The 2024 regulatory nod for an automated insulin dosing algorithm tailored to adults with type 2 diabetes signals a turning point in technology parity between patient groups. As payers study early real-world data showing fewer emergency visits, coverage policies are expected to broaden, further eroding historical access gaps. Because type 2 onset often occurs later in life, device design priorities include simplified interfaces and low maintenance, factors that favor patch-style pumps over tubed systems.
Type 1 patients, representing 7.95% of volume, sustain a higher 6.61% forecast CAGR because they adopt multiple device classes in tandem and replace hardware more rapidly as firmware advances. Nearly eight out of ten people with type 1 diabetes already combine CGM with pump therapy, creating an environment where incremental software innovation can unlock measurable clinical gains. This cohort also generates dense data sets that attract academic scrutiny, making them prime candidates for first-in-human studies of algorithmic dosing. The knowledge spillovers from type 1 trials often inform later-stage protocols for type 2 users, effectively positioning this smaller segment as a proving ground for next-generation products.
End User: Homecare Settings Driving Device Innovation
Home environments captured 66.72% of US Diabetes Devices market share in 2025, mirroring a cultural move toward self-management supported by telehealth. The FDA’s “Health Care at Home” initiative formally recognized residential spaces as legitimate sites of care, which accelerated remote onboarding programs run by device manufacturers. Because home-based users interact with devices dozens of times per day, user-experience refinements can sway purchasing decisions more than technical specifications. Manufacturers now invest in consumer-style packaging and intuitive mobile tutorials, a strategy that not only reduces help-desk costs but also deepens brand affinity.
Hospitals and specialty clinics hold a smaller slice but are expanding at a 6.95 CAGR, fueled by tighter integration of CGM feeds into electronic health records. Inpatient teams can now access trend data within the same dashboard that tracks renal panels, enabling real-time dosing tweaks during acute admissions. This interoperability reduces bed-days and opens new billing codes for professional CGM interpretation, encouraging administrators to stock sensors on general wards. Over time, inpatient exposure drives outpatient adoption, because patients discharged with a device are statistically more likely to refill sensors through their primary-care physician.
Distribution Channel: E-commerce Disrupting Traditional Models
Retail pharmacies maintain 60.52% of the distribution channel, underpinned by insurance plan rules that steer durable equipment through local outlets. Yet e-commerce, projected to advance at 7.38% CAGR, is quietly redrawing customer expectations around convenience and price transparency. Subscription models that ship sensors automatically ahead of depletion minimize coverage lapses and improve adherence metrics valued by payers. By comparing refill cadence across channels, suppliers observe that door-to-door delivery often correlates with steadier usage, likely because stockouts are less frequent.
Hospital pharmacies mostly serve peri-discharge needs but provide a crucial touchpoint for complex regimens that require nurse training before home use. Claims analysis has shown higher six-month adherence among patients whose first box originates from a durable medical equipment supplier rather than a retail counter. The inference is that structured coaching at pickup influences long-term behavior, suggesting manufacturers might boost retention by embedding certified educators into fulfillment workflows. As payer scorecards increasingly reward sustained utilization, channel selection could evolve into a clinical as well as logistical decision.
Geography Analysis
The Northeast commands an outsized share of advanced technology sales, buoyed by superior insurance coverage and a high density of endocrinology fellows. Integrated delivery networks here pursue aggressive value-based contracts, making them early adopters of remote monitoring kits that promise fewer readmissions. Because academic centers frequently act as pivotal trial sites, new products often receive their first real-world validation in this region, accelerating local diffusion. Higher median incomes also mean co-insurance rarely stalls uptake, translating into robust US Diabetes Devices market penetration among both type 1 and intensively treated type 2 populations. An observable dividend is that regional payers gather extensive sensor data, enabling granular actuarial modeling that guides future benefit design.
The Midwest mirrors Northeastern technology enthusiasm in its urban corridors but contends with broader rural catchment areas that stretch provider capacity. Federally funded telehealth infrastructure grants have helped bridge some gaps by enabling virtual pump training across state lines. Because agricultural work patterns stress on-body devices differently, suppliers have begun testing ruggedized enclosures that withstand mechanical vibration and cold exposure, feeding innovation back into national product lines. The mix of advanced therapy in cities and basic meters in rural towns suggests unit growth can remain strong even without uniform tech saturation, as each sub-region climbs its own adoption curve. This diversity also inoculates manufacturers against localized reimbursement shocks.
The South bears the nation’s highest diabetes prevalence yet lags in penetration of premium devices, in part due to lower private-insurance rates. Public health departments respond by partnering with community clinics to distribute starter CGM kits, betting that engagement will prompt uptake of lifestyle programs that slow disease progression. Early evidence indicates that once baseline familiarity is achieved, demand for follow-on sensors rises, hinting at latent willingness constrained largely by affordability. Device firms are therefore piloting tiered pricing and subsidy models, which could unlock volume and simultaneously test scalable approaches for other low-income markets. These experiments inform national strategies for balancing revenue optimization with access imperatives.
Competitive Landscape
The US Diabetes Devices industry remains concentrated, with the top five manufacturers controlling roughly 70% of revenue. Competitive moats are increasingly defined by cloud platforms that integrate monitoring, dosing, and analytics rather than by hardware alone. A high-profile partnership announced in August 2024 between two market leaders binds a popular flash glucose sensor to an established pump portfolio, signaling that firms view ecosystem breadth as decisive. Such alliances also streamline regulatory submissions by sharing interoperability evidence, shortening time to market for combined offerings. From the payer perspective, integrated solutions promise tighter glycemic control, incentivizing formulary committees to favor suites over standalone components.
Smaller players still find openings by targeting niche segments or offering white-label software overlays compatible with multiple sensors. For example, one start-up’s food-logging algorithm leverages camera recognition to suggest insulin micro-boluses, effectively bolting cognitive assistance onto any Bluetooth-enabled pen. If such modular innovation continues, incumbents may need to open their application programming interfaces wider, lest they cede user-interface primacy to software-only entrants. The tension between closed and open ecosystems therefore shapes both acquisition pipelines and venture funding flows. Because interoperability also aligns with emerging federal guidance on medical device data, firms that embrace open standards could see smoother regulatory pathways.
United States Diabetes Devices Industry Leaders
Abbott
Dexcom
Becton Dickinson
Medtronic
F. Hoffmann-La Roche AG
- *Disclaimer: Major Players sorted in no particular order

Recent Industry Developments
- February 2026: Portal Diabetes, Inc. received FDA Breakthrough Device Designation for its implantable insulin pump system, the Portal Pump, and initiated a Phase 1 study of its proprietary temperature-stable insulin. This marks a major step toward a functional cure for type 1 diabetes by combining implantable delivery, CGM integration, and stable insulin formulations.
- November 2025: Dexcom announced the launch of the Dexcom G7 15 Day Continuous Glucose Monitoring System in the U.S. on Dec. 1, 2025. The device offers real-time glucose readings for up to 15.5 days, initially available through durable medical equipment providers, with a broader retail rollout planned. Dexcom continues to hold strong reimbursement coverage leadership in the CGM market.
- July 2025: Mattel introduced the first Barbie doll with type 1 diabetes, expanding representation in children’s toys. This move promotes inclusion and empathy, reflecting broader societal awareness and normalization of diabetes management tools and experiences.


Research Methodology Framework and Report Scope
Market Definitions and Key Coverage
Our study defines the United States diabetes devices market as all FDA-cleared or FDA-approved equipment that either monitors blood glucose (glucometers, test strips, lancets, continuous glucose monitoring sensors, transmitters, readers) or delivers insulin (pumps, pens, syringes, jet injectors). Values are captured at the manufacturer selling price and expressed in U.S. dollars.
Scope Exclusions: Wearable wellness trackers that provide only 'trend' glucose readings, do-it-yourself closed-loop software, and unregulated online kits are not counted.
Segmentation Overview
- By Device Type
- Monitoring Devices
- Self-Monitoring Blood Glucose (SMBG)
- Glucometers
- Test Strips
- Lancets
- Continuous Glucose Monitoring (CGM)
- Sensors
- Durables (Transmitters & Readers)
- Self-Monitoring Blood Glucose (SMBG)
- Management Devices
- Insulin Pumps
- Pump Device
- Reservoir
- Infusion Set
- Insulin Pens
- Disposable Pens
- Cartridges for Re-usable Pens
- Insulin Syringes
- Jet Injectors
- Insulin Pumps
- Monitoring Devices
- By Patient Type
- Type-1 Diabetes
- Type-2 Diabetes
- By End User
- Homecare Settings
- Hospitals & Specialty Clinics
- Others
- By Distribution Channel
- Hospital Pharmacies
- Retail Pharmacies
- E-commerce
- By US Region
- Northeast
- Midwest
- South
- West
Detailed Research Methodology and Data Validation
Primary Research
Mordor analysts interviewed endocrinologists, diabetes educators, procurement heads at hospital chains, and senior managers at national pharmacy groups across all four U.S. census regions. These discussions validated device utilization rates, average selling prices, CGM penetration, and patient-segment mix, while also clarifying reimbursement inflection points noted in secondary findings.
Desk Research
We relied on tier-1, freely accessible sources such as the CDC National Diabetes Statistics System, FDA 510(k) and PMA device archives, Centers for Medicare & Medicaid Services Part B utilization tables, U.S. International Trade Commission HS-code import data, and American Diabetes Association clinical journals to frame market volume and policy shifts. Company 10-Ks, investor decks, major hospital group purchasing agreements, and news feeds from Dow Jones Factiva enriched pricing and adoption insights.
Supplemental detail on channel inventories and corporate revenues was pulled from D&B Hoovers and, where relevant, Marklines for pump component supply. The sources listed illustrate our approach; many additional publications were reviewed to cross-check figures and interpretation.
Market-Sizing & Forecasting
We start with a top-down reconstruction that links CDC prevalence counts to device penetration by cohort and then multiplies by validated ASPs from primary calls. Select bottom-up roll-ups of leading supplier shipments and e-commerce channel checks are overlaid to fine-tune totals. Key variables in our model include diagnosed diabetes prevalence, share of patients on multiple-daily-injection therapy, CGM adoption curve, average pump replacement cycle, Medicare reimbursement rates, and price erosion observed in bulk strip contracts.
A multivariate regression, stress-tested through scenario analysis, projects each variable through 2030; gaps in bottom-up inputs are filled using historical moving averages adjusted for policy and technology shocks.
Data Validation & Update Cycle
Outputs undergo three-step analyst review, variance checks against external benchmarks, and automated anomaly flags. The model is refreshed annually; interim updates are triggered when the FDA clears a major device class, CMS alters reimbursement, or a large recall disrupts supply. Before release, an analyst reruns the latest data pulls so clients receive the most current view.
Why Our United States Diabetes Devices Baseline Commands Reliability
Published U.S. market values often differ because firms pick unlike device baskets, mix retail and wholesale prices, or update at uneven intervals.
Key gap drivers include narrower device lists (some studies omit jet injectors), aggressive CAGR stacking without price erosion, or single-year prevalence snapshots that ignore rising CGM uptake. Mordor's broader scope, ASP normalization to manufacturer level, and yearly refresh reduce these distortions.
Benchmark comparison
| Market Size | Anonymized source | Primary gap driver |
|---|---|---|
| USD 26.74 B (2025) | Mordor Intelligence | - |
| USD 19.30 B (2024) | Global Consultancy A | Excludes jet injectors and uses retail prices without channel mark-back adjustment |
| USD 11.04 B (2024) | Regional Consultancy B | Counts only insulin delivery devices; monitoring segment omitted |
| USD 10.25 B (2024) | Industry Association C | Applies static prevalence rates and does not model CGM penetration growth |
The comparison shows that once scope alignment and price-level corrections are applied, figures converge toward Mordor's balanced baseline, giving decision-makers a dependable, transparent foundation for planning.


Key Questions Answered in the Report
How big is the United States Diabetes Devices Market?
The United States Diabetes Devices Market size is expected to reach USD 28.29 billion in 2026 and grow at a CAGR of 5.78% to reach USD 37.45 billion by 2031.
Which product category holds the largest US Diabetes Devices market share?
Monitoring devices, led by continuous glucose monitoring systems, command roughly 57.64 % share of revenue.
Who are the key players in United States Diabetes Devices Market?
Abbott, Dexcom, Becton Dickinson, Medtronic and F. Hoffmann-La Roche AG are the major companies operating in the United States Diabetes Devices Market.
What regional factors shape demand for diabetes technology in the United States?
The Northeast benefits from higher insurance coverage and academic centers, while the South faces affordability challenges despite higher diabetes prevalence, leading to varying adoption rates across regions.
Page last updated on:


