Hyperspectral Imaging Market Size and Share
Market Overview
| Study Period | 2020 - 2031 |
|---|---|
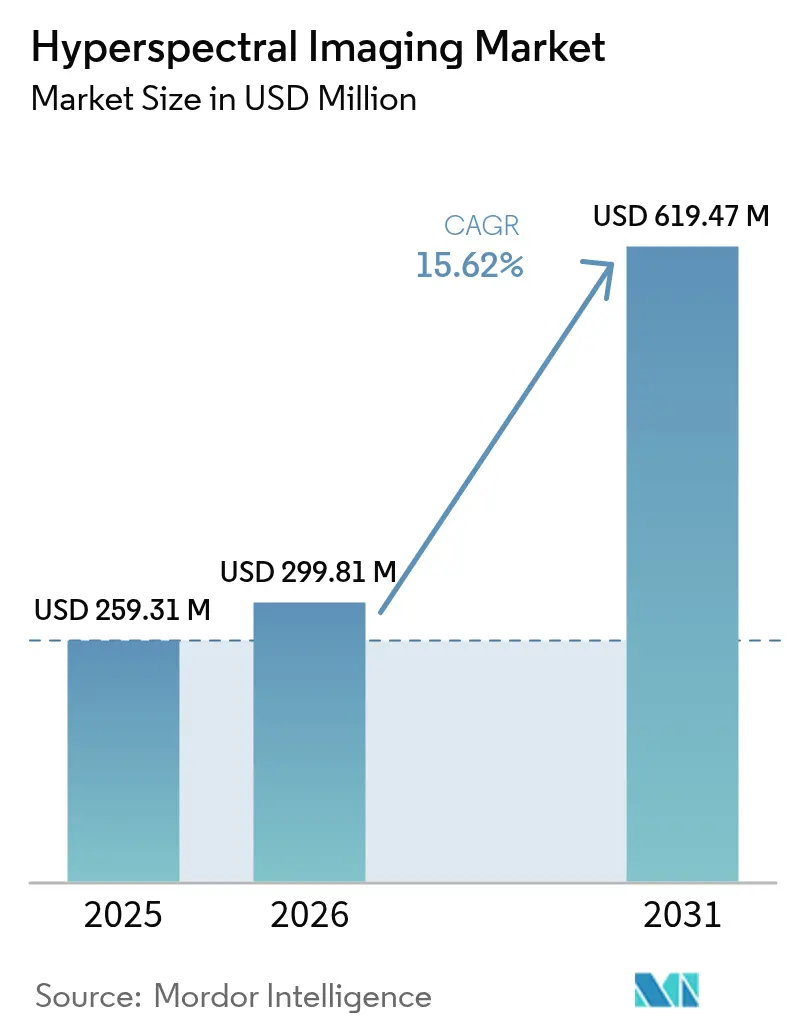
| Market Size (2026) | USD 299.81 Million |
| Market Size (2031) | USD 619.47 Million |
| Growth Rate (2026 - 2031) | 15.62% CAGR |
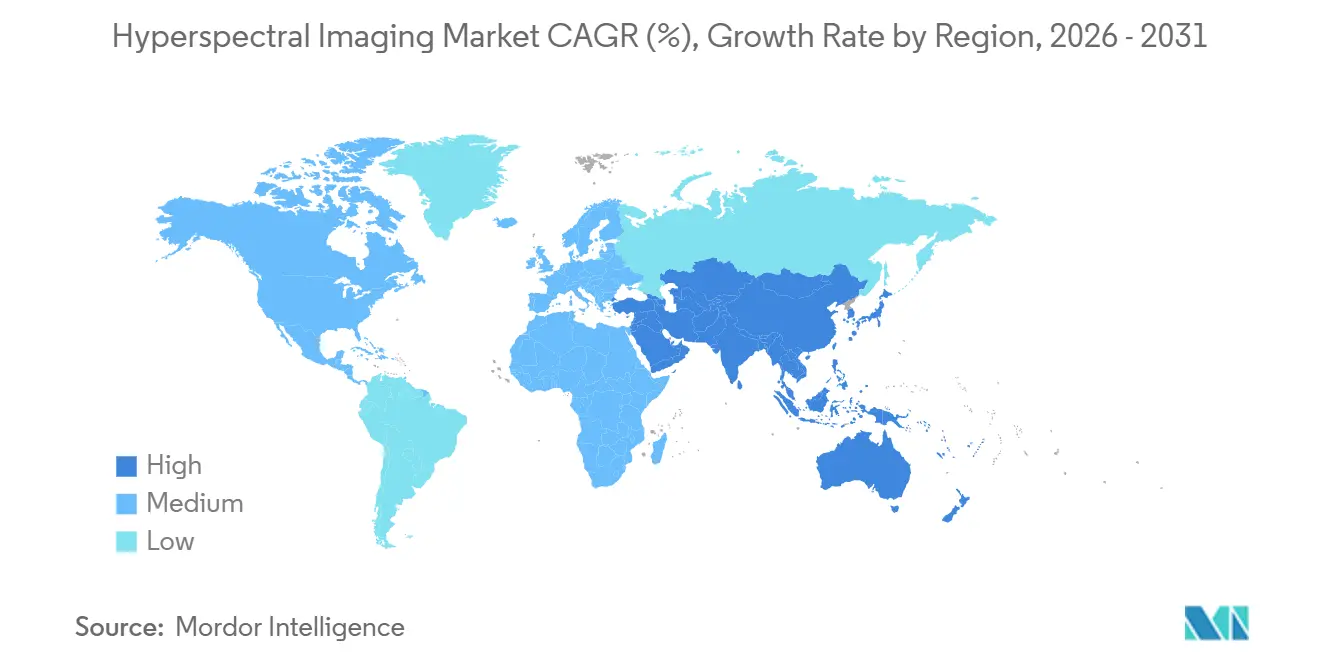
| Fastest Growing Market | Asia Pacific |
| Largest Market | North America |
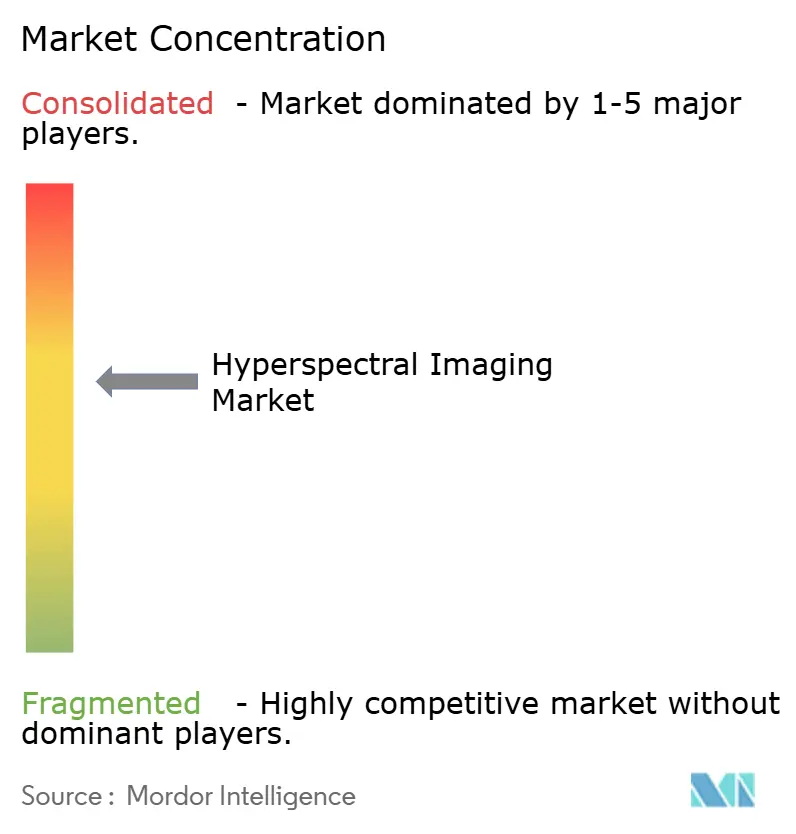
| Market Concentration | Medium |
Major Players *Disclaimer: Major Players sorted in no particular order Image © Mordor Intelligence. Reuse requires attribution under CC BY 4.0. | |
Hyperspectral Imaging Market Analysis by Mordor Intelligence
The hyperspectral imaging market size is expected to increase from USD 259.31 million in 2025 to USD 299.81 million in 2026 and reach USD 619.47 million by 2031, growing at a CAGR of 15.62% over 2026-2031. Precision-agriculture programs in China, India, and Japan, the shift from laboratory benches to field-deployable sensors, and defense demand for space-borne constellations accelerated 2025 installations. Integration of on-chip neural networks drove inference latency below 10 milliseconds, enabling snapshot cameras to displace pushbroom scanners on high-speed food-sorting lines. Reimbursement codes for hyperspectral-guided surgery, which took effect in Germany, the United Kingdom, and the United States in 2025, broadened the healthcare customer base. Cost erosion of visible-near-infrared (VNIR) and short-wave-infrared (SWIR) detectors lowered entry-level system pricing by 35% between 2024 and 2025, opening adoption among smallholder cooperatives in Brazil and India. Meanwhile, United States export controls on indium gallium arsenide arrays created supply tightness, bifurcating the vendor landscape into high-performance Western suppliers and cost-sensitive Asian entrants.
Key Report Takeaways
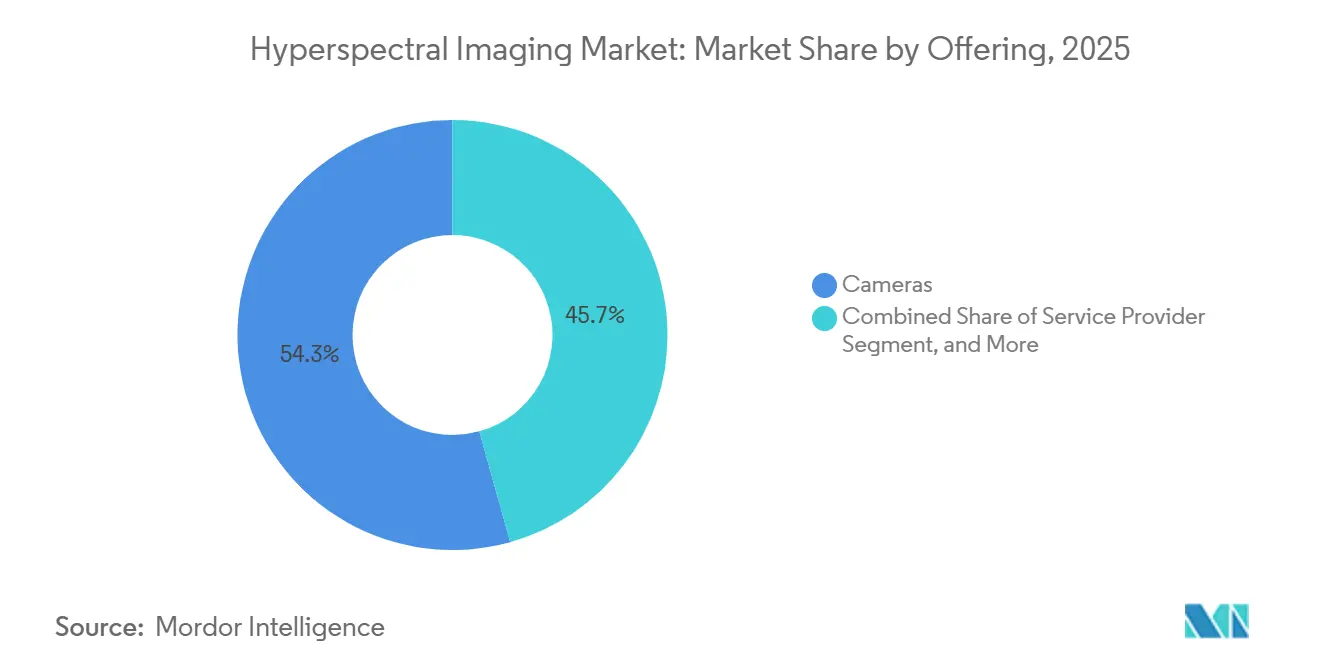
- By offering, cameras led with 54.32% revenue share in 2025, while service providers are forecast to expand at a 16.23% CAGR through 2031.
- By technology, pushbroom architectures accounted for 47.22% of 2025 revenue, whereas snapshot systems are projected to grow at a 16.61% CAGR to 2031.
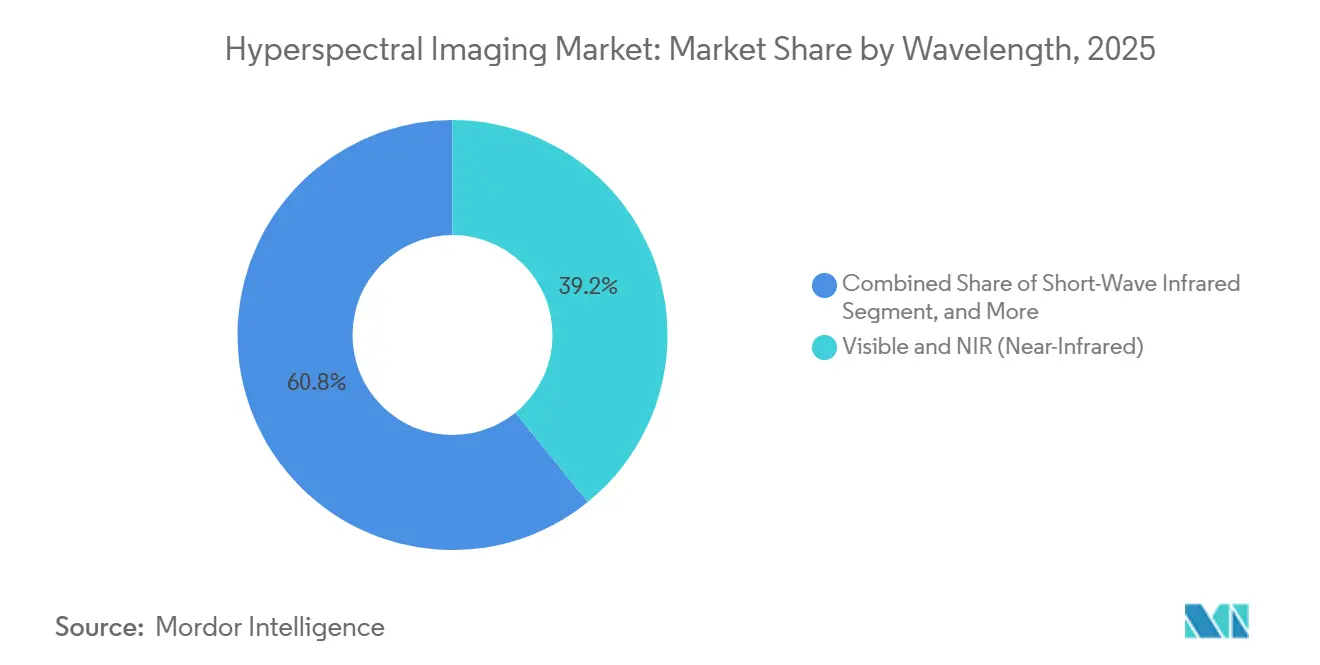
- By wavelength, visible- and near-infrared sensors accounted for 39.17% of 2025 sales, but short-wave infrared is advancing at a 16.44% CAGR through 2031.
- By end-user industry, food and agriculture accounted for 28.63% of 2025 demand, while healthcare is projected to grow at a 16.83% CAGR through 2031.
- By geography, North America commanded 35.72% of the 2025 value, while the Asia Pacific is on track for a 16.68% CAGR during 2026-2031.
Note: Market size and forecast figures in this report are generated using Mordor Intelligence’s proprietary estimation framework, updated with the latest available data and insights as of 2026.
Global Hyperspectral Imaging Market Trends and Insights
Drivers Impact Analysis*
| Driver | (~) % Impact on CAGR Forecast | Geographic Relevance | Impact Timeline |
|---|---|---|---|
| Integration of AI-Based On-Chip Analytics | +3.2% | Global, with early adoption in North America and Europe | Medium term (2-4 years) |
| Rapid Cost Erosion of VNIR and SWIR Sensors | +2.8% | Global, particularly benefiting Asia Pacific and South America | Short term (≤ 2 years) |
| Expanding Precision-Agriculture Programs in Asia Pacific | +2.5% | Asia Pacific core, with spillover to Middle East and Africa | Medium term (2-4 years) |
| DoD and DARPA Funding for Space-Borne HSI Constellations | +2.1% | North America, with technology transfer to allied nations | Long term (≥ 4 years) |
| Miniaturised Snapshot HSI for Smartphone Diagnostics | +1.9% | Global, with fastest uptake in urban centers across all regions | Medium term (2-4 years) |
| Mandatory ESG Disclosure Driving Mineral-Grade Verification | +1.7% | Europe and North America, expanding to Australia and South America | Medium term (2-4 years) |
| Source: Mordor Intelligence | |||
Integration of AI-Based On-Chip Analytics
Embedding convolutional neural networks directly onto sensor substrates reduced the gap between photon capture and classification from seconds to milliseconds, enabling untethered handheld units to operate in surgical theaters and remote farms. Imec’s 150-band prototype demonstrated 94% accuracy in identifying cancer margins while consuming less than 2 watts, proving its clinical viability. This hardware-software convergence eases compliance with the Health Insurance Portability and Accountability Act because raw cubes never leave the device. Taiwanese and South Korean foundries are now licensing the intellectual property blocks, signaling that any hyperspectral imaging camera priced above USD 15,000 will ship with on-chip inference by 2028. Vendors that master co-design of optics and silicon stand to capture premium margins as performance and privacy converge.
Rapid Cost Erosion of VNIR and SWIR Sensors
Manufacturing scale and the substitution of mercury cadmium telluride for indium gallium arsenide reduced SWIR camera list prices to USD 8,000 in 2025, a 35% decline in 12 months.[1]Teledyne DALSA, “Annual Report 2025,” teledynedalsa.com German and Dutch recycling plants adopted SWIR line-scan units to meet European Union Single-Use Plastics Directive mandates, doubling Teledyne DALSA shipments. VNIR modules now sell for under USD 5,000, enabling cooperatives in India and Brazil to certify produce quality for export contracts. This price compression, however, forced three component suppliers to exit in 2025 and is catalyzing automation investments among survivors to defend gross margin. The hyperspectral imaging market will approach cost parity with high-end RGB cameras by 2029, spurring volume but intensifying commoditization risk.
Expanding Precision-Agriculture Programs in the Asia Pacific
China’s Ministry of Agriculture and Rural Affairs subsidized CNY 2.1 billion (USD 290 million) in drone purchases during 2025, covering sensors that monitor 15 million hectares of rice paddies for nitrogen stress.[2]Ministry of Agriculture and Rural Affairs, “Agricultural Modernization Programs 2025,” moa.gov.cn India’s National Mission for Sustainable Agriculture deployed 1,200 cameras across 12 states, integrating spectra into a soil-health portal that guides fertilizer dosing. Japan co-funded 500 greenhouse installations that detect fungal outbreaks 72 hours before visible symptoms, cutting fungicide use by 40%. These programs expand spectral libraries, improving machine-learning accuracy and drawing private analytics investment. South Korea’s pilot on ginseng signals the diffusion of hyperspectral imaging across high-value crops, positioning the Asia Pacific as the fastest-growing regional node in the hyperspectral imaging market.
DoD and DARPA Funding for Space-Borne HSI Constellations
The United States Department of Defense allocated USD 187 million in its fiscal 2025 budget to miniaturize hyperspectral payloads for small satellites that revisit targets every 90 minutes.[3]Defense Advanced Research Projects Agency, “Budget Estimates FY 2025,” darpa.mil DARPA’s Blackjack program contracted three vendors to shrink pushbroom scanners below 15 kilograms, while the National Reconnaissance Office purchased 24 snapshot imagers for its next-generation constellation. Venture-backed startups subsequently raised USD 45 million to adapt defense-grade sensors for methane-leak detection and precision agriculture. Dual-use technology accelerates scale but also exposes suppliers to export-control compliance costs, shaping supply-chain choices through the forecast horizon.
Restraints Impact Analysis*
| Restraint | (~) % Impact on CAGR Forecast | Geographic Relevance | Impact Timeline |
|---|---|---|---|
| Persistent Calibration Drift in Field-Deployable Units | -1.8% | Global, most acute in high-humidity and high-temperature regions | Short term (≤ 2 years) |
| High Capex and Data-Storage Costs | -1.5% | Emerging markets in Asia Pacific, South America, and Africa | Medium term (2-4 years) |
| US-China Export-Control Regimes on Sensor Cores | -1.3% | Global supply chain, with concentrated impact on Asia Pacific | Long term (≥ 4 years) |
| Scarcity of Domain-Specific Spectral Libraries | -1.1% | Global, particularly limiting adoption in healthcare and recycling | Medium term (2-4 years) |
| Source: Mordor Intelligence | |||
Persistent Calibration Drift in Field-Deployable Units
Hyperspectral cameras operating outdoors experience wavelength shifts of 2-5 nanometers per month due to thermal cycling and vibration, degrading classification accuracy and requiring recalibration every 2 weeks on agricultural drones in India. Manufacturers embed reference targets and self-calibration routines, adding 8% to the bill of materials and consuming 15% of battery capacity. Until solid-state wavelength standards are commercialized, operators will continue to budget 10-15% of capex for annual recalibration contracts, dampening the expansion of the hyperspectral imaging market among cash-constrained buyers.
High Capex and Data-Storage Costs
Complete hyperspectral setups cost USD 80,000-300,000, far above the budgets of most small and medium enterprises. A single eight-hour food-processing shift produces 2 terabytes of data, driving monthly cloud-processing fees of USD 3,600-8,640 at prevailing rates. Hardware accelerators that compress files by 70% add USD 5,000 to system cost, creating a barrier that persists until economies of scale reduce accelerator prices below USD 1,000. Consequently, hyperspectral imaging industry service providers capture share by amortizing infrastructure across multiple clients, but direct ownership remains challenging for cooperatives and municipal recycling centers.
*Our forecasts treat driver/restraint impacts as directional, not additive. The impact forecasts reflect baseline growth, mix effects, and variable interactions.
Segment Analysis
By Offering: Service Providers Secure Growth as Complexity Rises
Service providers generated momentum, growing at a projected 16.23% CAGR through 2031, even as cameras retained 54.32% of 2025 revenue. Many hospitals, mining firms, and recycling operators lack the expertise to maintain calibration routines or curate spectral libraries, so they outsource analytics subscriptions that bundle cloud inference and continuous model updates. This shift echoes the broader move toward outcome-based contracts across the hyperspectral imaging market and incentivizes incumbents to spin out data-centric entities. Hardware margins compressed as average camera selling prices fell 12% in 2025, pushing vendors to emphasize post-sale services. System integrators, responsible for nearly 30% of 2025 value, feel margin pressure because modular architectures allow do-it-yourself assembly, though they still thrive in pharmaceutical tablet inspection and seed phenotyping, where domain knowledge matters.
Subscription models exhibit stickiness; a 2025 American College of Surgeons survey found 68% of hospitals piloting intraoperative guidance preferred pay-as-you-go analytics. The hyperspectral imaging market for service contracts could rival hardware revenue by the end of the decade if adoption patterns in healthcare are replicated across food and agriculture. However, data-sovereignty laws in the European Union require regional hosting, obliging providers to maintain multiple data centers. Cameras remain the gateway, yet smartphone integration projects threaten to cannibalize entry-level units by bundling VNIR capability into consumer devices. Integrators respond by pivoting to turnkey SWIR and mid-wave-infrared systems that remain beyond handheld hardware, preserving differentiation amid the commoditization of VNIR sensors.


By Technology: Snapshot Designs Challenge Pushbroom Dominance
Snapshot imagers are forecast to expand at 16.61% annually through 2031, eroding pushbroom systems' 47.22% revenue share in 2025. Pushbroom scanners still dominate conveyor sorting and satellite missions because of their superior spatial resolution and signal-to-noise ratio, but they require precise motion. Snapshot devices capture full cubes in a single exposure, eliminating motion blur and enabling frame rates above 60 hertz, traits vital for high-speed nut sorting mandated by a 2025 European Food Safety Authority directive. Tunable-filter cameras occupy the middle territory, offering flexible spectral resolution at slower acquisition speeds, while imaging Fourier-transform infrared systems remain niche due to vibration sensitivity and price.
Hybrid architectures emerged when Resonon launched the Pika XC2 in October 2025, enabling operators to switch between pushbroom and snapshot modes mid-mission. This versatility addresses varied scene dynamics in agriculture and medical diagnostics. The hyperspectral imaging market size for tunable-filter and Fourier-transform units will stay stable, serving laboratories and mineral-analysis facilities that prioritize resolution over speed. Whiskbroom units continue their decline, confined to legacy platforms. As miniaturization progresses, snapshot modules will integrate directly onto drone gimbals and surgical endoscopes, accelerating the displacement of traditional pushbroom equipment in portable scenarios.
By Wavelength: SWIR Adoption Accelerates on Packaging and Moisture Needs
Short-wave infrared equipment is set to grow at 16.44% annually through 2031, narrowing the gap with visible-near-infrared systems, which commanded 39.17% revenue in 2025. SWIR penetrates packaging films and detects internal moisture, allowing confectionery makers to locate foreign bodies inside wrapped products with 99.2% accuracy. Recent cost drops to USD 8,000 per SWIR array removed price as a major barrier, widening use in grain inspection and textile sorting. The growing hyperspectral imaging market is embracing SWIR, as regulatory agencies classify it as a Process Analytical Technology for pharmaceutical tablets, spurring compliance-driven purchases.
Visible-near-infrared remains indispensable for pigment identification in apples and plastics but faces commoditization as smartphone vendors test integrated modules. Mid-wave and long-wave infrared retain a niche status because cooling requirements increase costs. Vendors investing in uncooled microbolometer research could unlock mid-wave adoption post-2029, but until then, SWIR represents the primary expansion frontier. Export restrictions on focal-plane arrays constrain Western supply, allowing Chinese manufacturers to compete aggressively in agriculture and recycling, fragmenting the hyperspectral imaging market share between high-performance defense suppliers and cost-sensitive industrial entrants.
By End-User Industry: Healthcare Emerges as Fastest-Growing Vertical
Healthcare is projected to grow at 16.83% per year through 2031, surpassing every other end-user group. Reimbursement codes in Europe and the United States catalyzed hospital pilots for tumor-margin visualization and chronic-wound assessment. The hyperspectral imaging market size allocated to healthcare could double by 2028 if reimbursement expands to gastrointestinal and dermatology procedures. Food and agriculture still accounted for 28.63% of the 2025 demand but are facing slower growth as penetration in developed markets approaches maturity. Defense volumes remain high, yet average selling prices decline because proliferated small satellites replace a few exquisite systems with many low-cost units.
Mining companies use real-time spectral grading to speed ore blending, boosting mill throughput by 7% at a Chilean copper operation. Recycling adoption rises amid European Union targets for 65% plastics recovery, pushing SWIR to invest in high-throughput conveyor lines. Smaller verticals in textiles, forestry, and cultural heritage benefit from expanding spectral libraries that reduce model-training time. Regulatory rigor in healthcare elevates performance standards, indirectly improving quality across the hyperspectral imaging industry as vendors meet medical validation benchmarks that exceed requirements in industrial segments.
Geography Analysis
North America accounted for 35.72% of 2025 revenue, fueled by Department of Defense contracts, National Aeronautics and Space Administration missions, and early healthcare pilots in academic centers. The United States Department of Agriculture invested USD 42 million during 2025 for crop-disease monitoring across eight state extension services, while the National Institutes of Health awarded USD 18 million to surgical guidance research. Canada supports canola and wheat trials through provincial subsidies, and Mexico is building calibration centers to adapt spectral libraries to local crops. A supportive regulatory stance, highlighted by FDA draft guidance on Process Analytical Technology, encourages pharmaceutical adoption. Regional suppliers compete on bundled cloud storage as data volumes grow.
Asia Pacific is forecast to expand at a 16.68% CAGR during 2026-2031, making it the fastest region in the hyperspectral imaging market. China subsidized 3,200 drones in 2025 under its precision-agriculture initiative, while the 14th Five-Year Plan lists spectral imaging as a strategic priority. India’s National Mission for Sustainable Agriculture links spectral data to a soil portal serving 28 million farmers. Japan co-funds greenhouse installations to minimize fungicide use, and South Korean food processors deploy SWIR inspection lines to meet stricter import rules. Fragmentation among more than 60 local integrators and the absence of shared spectral libraries raise the total cost of ownership, but rapid declines in sensor prices offset part of the hurdle.
Europe, South America, the Middle East, and Africa together generated 47.6% of 2025 sales. Europe’s Corporate Sustainability Reporting Directive obliges mining companies to trace Scope 3 emissions, strengthening demand for in-situ ore-grade verification. Germany and the Netherlands lead in recycling adoption to meet European Union plastics-recovery targets. Brazil and Argentina pilot spectral drones in soybean fields, but connectivity gaps in the cloud impede rural rollouts. The United Arab Emirates procured 120 cameras in 2025 for greenhouse monitoring, while South Africa and Egypt dominate African mining revenue. Across these regions, certification-driven use cases outweigh cost barriers, anchoring steady penetration.

Competitive Landscape
The hyperspectral imaging market exhibits moderate concentration. Specim, Headwall Photonics, Teledyne DALSA, Resonon, and Corning together controlled about 40% of 2025 revenue, with more than 50 specialist integrators active in pharmaceuticals, textiles, and heritage conservation. Vertical integration is rising: Headwall spun off its analytics arm in January 2025 to sell subscription spectral libraries, while Teledyne DALSA acquired CloudSpectral in March 2025 to bundle storage and inference, reducing deployment times from six months to eight weeks. Patent activity underscores miniaturization priorities; 47 United States patents granted in 2025 focused mainly on neural-network accelerators and snapshot optics.
Smaller firms differentiate through niche expertise. ClydeHSI focuses on mining, HyperMed Imaging on surgical guidance, and Telops on wildfire detection from geostationary orbit. Yet limited capital constrains manufacturing scale, and compliance with export-control rules complicates cross-border sales. The looming threat of smartphone integration could commoditize VNIR modules by 2028, potentially shrinking standalone industrial camera demand by 15%. Incumbents hedge by emphasizing SWIR and mid-wave infrared lines that remain beyond consumer reach. Semiconductor foundries licensing hyperspectral intellectual property to adjacent industries intensifies competition, while software-defined sensors that reconfigure spectral response via firmware updates offer low-switching-cost alternatives for end users.
White-space opportunities persist in emerging markets where local spectral libraries are scarce. Vendors establishing regional calibration hubs and co-developing datasets with agricultural extension services can seize a first-mover advantage. However, Western suppliers must navigate the United States Bureau of Industry and Security restrictions on indium gallium arsenide arrays, which limit shipments to certain regions and reinforce a bifurcated ecosystem of high-performance Western solutions and cost-driven Asian offerings.
Hyperspectral Imaging Industry Leaders
Galileo Group, Inc.
BaySpec Inc.
Specim Spectral Imaging Ltd
Corning Incorporated
Surface Optics Corporation
- *Disclaimer: Major Players sorted in no particular order

Recent Industry Developments
- February 2026: Specim completed field tests of its prototype 200-band drone payload, confirming 60-hertz snapshot acquisition ahead of the planned commercial launch in Q4 2026.
- November 2025: BaySpec received a USD 3.8 million United States Department of Energy contract to monitor lithium-ion battery electrode production, targeting a 30% scrap-rate reduction in domestic gigafactories.
- October 2025: Corning announced a USD 25 million expansion of its New Hampshire optics plant to triple SWIR lens output by Q4 2026.
- August 2025: Resonon launched the Pika XC2 dual-mode camera, booking 37 orders from Californian cooperatives and German university hospitals.


Global Hyperspectral Imaging Market Report Scope
The Hyperspectral Imaging Market Report is Segmented by Offering (Cameras, System Integrator, Service Provider), Technology (Pushbroom, Snapshot, Tunable Filter, Imaging FTIR, Whiskbroom), Wavelength (Visible and NIR (Near-Infrared), Short-Wave Infrared, Mid-Wave Infrared, Long-Wave Infrared), End-User Industry (Food and Agriculture, Healthcare, Defense, Mining and Metrology, Recycling, Other End-User Industries), and Geography (North America, South America, Europe, Asia Pacific, Middle East and Africa). The Market Forecasts are Provided in Terms of Value (USD).
| Cameras |
| System Integrator |
| Service Provider |
| Pushbroom |
| Snapshot |
| Tunable Filter |
| Imaging FTIR |
| Whiskbroom |
| Visible and NIR (Near-Infrared) |
| Short-Wave Infrared |
| Mid-Wave Infrared |
| Long-Wave Infrared |
| Food and Agriculture |
| Healthcare |
| Defense |
| Mining and Metrology |
| Recycling |
| Other End-User Industries |
| North America | United States | |
| Canada | ||
| Mexico | ||
| South America | Brazil | |
| Argentina | ||
| Rest of South America | ||
| Europe | Germany | |
| United Kingdom | ||
| France | ||
| Italy | ||
| Spain | ||
| Rest of Europe | ||
| Asia Pacific | China | |
| Japan | ||
| India | ||
| South Korea | ||
| Rest of Asia Pacific | ||
| Middle East and Africa | Middle East | United Arab Emirates |
| Saudi Arabia | ||
| Rest of Middle East | ||
| Africa | South Africa | |
| Egypt | ||
| Rest of Africa | ||
| By Offering | Cameras | ||
| System Integrator | |||
| Service Provider | |||
| By Technology | Pushbroom | ||
| Snapshot | |||
| Tunable Filter | |||
| Imaging FTIR | |||
| Whiskbroom | |||
| By Wavelength | Visible and NIR (Near-Infrared) | ||
| Short-Wave Infrared | |||
| Mid-Wave Infrared | |||
| Long-Wave Infrared | |||
| By End-User Industry | Food and Agriculture | ||
| Healthcare | |||
| Defense | |||
| Mining and Metrology | |||
| Recycling | |||
| Other End-User Industries | |||
| By Geography | North America | United States | |
| Canada | |||
| Mexico | |||
| South America | Brazil | ||
| Argentina | |||
| Rest of South America | |||
| Europe | Germany | ||
| United Kingdom | |||
| France | |||
| Italy | |||
| Spain | |||
| Rest of Europe | |||
| Asia Pacific | China | ||
| Japan | |||
| India | |||
| South Korea | |||
| Rest of Asia Pacific | |||
| Middle East and Africa | Middle East | United Arab Emirates | |
| Saudi Arabia | |||
| Rest of Middle East | |||
| Africa | South Africa | ||
| Egypt | |||
| Rest of Africa | |||


Key Questions Answered in the Report
What is the projected value of the hyperspectral imaging market in 2031?
The market is forecast to reach USD 619.47 million by 2031, reflecting a 15.62% CAGR over 2026-2031.
Which region will grow fastest through 2031?
Asia Pacific is set to expand at a 16.68% CAGR, driven by large-scale precision-agriculture subsidies in China and India.
Which technology segment is advancing most quickly?
Snapshot architectures are projected to grow at 16.61% annually as they enable motion-tolerant, high-speed capture.
Why is healthcare adoption accelerating?
New reimbursement codes in Europe and the United States, combined with real-time tissue-classification accuracy of 94%, are fueling hospital deployments.
How are vendors addressing calibration drift?
Manufacturers embed reference targets and self-calibration algorithms, though this adds roughly 8% to bill-of-materials and increases power draw.
What impact could smartphone integration have on dedicated cameras?
If VNIR modules become standard in flagship phones by 2028, the standalone industrial camera segment could contract by 15%.
Page last updated on:


