
Market Overview
| Study Period | 2021 - 2031 |
|---|---|
| Forecast Data Period | 2026 - 2031 |
| Base Year Market Size (2025) | USD 10.89 Billion |
| Market Size (2026) | USD 11.7 Billion |
| Market Size (2031) | USD 16.76 Billion |
| Growth Rate (2026 - 2031) | 7.44 % |
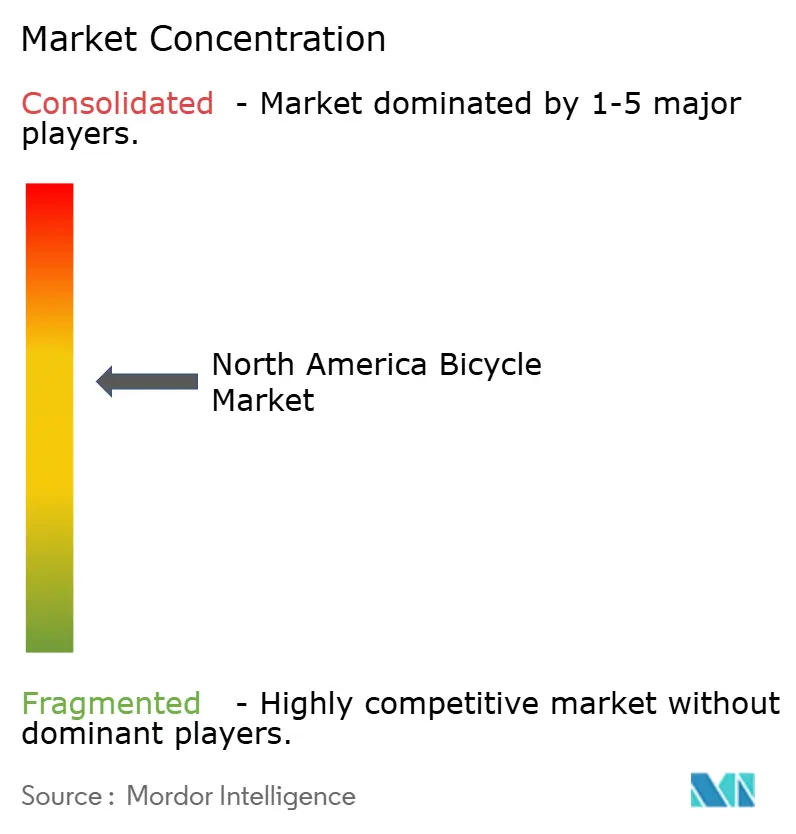
| Market Concentration | Medium |
Major Players
*Disclaimer: Major Players sorted in no particular order Image © Mordor Intelligence. Reuse requires attribution under CC BY 4.0. |
|
North America Bicycle Market Analysis by Mordor Intelligence
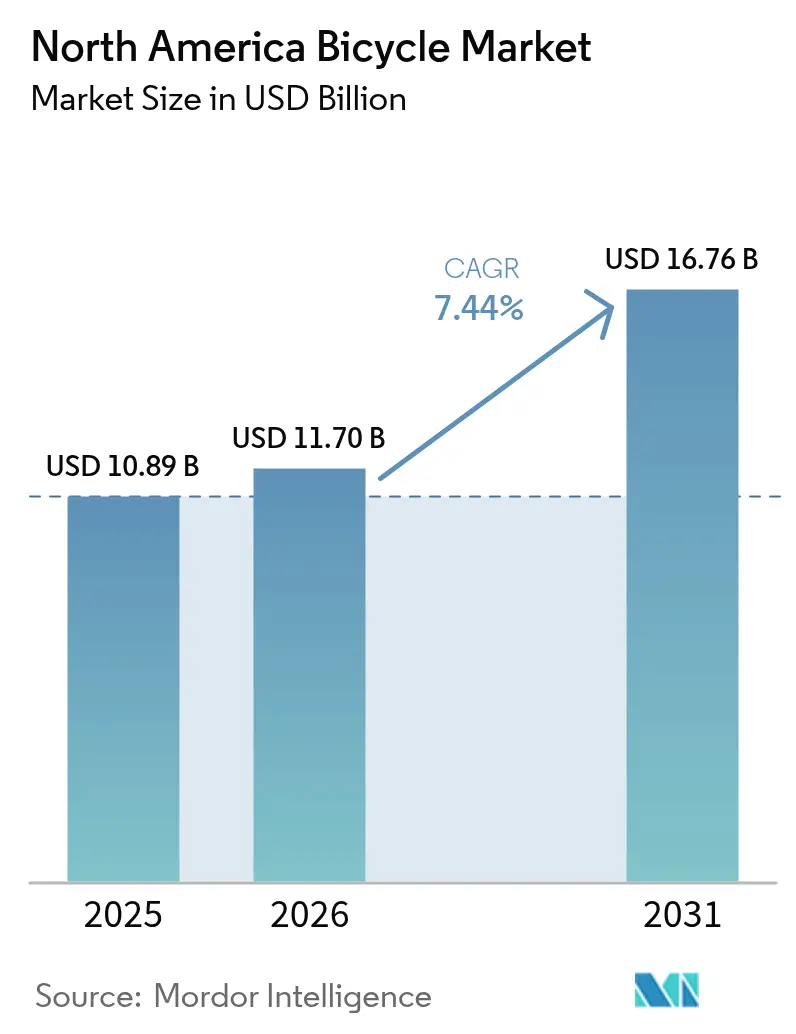
North American bicycle market size in 2026 is estimated at USD 11.7 billion, growing from 2025 value of USD 10.89 billion with 2031 projections showing USD 16.76 billion, growing at 7.44% CAGR over 2026-2031. Public-sector investments, corporate ESG procurement, and supply-chain near-shoring are driving this optimistic outlook. In the U.S., a notable USD 44.5 million allocation for active transportation underscores the visibility of demand, supporting infrastructure development and encouraging the adoption of bicycles as a sustainable mode of transport. Companies adhering to science-based climate targets are increasingly adopting bicycle fleets to reduce Scope 3 emissions, which include indirect emissions from their supply chains and product use. This trend is significantly contributing to the growth of the North American bicycle market by adding institutional demand. Meanwhile, the rise of battery-as-a-service models is alleviating ownership costs by offering flexible subscription-based solutions for battery usage, making electric bicycles more accessible to consumers. This innovation is helping the North American bicycles market stay robust as the initial pandemic-driven enthusiasm for cycling normalizes. Additionally, assembly hubs in Mexico are shortening lead times and reducing tariff exposure, providing manufacturers with new cost advantages. These hubs not only enhance operational efficiency but also strengthen the region's position as a competitive manufacturing base, reinforcing long-term competitiveness in the market.
Key Report Takeaways
- By product type, mountain/all-terrain models led with 35.02% of the North America bicycles market share in 2025, while hybrid units are forecast to post a 7.62% CAGR from 2026-2031.
- By design, regular frames commanded 92.05% of the North American bicycle market size in 2025, and folding designs are on track for a 9.86% CAGR through 2031.
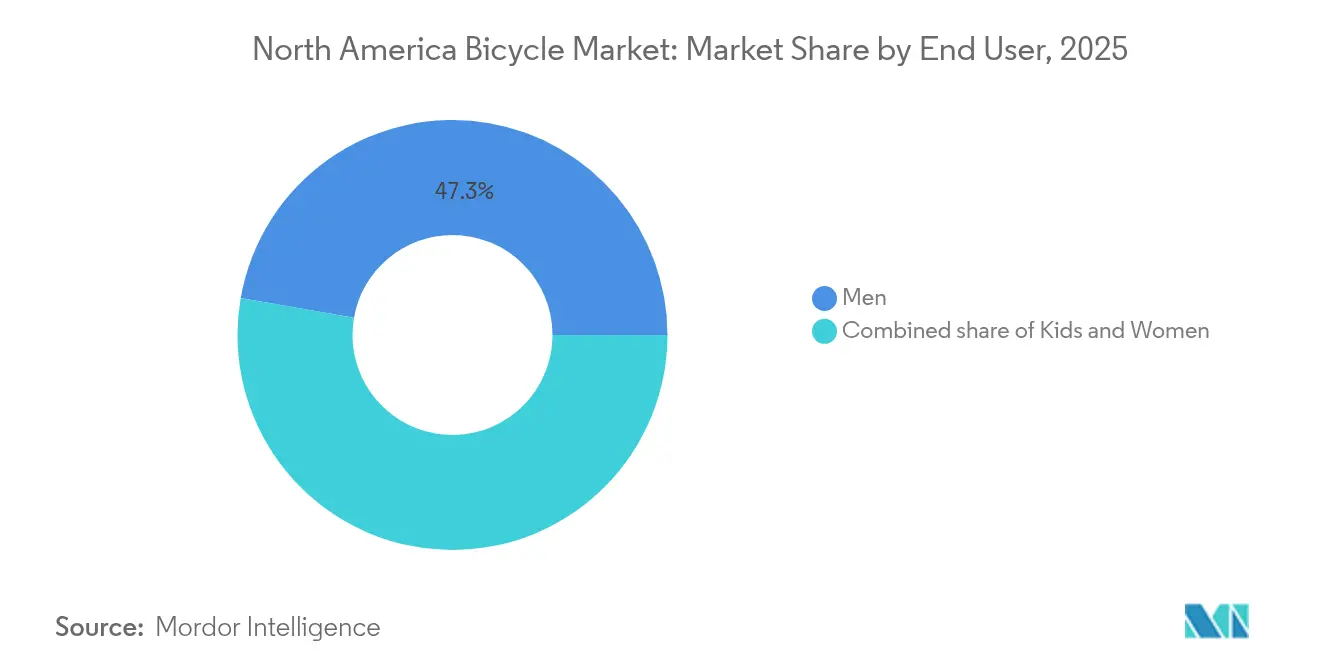
- By end user, men accounted for 47.25% of 2025 revenue, whereas the kids category is expected to grow at an 8.46% CAGR over the forecast period.
- By distribution channel, offline retail outlets held 66.65% of 2025 sales, and online platforms are projected to log a 7.88% CAGR between 2026 and 2031.
Note: Market size and forecast figures in this report are generated using Mordor Intelligence’s proprietary estimation framework, updated with the latest available data and insights as of 2026.
North America Bicycle Market Trends and Insights
Drivers Impact Analysis*
| Driver | (~) % Impact on CAGR Forecast | Geographic Relevance | Impact Timeline |
|---|---|---|---|
| Urban-mobility funding programs | +1.8% | United States, Canada, spillover to Mexico | Medium term (2-4 years) |
| Micro-mobility subscription expansion | +1.2% | Major North American metros | Short term (≤ 2 years) |
| OEM e-bike assembly investments in Mexico | +0.9% | Mexico manufacturing, regional distribution | Long term (≥ 4 years) |
| ESG-driven corporate fleet orders | +0.7% | U.S. and Canadian corporate hubs | Medium term (2-4 years) |
| Battery-as-a-service pricing | +1.1% | Urban delivery corridors | Medium term (2-4 years) |
| Fitness-centric lifestyle shifts | +1.5% | Suburban and recreational zones | Short term (≤ 2 years) |
| Source: Mordor Intelligence | |||


Urban-mobility funding programs drive infrastructure-led demand
In North America, the bicycle market thrives not just on consumer enthusiasm but significantly on robust infrastructure grants. Under the U.S. Infrastructure Investment and Jobs Act, a notable USD 44.5 million is allocated for active-transportation projects in 2025, focusing on protected lanes, greenways, and shared-mobility hubs[1]Source: U.S Department of Transportation,"INVESTING IN AMERICA: Biden-Harris Administration Announces Nearly $45 Million in Grant Awards for Connected, Active Transportation Infrastructure Projects", highways.dot.gov. These projects aim to enhance urban mobility, reduce traffic congestion, and promote environmentally sustainable transportation options. Canada bolsters this initiative with its USD 400 million Active Transportation Fund, designating USD 19 million specifically for British Columbia[2]Source: Government of Canada, "Active transportation investments across British Columbia", canada.ca. This fund supports the development of bike-friendly infrastructure, including dedicated cycling paths and pedestrian-friendly zones, to encourage active commuting. States, too, play a pivotal role; for instance, California is channeling a substantial USD 930 million over four years into bike and pedestrian corridors. This investment is expected to significantly improve connectivity and safety for cyclists and pedestrians alike. Such comprehensive investments elevate bicycles to the status of quasi-infrastructure assets, with municipal agencies and corporate fleets acquiring them on a predictable basis. As these transportation networks evolve, the North American bicycle market sees consistent demand, driven by replacement programs, fleet expansions, and maintenance contracts, all synchronized with public budgeting timelines.
Micro-mobility subscription platforms reshape urban transportation
Subscription services are making premium hardware more accessible and generating steady revenue streams. These services lower the financial barrier for consumers, enabling them to access high-quality products without significant upfront costs. In major U.S. cities, micromobility operators are now logging over 150 million annual rides, a clear sign of mainstream acceptance and growing reliance on shared mobility solutions. Cities are increasingly incorporating e-bike sharing into their strategies to combat congestion and reduce emissions, steering commuters away from single-occupancy vehicles and promoting sustainable urban transportation. This shift allows bicycle manufacturers to transition from unpredictable one-time sales to stable multi-year leasing contracts, bolstering their cash flow and creating predictable revenue models. As a result, there's a consistent influx of refurbished units into well-managed second-life channels, not only extending product life but also bolstering sustainability narratives that appeal to ESG investors. These second-life channels ensure that refurbished products are efficiently utilized, reducing waste and aligning with environmental goals.
OEM manufacturing investments in Mexico create supply-chain alternatives
U.S. anti-dumping duties on Chinese bicycles, ranging from 50.5% to 56%, need urgent attention. These high tariffs have prompted OEMs to explore alternative strategies to maintain competitiveness in the market. As a result, many are shifting their focus to assembly operations in Mexico. This move aligns with USMCA regulations, which allow finished goods assembled in the region to enter the U.S. duty-free, providing a significant cost advantage. Yadea's new plant in Ocoyoacac, representing a USD 78.6 million investment and an annual production capacity of 30,000 two-wheelers, exemplifies this reshoring trend. This facility highlights the growing importance of regional manufacturing hubs in reducing dependency on Far-East production. Proximity to the North American market not only mitigates ocean freight fluctuations but also simplifies the replenishment of service parts, ensuring a more reliable supply chain. These advantages enable the North American bicycle market to respond swiftly to fluctuations in retailer inventories, improving overall market efficiency. In the long term, the supplier base for critical components such as drivetrains, frames, and electronics is expected to co-locate near these assembly hubs. This co-location is likely to foster cluster economics, driving down production costs through shared resources and efficiencies. Such developments could position regional production as a cost-effective alternative to Far-East manufacturing, even when factoring in tariffs. This shift underscores the strategic importance of reshoring in strengthening the North American bicycle market's resilience and competitiveness.
ESG-driven corporate fleet procurement institutionalizes demand
Corporate carbon targets now categorize employee commuting under Scope 3 accounting. As a result, organizations can substantiate their decision to subsidize bicycle leases as tangible tools for decarbonization. These subsidies not only align with sustainability goals but also contribute to reducing the overall carbon footprint of businesses. It's become standard for Fortune 500 companies to allocate an average monthly subsidy of USD 125 per rider in their sustainability budgets. This consistent financial commitment helps insulate the North American bicycle market from fluctuations in household disposable income, ensuring a steady demand for bicycles. Furthermore, proposed U.S. tax legislation, inspired by European commuter-bike incentives, aims to recognize these subsidies as deductible expenses. If implemented, this legislation could significantly enhance the affordability and attractiveness of commuter bicycles, thereby amplifying demand across diverse sectors, from technology to logistics, and further supporting corporate sustainability initiatives.
Restraints Impact Analysis*
| Restraint | (~) % Impact on CAGR Forecast | Geographic Relevance | Impact Timeline |
|---|---|---|---|
| Bike-theft insurance gaps | -0.8% | Dense urban cores | Short term (≤ 2 years) |
| Component supply-chain fragility | -1.2% | North American production networks | Medium term (2-4 years) |
| Anti-dumping duties on Chinese imports | -1.1% | U.S. and Canadian importers | Short term (≤ 2 years) |
| Growing second-hand marketplace cannibalization | -0.6% | High-ownership regions | Long term (≥ 4 years) |
| Source: Mordor Intelligence | |||
Bike-theft insurance gaps undermine urban adoption
Active riders face annual theft rates of about 4.2%, leading to losses of USD 1.4 billion. Coverage for these losses is inconsistent; many property insurers exclude bicycles valued over USD 1,000, unless policyholders opt for expensive riders. This lack of coverage disproportionately impacts lower-income neighborhoods, where higher theft risks create significant barriers to bicycle ownership and use. These barriers prevent public agencies from effectively serving key demographics, limiting the potential for equitable market growth. The challenge is particularly severe in the electric bicycle segment, where retail prices start at USD 2,000, making them even less accessible to vulnerable groups. Without broader insurance offerings or city investments in secure parking infrastructure, theft concerns will continue to undermine consumer confidence and hinder the growth of North America's bicycle market.
Component supply-chain fragility creates production bottlenecks
Asian factories dominate the production of gearsets, brake systems, and mid-drive motors, making them critical hubs for these components. Freight costs have surged to three times their 2019 levels, significantly impacting the supply chain. Suppliers increasingly prioritize high-margin automotive contracts during periods of tight capacity, which further exacerbates supply constraints for other industries. This volatility in lead times compels OEMs to bolster their inventory buffers to mitigate risks, but this approach ties up substantial working capital and delays the introduction of new models, hindering market responsiveness. Although there's a growing push for near-shoring to reduce dependency on overseas suppliers, scaling the production of precision components domestically is a complex process that requires years of investment in infrastructure, technology, and skilled labor. Consequently, the North American bicycle market remains exposed to parts shortages and price surges, with these challenges likely to persist until capacity diversification efforts reach maturity.
*Our forecasts treat driver/restraint impacts as directional, not additive. The impact forecasts reflect baseline growth, mix effects, and variable interactions.
Segment Analysis
By Product Type: Mountain resilience versus hybrid momentum
In 2025, mountain and all-terrain bikes command a 35.02% share of the North American bicycle market, fueled by a surge in consumer enthusiasm for outdoor escapades and off-road cycling. Bolstered by trail-building grants and investments, this segment has broadened accessible riding zones, amplifying mountain biking's allure across diverse demographics. Enthusiasts, drawn to the rugged versatility and durability of these bikes, prioritize performance on challenging terrains. As riders increasingly seek premium frames, advanced suspension systems, and specialized trail accessories, discretionary spending on mountain bikes remains strong. Manufacturers are fine-tuning product lines, emphasizing a balance between strength and weight to align with shifting rider demands. While other categories gain traction, mountain bikes retain a devoted following, solidifying their status as a primary revenue source for leading bicycle brands.
Hybrid bicycles are set to outstrip all other categories, boasting a projected CAGR of 7.62%, positioning them as North America's fastest-growing segment. This surge is driven by a rising tide of commuters and leisure riders gravitating towards versatile bikes adept on both paved and unpaved surfaces. Infrastructure advancements, like the melding of protected lanes with gravel connectors, empower hybrid riders to navigate diverse terrains without the hassle of switching bikes. With their blend of comfort, durability, and adaptability, hybrids cater perfectly to urban riders prioritizing practicality. In response, top manufacturers are refining product ranges and channeling research and development into crafting frames that strike a balance between sturdiness and lightweight design. As hybrids cement their status as the market's utility cornerstone, their ascent underscores a broader consumer shift towards versatile mobility and active living.



By Design: Regular dominance amid folding growth
In 2025, regular bike frames command a dominant 92.05% share of total shipments. Their established diamond geometries ensure consistent ride comfort and easy maintenance. These traditional designs, favored in both leisure and sports cycling, boast straightforward constructions. This simplicity translates to affordability, making regular frames particularly attractive to first-time buyers, families, and casual riders. Manufacturers are honing in on the delicate balance of durability, weight, and cost, ensuring these bikes remain widely accessible. The ready availability of spare parts and familiar repair processes further bolsters their popularity across diverse markets. In essence, regular frame bikes stand as the cornerstone of the North American bicycle market, celebrated for their versatility in both recreational and sporting arenas.
Folding bikes are emerging as the market's fastest-growing segment, boasting a robust projected CAGR of 9.86%. This surge is largely fueled by urban centers grappling with space constraints. Their compact, portable design caters perfectly to apartment dwellers and those navigating multi-modal commutes in bustling cities. Major metropolitan transit authorities, including those in New York, Toronto, and Vancouver, have relaxed restrictions on carrying folding bikes during peak hours, further bolstering their appeal in public transport. While they currently hold a modest slice of the North American market, folding bikes are witnessing a notable uptick as urban residents hunt for convenient mobility solutions. A notable trend sees weekday commuters opting for folding bikes for practical travel, then transitioning to regular or electric bikes for leisurely weekend rides, highlighting a growing trend of dual ownership. This adaptability accentuates folding bikes' pivotal role in navigating urban mobility challenges and aligning with modern lifestyle preferences.
By End User: Established male base meets fast-growing youth segment
In 2025, men made up 47.25% of total revenue in North America's bicycle market, underscoring their position as the dominant consumer segment. Their leadership stems from a penchant for premium bikes and accessories, often leading to higher average selling prices. Male consumers frequently opt for performance-oriented bikes and invest in gear like helmets, apparel, and maintenance products, amplifying their overall spending. This segment's robust purchasing power has fostered a diverse retail and service ecosystem tailored to their needs. Industry players are responding by rolling out high-end, specialized models, targeting male enthusiasts who crave innovation and advanced features. Even as demographic trends evolve, men continue to be pivotal revenue drivers, bolstering market growth through both new purchases and replacements.
The Kids segment is set to emerge as the North American bicycle market's fastest-growing category, boasting a notable CAGR of 8.46%. This surge is largely attributed to school-district safe-routes programs and bike-train initiatives, which promote cycling as a primary transport mode for young children. Such early adoption not only cultivates lifelong cycling habits but also fosters brand loyalty. Facilities like skill parks and after-school cycling clubs are nurturing this new generation of riders, spurring demand for bicycles, performance models, spare parts, and even digital training subscriptions. Retailers are evolving, redesigning store layouts and enhancing sizing services to draw in families and stay competitive in an increasingly online shopping landscape. Concurrently, infrastructure upgrades aimed at bolstering safety are elevating participation rates among both kids and women. Aware of the long-term benefits of early adoption, industry players are making strategic investments in youth engagement, eyeing sustained market growth.
By Distribution Channel: Brick-and-mortar endurance alongside digital ascent
In 2025, physical dealerships dominated North America's bicycle sales, accounting for 66.65% of the total. Their edge comes from providing vital services like accurate sizing, test rides, and bike assembly, all pivotal in shaping consumer purchase choices. Such hands-on experiences bolster customer confidence and satisfaction, especially for first-time buyers and those in need of specialized advice. Traditional retail venues also foster personalized interactions, letting customers delve deep into product ranges. Many dealerships are evolving, adding value-driven services like subscriptions, community rides, and flexible financing, all aimed at enriching the customer experience. Even with the digital surge, these retail hubs stand as vital touchpoints, upholding strong brand loyalty and trust.
E-commerce has emerged as the fastest-growing channel for bicycle sales in North America, boasting a robust 7.88% CAGR. This growth is fueled by logistics advancements in handling oversized products. Innovations like click-to-brick services allow customers to order online and get last-mile assembly or tuning at physical stores, merging convenience with expertise. Brands are also introducing virtual fitting tools, enabling consumers to choose the right bike size from home, thus easing online purchases. With regional warehouses and distribution centers facilitating two-day shipping for complete bicycles, delivery speed and customer satisfaction have seen a boost. This digital expansion aligns with a hybrid consumer journey: shoppers often scout products online, visit dealerships for sizing, finalize purchases digitally, and even schedule after-sales maintenance via mobile apps. The interplay between online and offline channels is allowing North America's bicycle market to harness omnichannel efficiencies while ensuring a premium customer experience.
Geography Analysis
In North America's bicycle market, the U.S. stands as a pivotal player, bolstered by federal grants for active transportation and supportive state initiatives. The Bipartisan Infrastructure Law has now earmarked shared micromobility as a valid recipient of CMAQ funds, directing investments into both hardware and digital platforms. State initiatives, such as California's commitment of USD 930 million over four years for bicycle and pedestrian infrastructure, are creating regional demand hubs catering to both recreational and commuting needs. Coastal metro-based multinationals are adopting bicycle stipends to meet emissions targets, which in turn fuels a consistent replacement cycle for fleet operators. However, the forward-looking tariff policy plays a crucial role, as duties ranging from 50.5% to 56% on Chinese bicycles and 45% on e-bikes exert pressure on consumer prices.
Canada is amplifying this regional momentum with its USD 400 million Active Transportation Fund, focusing on small to mid-sized communities that previously lacked cycling infrastructure. By integrating bike parking into new transit stations, municipalities are promoting multi-modal journeys, making daily cycling more commonplace even in colder climates. This strategic move not only stabilizes seasonal sales but also boosts demand for winter-specific bicycle accessories in North America.
On the supply side, Mexico's manufacturing resurgence acts as a counterbalance. USMCA's duty-free status and its geographical closeness, replenishment lead times are significantly reduced, allowing retailers to maintain leaner inventories during slower demand periods. Cities like Guadalajara and Monterrey are witnessing a surge in local ridership, driven by rising congestion and air-quality concerns. With local incomes on the rise, Mexico is evolving from a predominantly export-driven production model to one that also caters to its burgeoning domestic market.
Regulatory Landscape
In the United States, bicycle safety requirements are governed by the Consumer Product Safety Commission (CPSC) under 16 CFR Part 1512. The standard covers performance requirements for braking, steering, and structural integrity. For electric bicycles, the CPSC opened an Advance Notice of Proposed Rulemaking (ANPR) in March 2024 to review whether additional safety requirements are needed, increasing compliance focus around electrified models alongside existing bicycle rules.
Trade policy continues to influence landed costs and sourcing decisions across North America. In November 2025, the USTR extended 178 Section 301 tariff exclusions through November 10, 2026, while broader tariff authority and scope remained fluid into 2026. In Canada, consumer product oversight falls under the Canada Consumer Product Safety Act (CCPSA), and products such as childrens items with vinyl components are constrained by the Phthalates Regulations (SOR/2016-188), which cap specified phthalates at 1,000 mg/kg and shape material selection and supplier qualification.
Value Chain Analysis
The North America bicycle value chain starts with globally sourced inputs (including aluminum, carbon fiber, and electronics) and relies on highly import dependent components for drivetrains, braking systems, bearings, and mid-drive motors, with Asia and select European specialists playing outsized roles. This reliance leaves the chain sensitive to tariff changes and lead-time volatility, and it reinforces pinch points in high-grade carbon fiber availability and in specialized forging and machining capacity.
Downstream, OEMs and brands increasingly combine offshore production with regional paint, assembly, and OE manufacturing to shorten replenishment cycles for North American retailers and fleet buyers. Cardinal Cycling Group and Unibike opened Unibike America, including a painting and assembly facility in Spartanburg, South Carolina (April 2025), and Cycles Devinci offered OE production capacity in Chicoutimi, Quebec, positioned as a regional alternative for approximately 40,000 bikes annually (June 2025). Distribution remains split across independent bicycle dealers, big-box and specialty retailers, and expanding direct-to-consumer models, supported by service partnerships and dealership networks that reduce friction around assembly, fitting, and warranty support for higher-value e-bikes.
Competitive Landscape
The North American bicycle market indicates a moderate level of concentration. While Trek, Specialized, Giant, and Cannondale set the pace, their dominance is increasingly challenged by emerging e-bike-only brands. Trek's recent move to slash 40% of its SKUs underscores a strategic response to post-pandemic inventory challenges, aiming to streamline operations and manage excess stock effectively. In contrast, Specialized is making waves with its software-driven powertrain diagnostics, which not only enhance performance monitoring but also reflect a broader industry trend toward data-centric user experiences and connected ecosystems.
Component manufacturers hold considerable sway in the industry, playing a pivotal role in shaping the overall market dynamics. Bosch and Bafang, as dominant players in the e-bike motor segment, are not only setting the standards for assembled bikes but are also significantly influencing the design and engineering processes. Their technological advancements and product specifications are driving performance benchmarks, impacting the choices of manufacturers and consumers alike. This influence extends to determining critical aspects such as motor efficiency, durability, and compatibility, which are essential for meeting the evolving demands of the market.
Battery manufacturers are deepening ties with fleet operators, integrating telematics to enhance charging efficiency and prevent theft. These collaborations aim to improve operational reliability and reduce downtime, which is critical for fleet operators managing large-scale deployments. The competitive landscape is evolving, with a newfound emphasis on total lifecycle value over initial pricing, signaling a potential surge in recurring-revenue innovations in the North American bicycles market. This shift encourages manufacturers to focus on long-term customer engagement and value-added services, such as maintenance subscriptions and software updates, to drive sustained growth.
North America Bicycle Industry Leaders
-
Trek Bicycle Corporation
-
Specialized Bicycle Components
-
Giant Manufacturing Co.
-
Accell Group
-
Pon Bike
- *Disclaimer: Major Players sorted in no particular order

Market Opportunities and Future Outlook
Localization and near-shoring create room for contract assembly, painting, and final-mile configuration services that reduce tariff exposure and improve availability for both retail and fleet channels. Recent 2026 activity reflects that shift, with Blaupunkt Americas opening a US e-bike production facility in Asheville, North Carolina, starting at 5,000 units per year. LEV Manufacturing also announced a 100,000-square-foot Tennessee facility in Algood to serve assembly and distribution needs for Rad Power Bikes, Serial 1, and Life EV brands. Together, these investments expand the regional manufacturing and logistics footprint and support opportunities for North American suppliers in frames, electronics integration, packaging, and aftersales parts.
Public funding pipelines and infrastructure-linked procurement also reinforce demand windows. In the United States, the House Committee on Transportation and Infrastructure advanced the BUILD America 250 Act (H.R. 8870) in May 2026 as federal surface transportation programs approach a September 30, 2026 expiration, while the America Bikes Act (H.R. 9041) was introduced to authorize dedicated grant programs for bicycle infrastructure and bicycle-transit integration. In Canada, permanent transit funding beginning in 2026 (CAD 3 billion annually) provides a multi-year anchor for projects that can pull through commuter, folding, and shared or fleet e-bikes as agencies and operators procure on budgeted replacement cycles rather than discretionary household timing.
Recent Industry Developments
- May 2026: LEV Manufacturing announced a new 100,000-square-foot facility in Algood, Tennessee, backed by a USD 7 million investment, to support assembly and distribution for Rad Power Bikes, Serial 1, and Life EV brands. The site strengthens regional fulfillment and service readiness for e-bikes by shifting more final assembly and logistics closer to North American demand centers.
- May 2025: Veo launched a dockless shared cargo e-bike in North America, adding throttle assist, front and rear baskets, and IoT connectivity with up to a 100 lb carrying capacity. The launch expands the addressable micromobility use case beyond passenger trips into light cargo and delivery, increasing fleet-oriented procurement opportunities for connected e-bikes.
- September 2024: Devinci Troy introduced updated mountain bikes featuring a fifth-generation aluminum frame with straighter tubing, internal cable routing, and a 150 mm rear travel setup paired with a 160 mm fork. The refresh reinforces premiumization in the mountain and all-terrain segment, supporting demand for performance-driven models and dealer service attachment.


Research Methodology Framework and Report Scope
Market Definition and Coverage
For this methodology, the market covers revenue generated from bicycle sales in North America across consumer and institutional purchases, counted at the point where bicycles are sold through offline and online channels.
Scope exclusions: We exclude standalone aftermarket parts, apparel, helmets, service and repair labor, and rentals and sharing fees when they are billed separately from bicycle sales.
Segmentation Overview
-
By Product Type
- Road/City
- Mountain/All-Terrain
- Hybrid
- E-Bicycle
- Other Types
-
By Design
- Regular
- Folding
-
By End User
- Men
- Women
- Kids
-
By Distribution Channel
- Online Retail Stores
- Offline Retail Stores
-
By Geography
- United States
- Canada
- Mexico
- Rest of North America
Data Sources, Market Sizing, and Validation
Desk Research
Desk research was used to set the market boundaries, anchor country level demand drivers, and build a clean set of assumptions before speaking with industry participants. We relied on public sources such as U.S. Census Bureau and Statistics Canada retail and trade releases, U.S. International Trade Commission and customs import data, Bureau of Transportation Statistics updates on mobility trends, and trade association publications such as PeopleForBikes.
We also reviewed company filings, investor presentations, and reputable news coverage to understand pricing moves, channel shifts (offline versus online), and supply conditions. Where needed, paid subscriptions for company financials and intelligence, shipment level import and export data, and patent databases were used to cross-check supplier scale and product activity without overfitting the model. These desk sources are illustrative and not exhaustive, since many other references were used for data collection, validation, and clarification.
Primary Interviews and Surveys
Primary inputs came from interviews and structured surveys with manufacturers, assemblers, distributors, large retailers, specialty bike shops, and selected institutional buyers, which helped us pressure test channel mix and realistic price bands. Coverage was kept balanced across the United States, Canada, and Mexico so assumptions around e-bike adoption, replacement cycles, and inventory normalization could be checked against what participants are seeing right now.
Distribution of primary research fieldwork respondents
| Company type | Respondent position |
|---|---|
| Top tier: 25% | CXOs: 17% |
| Mid tier: 58% | Functional/Unit leaders: 34% |
| Smaller Players: 17% | Managers: 49% |
Market-Sizing & Forecasting
Market sizing was built using a top-down approach where country demand pools are reconstructed from bicycle participation and replacement behavior, and then translated into value using observed price ladders by type and channel. The model is then corroborated with selective bottom-up approximations, such as sampled retail price checks, distributor sell-in patterns, and supplier scale signals, which helps adjust totals when a single indicator looks stretched.
Inputs used (illustrative) included bicycle import volumes and declared values, consumer spending signals for sporting goods, e-bike share within bicycle sales, offline versus online channel splits, and average selling price movement during promotion-heavy and inventory-clearance periods. When some inputs were missing for a country or a category, we filled gaps using proxy ratios from comparable markets and then rechecked them through interviews so the implied volumes and pricing stayed realistic.
For forecasting, scenario analysis was applied around the variables that move the market the most, and then a smoothing method was used to avoid sharp year-to-year jumps unless a clear event supports it. Adoption of e-bikes, policy support for active transportation, and normalization of inventories were treated as key forward drivers, and the final outlook was aligned with what industry respondents consider a practical range for volumes and pricing.
Data Validation & Update Cycle
Outputs were validated through a set of cross-checks, where totals by country, type, and channel were compared against independent signals such as trade data, retailer commentary, and participation trends. Variances were investigated when implied unit volumes or prices drifted away from what interviews and public indicators suggest, followed by a second analyst review before sign-off.
Reports are refreshed annually, and interim updates are triggered when material events occur, such as tariff changes, demand shocks, or major inventory corrections. Before delivery, a fresh pass is done to ensure the latest public releases and any new interview feedback are reflected in assumptions and the final numbers.
Mordor Intelligence's North America Bicycle Market Size Compared Against Other Published Estimates
Published market sizes for bicycles can look far apart because the same words often hide different inclusions, different timing, and different price logic. The year chosen, the treatment of e-bikes, and whether sales are counted at retail or at shipment value are usually the biggest reasons for gaps.
The table below points to a common split in this market, where some estimates fold in services and aftermarket revenue or use global average pricing that does not match North American price bands. Under Mordor Intelligence's scope, the value is tied to bicycle sales across the United States, Canada, Mexico, and the Rest of North America, and it is kept separate from repair labor and standalone accessories, which can otherwise inflate totals in a consumer-led category.
Benchmark comparison
| Source | Market Size | Gaps in Research Methodology |
|---|---|---|
| Mordor Intelligence | USD 10.89 B (2025) | |
| Industry Association A | USD 12.40 B (2025) | This figure appears to include broader cycling revenue, where accessories and service revenue are blended with bicycle sales, and pricing is often taken from reported retail averages without isolating discount-heavy periods. |
| Regional Consultancy B | USD 9.60 B (2025) | This estimate seems to lean on conservative unit assumptions and shipment-led valuation, which can undercount bicycles sold through online channels and can soften the contribution from premium e-bikes in the mix. |
Across the three figures, the spread is mainly explained by what gets counted around the bicycle itself, and by how prices are mapped to mix and channel. By keeping assumptions tied to observable trade and spending signals and then rechecking them with participants, the final market size remains easier to trace back to clear steps and practical inputs.


Key Questions Answered in the Report
How large will North American bicycle sales be by 2031?
The North America bicycles market size is projected to reach USD 16.76 billion by 2031, supported by an 7.44% CAGR.
Which bicycle category is growing fastest after the pandemic?
Hybrid models are forecast to lead with a 7.62% CAGR from 2026-2031 due to their versatility across urban and light-trail conditions.
What share do mountain bikes currently hold?
Mountain/All-Terrain units captured a 35.02% North America bicycles market share in 2025, maintaining segment leadership.
How are infrastructure grants affecting demand?
U.S. and Canadian active-transportation funds create predictable fleet procurement cycles, elevating baseline demand beyond discretionary consumer spending.
Page last updated on:


 Your data is secure and never sold or shared.


