
Biologics CDMO Market Size and Share
Market Overview
| Study Period | 2020 - 2031 |
|---|---|
| Market Size (2026) | USD 27.13 Billion |
| Market Size (2031) | USD 38.29 Billion |
| Growth Rate (2026 - 2031) | 7.14 % |
| Fastest Growing Market | Asia Pacific |
| Largest Market | North America |
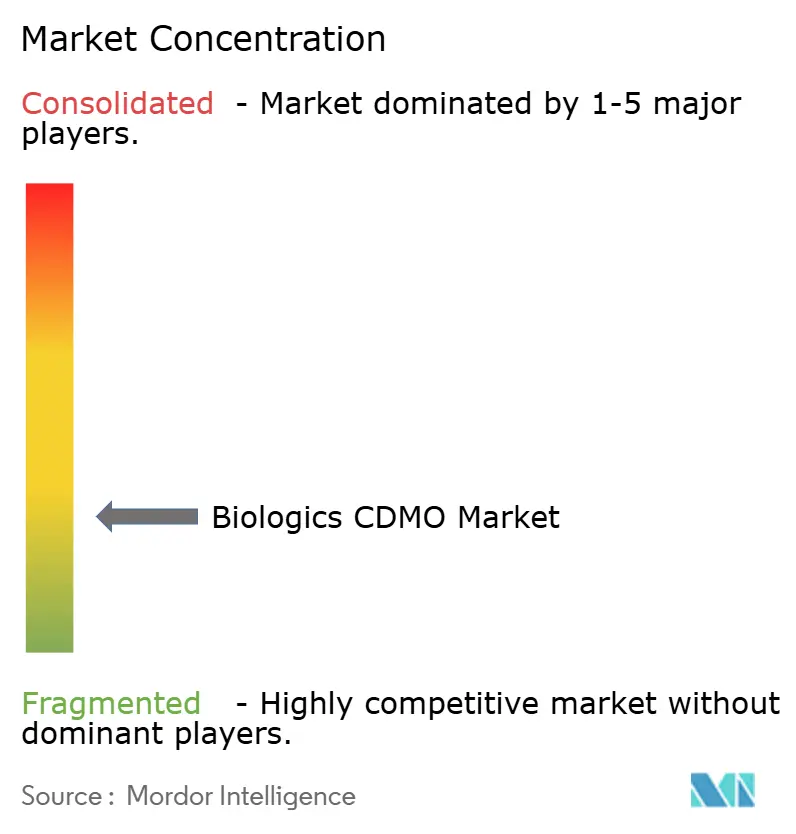
| Market Concentration | Low |
Major Players-Market-ML.webp) *Disclaimer: Major Players sorted in no particular order Image © Mordor Intelligence. Reuse requires attribution under CC BY 4.0. | |
Biologics CDMO Market Analysis by Mordor Intelligence
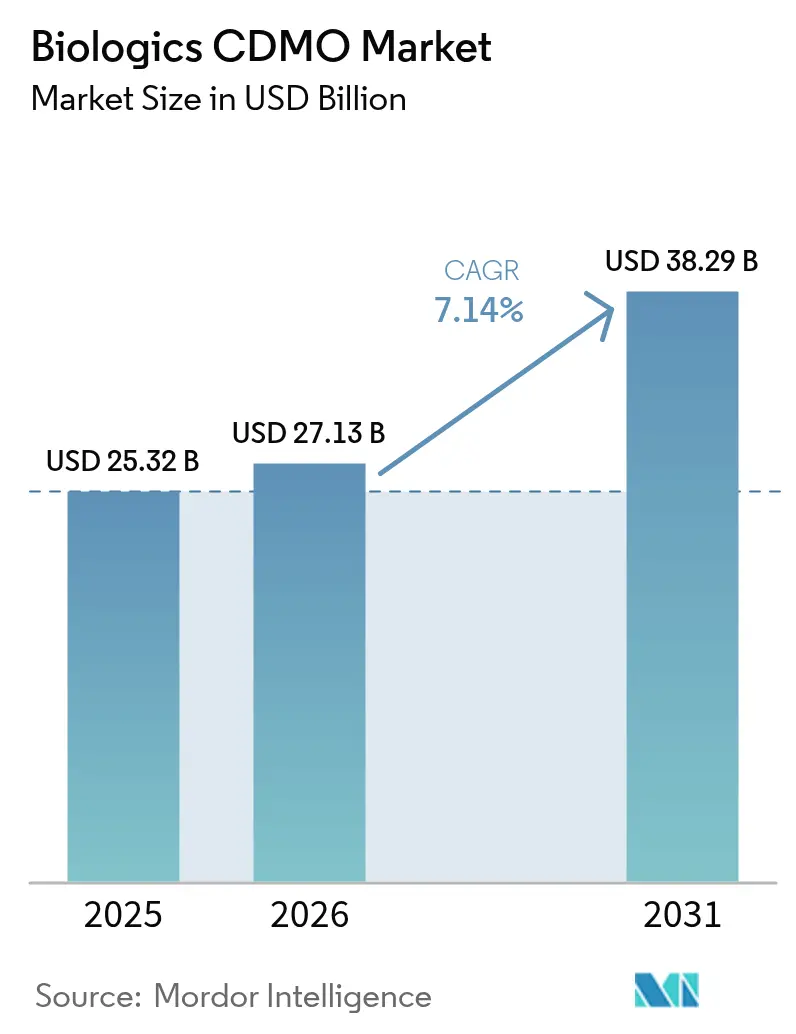
The biologics CDMO market size was valued at USD 25.32 billion in 2025 and estimated to grow from USD 27.13 billion in 2026 to reach USD 38.29 billion by 2031, at a CAGR of 7.14% during the forecast period (2026-2031). Robust demand for outsourced capacity, rising complexity of next-generation therapeutics, and mounting capital requirements for in-house facilities continue to steer sponsors toward specialized partners. Uptake of continuous manufacturing and single-use technologies is lifting operational agility, while full-service providers are broadening analytical, regulatory, and fill-finish offerings to capture a larger share of the biologics CDMO market. Expansionary moves—such as Samsung Biologics’ 2024 achievement of full utilization across 362,000 L of bioreactors and Lonza’s USD 1.2 billion acquisition of Genentech’s Vacaville plant—signal tightening global capacity and intensifying competition. Regional dynamics add another growth layer: North America leads on revenue, but Asia-Pacific is posting the fastest gains thanks to pro-manufacturing policy incentives in China, South Korea, and India.
Key Report Takeaways
- By service type, fill-finish and packaging led with 34.96% biologics CDMO market share in 2025; analytical and QC services are projected to expand at a 12.24% CAGR through 2031.
- By type , mammalian systems held 61.68% of biologics CDMO market size in 2025; microbial systems are forecast to grow at an 8.22% CAGR.
- By product Type, biologics commanded 67.55% revenue share in 2025, while biosimilars are advancing at a 8.72% CAGR to 2031.
- By scale, commercial manufacturing accounted for 55.12% of biologics CDMO market size in 2025; pre-clinical and clinical production is rising at an 8.19% CAGR.
- By end-user, large pharma controlled 55.79% share in 2025; SME biotech is set to expand at an 8.36% CAGR through 2031.
- By geography, North America controlled 34.12% share in 2025; Asia-Pacific is set to expand at an 10.48% CAGR through 2031.
Note: Market size and forecast figures in this report are generated using Mordor Intelligence’s proprietary estimation framework, updated with the latest available data and insights as of 2026.
Market Trends and Insights
Drivers Impact Analysis of Biologics CDMO Market*
| Driver | (~) % Impact on CAGR Forecast | Geographic Relevance | Impact Timeline |
|---|---|---|---|
| Aging population & chronic-disease pipeline | +2.1% | North America, Europe | Long term (≥ 4 years) |
| Capital-intensive biologics innovation | +1.8% | Global (SME focus US/EU) | Medium term (2-4 years) |
| SME biotech shift to asset-light CDMO models | +1.5% | North America, EU, APAC | Medium term (2-4 years) |
| Continuous bioprocessing uptake | +1.2% | US, Western Europe | Long term (≥ 4 years) |
| Single-use manufacturing adoption | +0.9% | Developed markets | Short term (≤ 2 years) |
| Cell & gene therapy spill-over | +0.8% | US, EU, China, Japan | Long term (≥ 4 years) |
| Source: Mordor Intelligence | |||
Aging population and chronic-disease pipeline expansion
Rising life expectancy is sharply increasing the prevalence of oncology, autoimmune, and metabolic disorders, driving long-run demand for advanced biologics. The global population aged 60+ will double to 2.1 billion by 2050, putting consistent pressure on healthcare systems and triggering accelerated therapeutic innovation. [1]Ageing and Health Fact Sheet, WHO, who.intNovo Nordisk’s USD 4.1 billion US fill-finish project highlights sponsor moves to ensure secure supply for high-volume injectables that serve older cohorts. CDMO alliances allow innovators to compress launch timelines and mitigate capital exposure, reinforcing steady growth of the biologics CDMO market.
Capital-intensive biologics innovation driving outsourcing
State-of-the-art antibody-drug conjugate or multispecific antibody plants can cost in excess of USD 1 billion. Such outlays strain sponsor balance sheets, encouraging transfer of manufacturing risk to partners offering GMP-compliant capacity at scale. Samsung Biologics secured USD 13 billion in long-term production contracts with 16 of the top 20 pharma firms by providing turnkey capability without client capex. Ongoing material cost inflation, especially for single-use equipment, further tilts economic logic toward outsourcing.
SME biotech preference for asset-light CDMO partnerships
Venture investors increasingly favor developers that allocate capital to pipeline advancement instead of bricks and mortar. Biotechs leveraging CDMOs cut average time-to-market by 40% versus peers that pursue internal manufacturing. The USD 925 million WuXi Biologics–Candid Therapeutics deal illustrates how integrated CDMO platforms accelerate complex programs, a dynamic that feeds sustained expansion of the biologics CDMO market.
Continuous bioprocessing accelerates flexible capacity
Regulatory clarity via ICH Q13 in 2024 spurred broader industry adoption of continuous manufacturing. FUJIFILM Diosynth’s MaruX platform routinely delivers 15 kg of purified monoclonal antibody in a 30-day run—halving cycle time relative to traditional batch production. [2]MaruX™ Platform Note, FUJIFILM Diosynth, fujifilmdiosynth.comAlthough penetration sits near 15% of global green-field projects, the efficiency upside positions continuous processing as a medium-term catalyst for the biologics CDMO market.
Restraints Impact Analysis of Biologics CDMO Market*
| Restraint | (~) % Impact on CAGR Forecast | Geographic Relevance | Impact Timeline |
|---|---|---|---|
| Evolving global GMP & comparability standards | -1.4% | US, EU | Medium term (2-4 years) |
| Persistent capacity bottlenecks | -1.1% | Specialized modalities | Short term (≤ 2 years) |
| Captive facility expansion by big pharma | -0.8% | North America, Europe | Medium term (2-4 years) |
| Resin & single-use supply fragility | -0.6% | Global | Short term (≤ 2 years) |
| Source: Mordor Intelligence | |||
Evolving global GMP and comparability requirements
New FDA guidance on batch uniformity and updated EU legislation are escalating validation and documentation workloads, requiring CDMOs to devote 12-15% of revenue to quality assurance, well above traditional pharma norms. Heightened scrutiny around biosimilar comparability can prolong project timelines, tempering near-term momentum of the biologics CDMO market.
Persistent capacity bottlenecks lengthen lead-times
BIO reported that average CDMO lead times rose 25-30% in 2024, a drag on program initiation especially for antibody-drug conjugates. [3]BIO Capacity Analysis 2024, BIO, bio.org Raw-material shortages affected 40% of facilities, underscoring the need for multi-sourcing and inventory buffers. [4]NIST Supply-Chain Study 2024, NIST, nist.gov
*Our forecasts treat driver/restraint impacts as directional, not additive. The impact forecasts reflect baseline growth, mix effects, and variable interactions.
Biologics CDMO Market Segment Analysis
By Service Type:
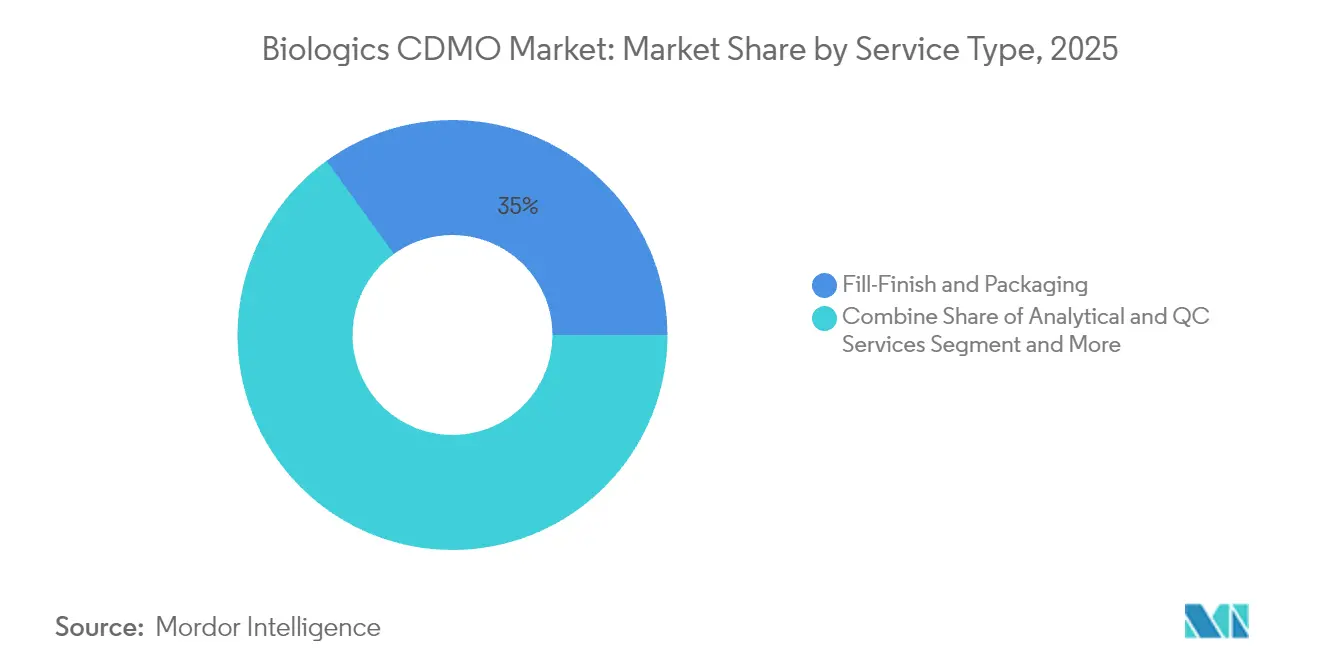
Fill-Finish Dominance Drives Integrated SolutionsFill-finish and packaging services captured 34.96% biologics CDMO market share in 2025, underlining the sterility and regulatory stakes of final drug-product preparation. Growth is reinforced by big-ticket investments such as Lonza’s CHF 500 million Swiss facility. Parallel demand for robust release testing is accelerating analytical and QC uptake, which is projected to post a 12.24% CAGR through 2031.
Integrated developers increasingly bundle process development, GMP production, analytical, and regulatory support to minimize hand-offs. Eurofins BioPharma’s network of 45 GMP labs exemplifies the trend toward geographically diversified, full-scope testing that shortens release cycles. This integrative model embeds stickier relationships and positions suppliers to harvest incremental share of the biologics CDMO market.



By Type:
Mammalian Systems Lead Amid Microbial ExpansionMammalian platforms generated 61.68% of biologics CDMO market size in 2025, reflecting their necessity for monoclonal antibodies and other glycosylation-dependent drugs. Samsung’s scale-up to 784,000 L underscores continued investment in high-titer CHO production.
Microbial systems are advancing on an 8.22% CAGR tailwind owing to simplified process trains and cost advantages. Thermo Fisher’s single-use fermentors reduce contamination risk and shorten turnovers, broadening microbial applicability to peptide and oligonucleotide therapeutics. The resulting flexibility attracts emerging sponsors seeking economical early-stage production.
By Product Type:
Biologics Maintain Leadership Amid Biosimilar UptickInnovator biologics remained the mainstay at 67.55% of 2025 revenue, buoyed by a vibrant pipeline of antibody-drug conjugates, multispecific antibodies, and RNA-based constructs. Samsung’s S-AfucHO and S-OptiCharge platforms target improved efficacy and downstream yields, fortifying competitive position.
Biosimilars, while smaller, are gaining velocity at 8.72% CAGR as payers push affordability and patents expire. Streamlined EMA pathways introduced in 2024 lower entry barriers, prompting established CDMOs to launch dedicated biosimilar suites to win contracts from cost-sensitive sponsors.
By Scale:
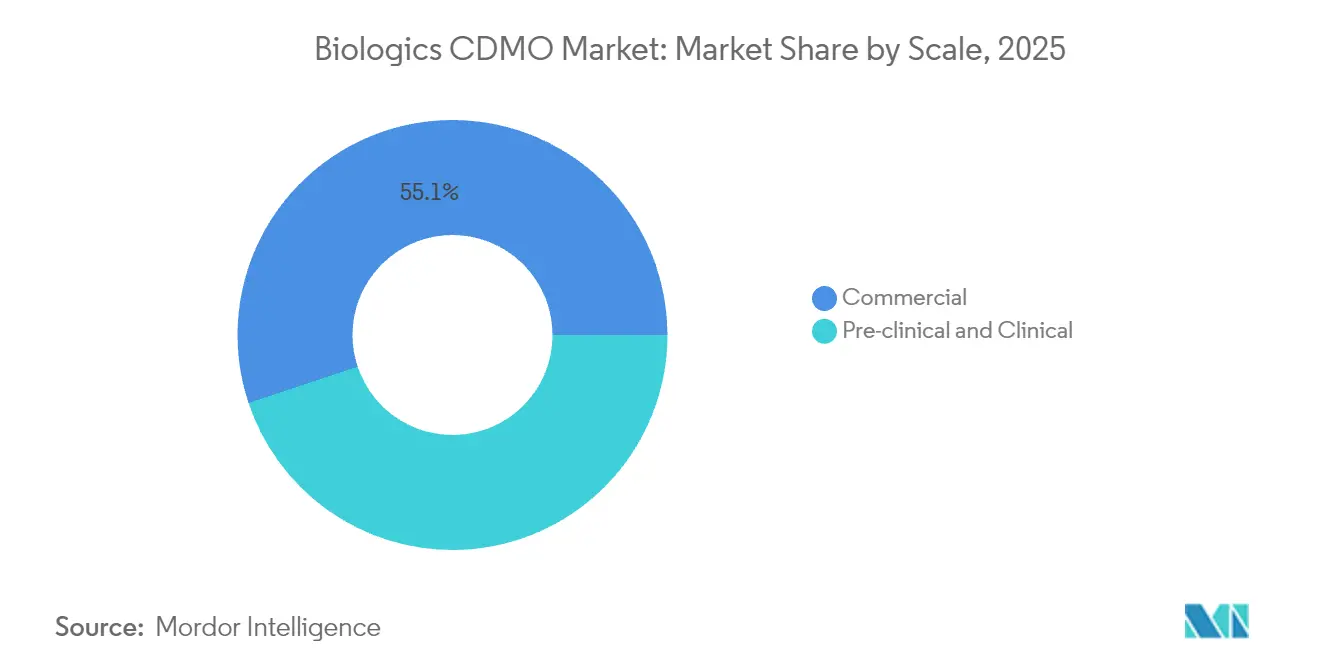
Commercial Manufacturing Commands Majority ShareCommercial lots accounted for 55.12% of biologics CDMO market size in 2025, mirroring portfolio maturation of launched therapeutics. Mega-plants exceeding 10,000 L remain critical for blockbuster antibodies and high-volume insulin analogs.
Clinical and pre-clinical projects are rising steadily on an 8.19% CAGR, fueled by a record 25% jump in 2024 IND filings for biologics. Flexible multi-product suites with rapid changeover capability are therefore a pivotal differentiator for CDMOs courting pipeline-heavy biotech clients.
By End-user:
Large Pharma Dominance Balanced by SME MomentumLarge pharmaceutical firms utilized CDMOs for 55.79% of outsourced spend in 2025, leveraging long-term contracts to secure redundant supply while divesting non-core assets such as Roche’s Vacaville site.
SME biotechs, expanding at an 8.36% CAGR, increasingly rely on end-to-end CRDMO platforms to bridge expertise gaps and improve capital efficiency. Their growth ensures a steady influx of early-stage work that underpins long-run expansion of the biologics CDMO market.
Geography Analysis
North America Biologics CDMO Market
North America retained leadership with 34.12% of 2025 revenue, propelled by dense innovation ecosystems and regulatory support for advanced manufacturing. FDA guidance on continuous processing and expedited review pathways fosters early adoption curves that benefit local CDMOs. Large-scale investments such as Novo Nordisk’s USD 4.1 billion North Carolina plant reinforce the region’s installed base.
Europe Biologics CDMO Market
Europe offers a sophisticated framework dominated by Germany, the United Kingdom, and Switzerland. Lonza’s CHF 500 million fill-finish hub in Stein exemplifies the continent’s specialized, high-margin focus. Updated EMA biologics guidelines simplify technology transfers and sustain steady inflows of both domestic and trans-Atlantic work. Emerging projects such as Biosynth’s German bioconjugation expansion underscore persistent demand for niche expertise.
APAC Biologics CDMO Market
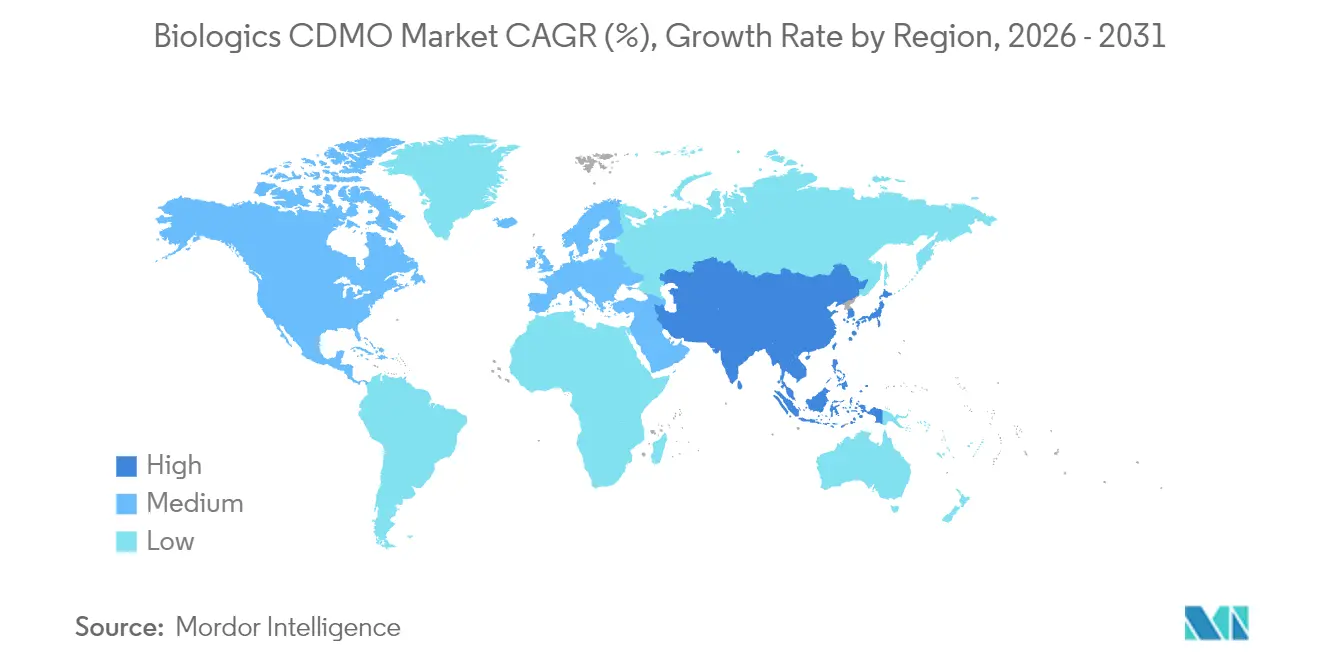
Asia-Pacific is the growth engine, set to post a 10.48% CAGR through 2031 on the back of aggressive capacity builds and public-sector incentives. Samsung Biologics’ expansion to 784,000 L and SK pharmteco’s USD 260 million Sejong project typify South Korea’s strategy to become a global biologics powerhouse. China’s streamlined NMPA approval procedures and India’s infrastructure grants are equally pivotal in channeling sponsor projects into the region.

Regulatory Landscape
Global biologics CDMO operations are shaped by stringent GMP expectations, with regulators increasingly stressing documented oversight of outsourced activities through written quality agreements and data integrity controls. In the United States, FDA compliance expectations for CDER-regulated biological products continue to reinforce sponsor accountability for contract manufacturing performance, including inspection readiness across drug substance, drug product, and associated packaging and testing operations.
In Europe, EMA continues to update and clarify guidance for qualification, validation, and technology transfer for biological manufacturers. In January 2026, EMA released a concept paper to revise GMP Annex 15 (Qualification and Validation), explicitly considering biological active substance manufacturers, with consultation phases running into April 2026, indicating tighter validation and lifecycle change-control expectations for multi-site CDMO networks.
Competitive Landscape
The biologics CDMO market is fragmented. Novo Holdings’ USD 16.5 billion Catalent deal and Lonza’s Vacaville purchase alter global capacity distribution and intensify the fight for large-scale antibody contracts. Samsung Biologics, now running at full utilization, signals that top-tier suppliers hold valuable pricing power supported by differentiated scale.
Technology is the linchpin of competitive edge. FUJIFILM Diosynth’s MaruX continuous line and Lonza’s Ibex bioconjugation suites cater to high-growth modalities, enabling premium service rates. Simultaneously, integrated CRDMO models are surfacing as a preferred one-stop solution for SMEs, creating a bifurcated field where scale leaders and niche specialists coexist.
Strategic collaborations illustrate market dynamism: BioCina’s merger with NovaCina blends microbial, mRNA, and sterile fill-finish capabilities to form a vertically integrated challenger. Such moves highlight sustained competition for wallet share across every stage of the biologics CDMO market value chain.
Biologics CDMO Industry Leaders
Boehringer Ingelheim Group
Wuxi Biologics (Cayman) Inc.
Samsung Biologics
Lonza Group Ltd
Fujifilm Diosynth Biotechnologies USA Inc.
- *Disclaimer: Major Players sorted in no particular order
Biologics CDMO Market Companies Covered in this Report
- Lonza Group
- Samsung Biologics
- WuXi Biologics
- Boehringer Ingelheim BioXcellence
- Catalent
- Fujifilm Diosynth Biotechnologies
- AGC Biologics
- Thermo Fisher Scientific (Patheon)
- AbbVie Contract Manufacturing
- Rentschler Biopharma
- Celonic
- Binex
- Sandoz
- Parexel
- ICON plc
- Recipharm – Arranta Bio
- Toyobo
- Emergent BioSolutions CDMO
- Porton Biologics
- Just-Evotec Biologics
- Grifols Contract Manufacturing

Market Opportunities and Future Outlook
Capital is flowing into sterile drug product capacity and integrated drug-device and packaging-adjacent services, which creates room for CDMOs that can pair aseptic fill-finish with high-complexity assembly, labeling, and serialization under a single quality system. In April 2026, PCI Pharma Services announced an investment program exceeding USD 1 billion to expand US and European sterile fill-finish and drug-device combination capabilities (including autoinjector lines), supporting sponsor demand for end-to-end delivery formats that reduce handoffs later in the supply chain.
Capacity build plans are also narrowing toward specific geographies and modalities. In March 2026, Celltrion disclosed a KRW 1.2 trillion (USD 805 million) expansion plan for its Incheon campus, including drug product additions, while Bora Biologics expanded US commercial single-use drug substance manufacturing capacity to 20,000 liters across two FDA-registered sites after integrating a Rockville, Maryland facility (July 2026). Together, these moves point to demand for CDMOs that can support rapid single-use scale-up for biologics and provide regulatory-ready global supply pathways for commercial launches.
Recent Industry Developments in Biologics CDMO Market
- June 2026: WuXi Biologics reported that its MFG2, DP1, and Drug Product Packaging Center (DPPC) received GMP certification from Brazil's ANVISA to support manufacturing of an anti-PD-L1 monoclonal antibody. The certification strengthens WuXi Biologics' ability to supply commercial biologics into regulated Latin American markets and reinforces the role of packaging centers as part of an integrated DS-to-DP offering.
- May 2026: WuXi Biologics announced that DP15 at its Shanghai Fengxian site achieved GMP release in April 2026, marking the 18th operational drug product facility in its global network. The milestone increases available GMP drug product throughput and supports sponsors seeking larger, multi-facility networks for launch and lifecycle supply continuity.
- November 2024: Avid Bioservices accepted a USD 1.1 billion take-private offer from GHO Capital Partners and Ampersand Capital Partners. The transaction highlighted ongoing investor focus on scalable biologics manufacturing platforms and the strategic value of established GMP capacity for sponsors dealing with longer CDMO lead times.


Biologics CDMO Market Report Scope and Research Methodology
Market Definition and Coverage
For this study, the biologics CDMO market covers third party services used to develop, scale up, and manufacture biologic drug substance and drug product for clinical and commercial supply, including related analytical and release support that is tied to that work.
Scope exclusions: We exclude in house captive manufacturing done only for a companys own pipeline, along with non biologic small molecule outsourcing that does not support a biologic program.
Segments Covered in This Report
- By Service Type
- Process Development
- GMP Manufacturing
- Fill-Finish and Packaging
- Analytical and QC Services
- Other Service Type
- By Type
- Mammalian
- Microbial
- By Product Type
- Biologics
- Monoclonal Antibodies
- Recombinant Proteins
- Vaccines
- Antisense / Molecular Therapy
- Other Biologics
- Biosimilars
- Biologics
- By Scale
- Pre-clinical and Clinical
- Commercial
- By End-user
- Small / Mid-size Biotech
- Large Pharma
- By Geography
- North America
- United States
- Canada
- Mexico
- Europe
- Germany
- United Kingdom
- France
- Italy
- Spain
- Russia
- Rest of Europe
- Asia-Pacific
- China
- India
- Japan
- South Korea
- Australia and New Zealand
- Rest of Asia-Pacific
- Middle East and Africa
- Middle East
- United Arab Emirates
- Saudi Arabia
- Turkey
- Rest of Middle East
- Africa
- South Africa
- Nigeria
- Egypt
- Rest of Africa
- Middle East
- South America
- Brazil
- Argentina
- Rest of South America
- North America
Data Sources, Market Sizing, and Validation
Desk Research
Desk research started with mapping the outsourced biologics pipeline to manufacturing demand signals, then grounding it with public datasets that are stable over time. We used FDA materials (CBER approvals and biologics license actions), EMA public assessment reports, NIH ClinicalTrials.gov trial volumes, and WHO vaccine and biologics publications to understand activity levels and modality mix.
To pressure test assumptions, we also reviewed USITC and UN Comtrade trade statistics for relevant biologics inputs, along with annual reports, investor presentations, and earnings call transcripts from major outsourced manufacturing users and service providers. When a single company view was not enough, we used paid subscriptions covering company financials and another covering patent and publication activity to organize and compare signals consistently. The sources listed here are illustrative, and many other public documents and datasets were also used for data collection, validation, and clarification.
Primary Interviews and Surveys
Primary work focused on what drives outsourcing decisions in live programs, and what pricing and capacity assumptions look like during day to day contracting. We spoke with a mix of CDMO executives, commercial teams, technical operations leaders, and quality and regulatory specialists across major regions, so we could validate service scope, typical batch sizes, utilization ranges, and the timing from tech transfer to GMP output.
Distribution of primary research fieldwork respondents
| Company type | Respondent position | Region |
|---|---|---|
| Top tier: 30% | CXOs: 16% | APAC: 51% |
| Mid tier: 49% | Functional/Unit leaders: 33% | EMEA: 30% |
| Smaller Players: 21% | Managers: 51% | Americas: 19% |
Market-Sizing & Forecasting
The model starts from a top down build where biologics development and manufacturing demand is reconstructed using observable program activity and production needs, then translated into outsourced service value using realistic penetration rates by stage. We corroborate totals with selective bottom up approximations, such as sampled price per batch or price per gram ranges by modality, along with revenue sanity checks from a representative set of service providers, and then adjust for gaps where disclosure is thin.
Key inputs in the market model included the number of biologic clinical trials by phase, the flow of regulatory approvals for biologics and biosimilars, installed capacity and utilization trends for mammalian and microbial systems, typical batch and campaign patterns for key modalities (such as monoclonal antibodies and vaccines), and the share of work that is outsourced versus kept in house. Forecasts were built using scenario analysis around capacity additions, utilization normalization, and outsourcing intensity, then aligned to expert consensus from interviews. When service lines were bundled in contracts, we split value using consistent allocation rules so development, manufacturing, and related testing were not double counted.
Data Validation & Update Cycle
To validate outputs, we triangulated the model against independent signals like approval counts, trial starts, public capacity announcements, and observed pricing bands, then checked whether implied volumes and utilization stayed within realistic limits. Outliers were reviewed by a second analyst, and assumptions were revisited when variance could not be explained by scope or timing.
The report is refreshed on an annual cycle, with interim updates triggered when there are material events such as major capacity expansions, plant shutdowns, large M&A, or sharp pricing shifts. Before delivery, we do a final data pass and re-contact sources when needed so clients receive the latest updated view.
Mordor Intelligence's Biologics Contract Development and Manufacturing Organization Cdmo Market Size Measured Against Other Published Estimates
Published market sizes for biologics CDMO can vary widely because each publisher draws the line differently on what counts as CDMO work, which year is treated as the base, and how bundled service revenue is handled. Differences also come from currency timing, whether development services are fully included, and how much of the advanced therapy value chain is counted inside the same total.
By tracking approval and trial activity, checking capacity and utilization signals, and refreshing price per batch assumptions annually, Mordor Intelligence keeps the estimate tied to outsourced biologics work that converts into paid CDMO service revenue, instead of broader biologics outsourcing spend that can include adjacent activities.
Benchmark comparison
| Source | Market Size | Gaps in Research Methodology |
|---|---|---|
| Mordor Intelligence | USD 27.13 B (2026) | |
| Industry Research House A | USD 20.70 B (2024) | Uses an earlier base year and a broader biologics outsourcing framing in public commentary, which can mix CDMO revenue with nearby outsourced activities and can understate later capacity led step ups. |
| Trade Publication B | USD 13.40 B (2022) | Anchors the series to a narrower historical window and an earlier pricing environment, and the shorter horizon can miss the uplift from newer capacity ramps and higher value modalities that shift the average realized price. |
The spread across sources is mainly explained by base year choice and what is treated as CDMO revenue versus wider outsourcing spend, followed by how pricing and capacity ramps are updated. Our approach stays traceable to program activity, practical capacity constraints, and service pricing logic, which makes the total easier to replicate and stress test when assumptions change.


Key Questions Answered in the Report
What is the current size of the biologics CDMO market?
The biologics CDMO market is valued at USD 27.13 billion in 2026 and is projected to hit USD 38.29 billion by 2031.
Which service segment holds the largest share?
Fill-finish and packaging services led with 34.96% biologics CDMO market share in 2025.
Which region is growing fastest?
Asia-Pacific is forecast to expand at a 10.48% CAGR through 2031, outpacing all other regions.
Why are SME biotech firms turning to CDMOs?
Asset-light outsourcing lets SMEs cut time-to-market by around 40% and preserve capital for R&D activities.
How is continuous manufacturing affecting CDMO strategies?
Continuous bioprocessing cuts cycle times by up to 50%, prompting CDMOs to invest in new lines that boost flexibility and lower operating costs.
What factors limit market growth?
Evolving global GMP standards, component supply fragility, and rising internal capacity at large pharma companies are key restraints.
Page last updated on:


 Your data is secure and never sold or shared.


