Pyrolysis Oil Market Size and Share
Market Overview
| Study Period | 2025 - 2031 |
|---|---|
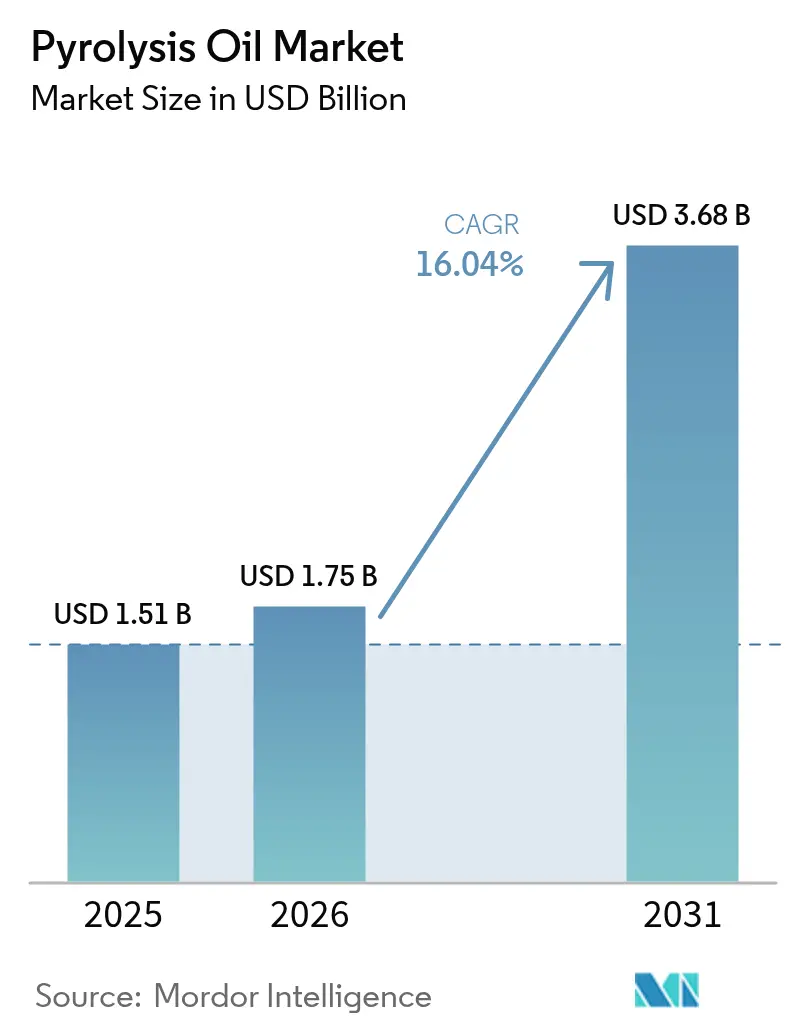
| Market Size (2026) | USD 1.75 Billion |
| Market Size (2031) | USD 3.68 Billion |
| Growth Rate (2026 - 2031) | 16.04% CAGR |
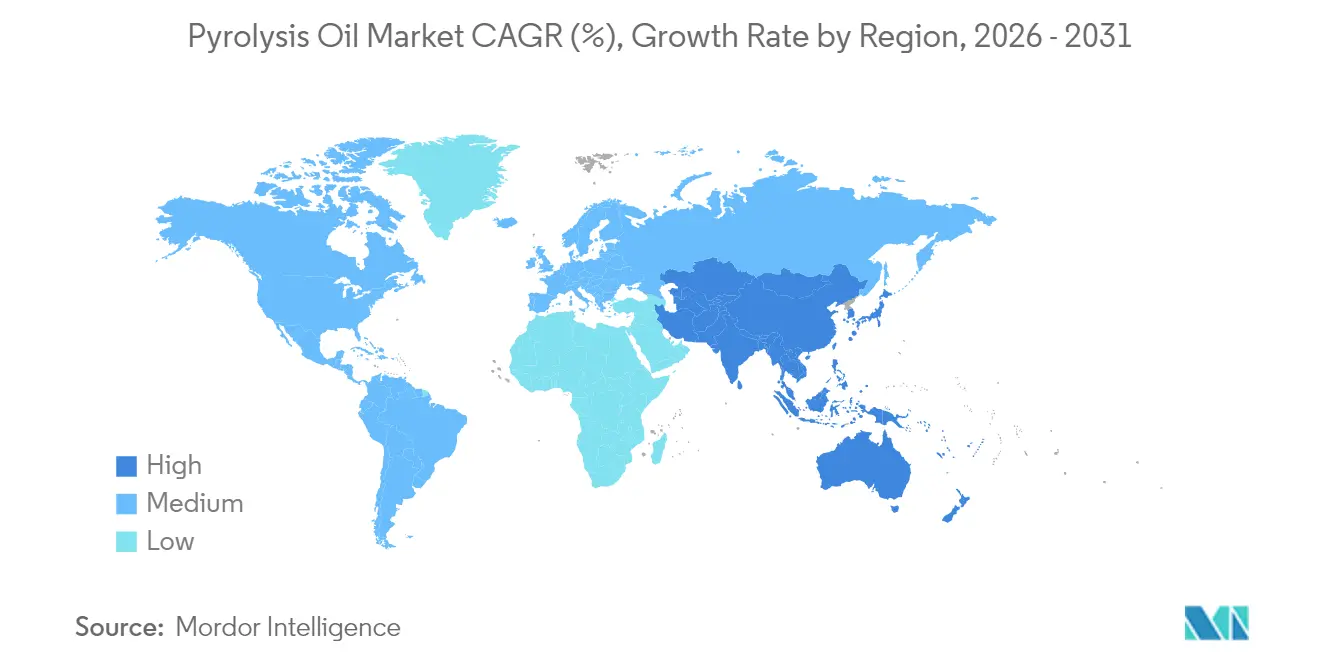
| Fastest Growing Market | Asia Pacific |
| Largest Market | Europe |
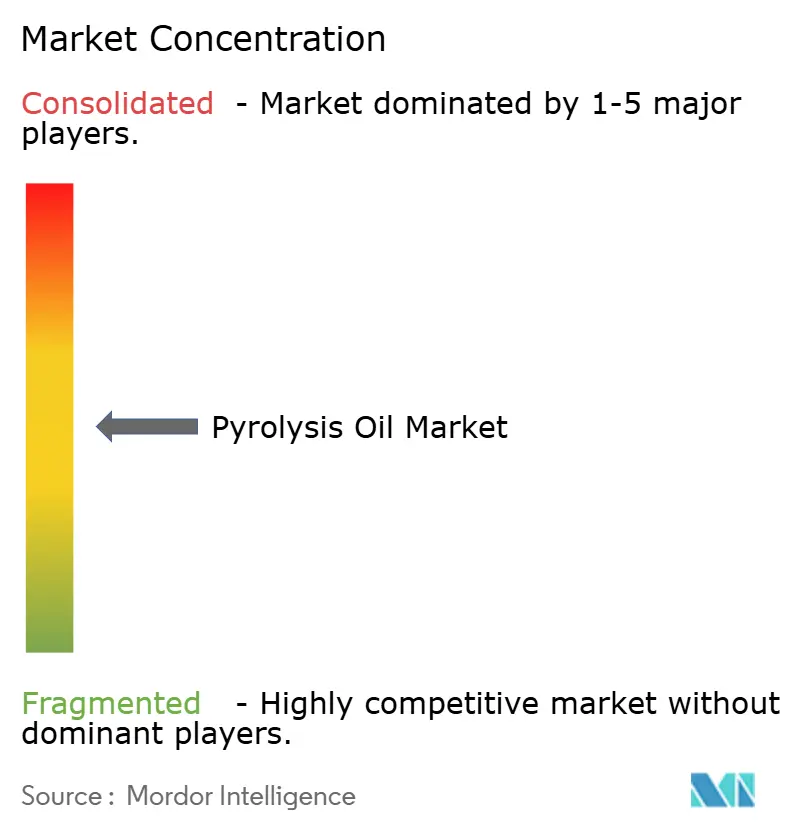
| Market Concentration | Medium |
Major Players *Disclaimer: Major Players sorted in no particular order Image © Mordor Intelligence. Reuse requires attribution under CC BY 4.0. | |
Pyrolysis Oil Market Analysis by Mordor Intelligence
The Pyrolysis Oil Market size is expected to grow from USD 1.51 billion in 2025 to USD 1.75 billion in 2026 and is forecast to reach USD 3.68 billion by 2031 at 16.04% CAGR over 2026-2031. Heightened plastic-waste regulations, circular-economy mandates and refinery co-processing breakthroughs together accelerate demand, while generous carbon-credit schemes improve plant economics. Strategic funding from Europe’s Innovation Fund and Japan’s NEDO program underpins capacity additions that shift the competitive balance toward regions with supportive policy ecosystems. Producers pursue vertical integration with refiners to reduce capital outlays and secure guaranteed offtake, and technology licensors are racing to commercialize microwave-assisted or supercritical routes that improve yield and cut emissions. At the same time, contaminant management, particularly for polycyclic aromatic hydrocarbons, remains the key operational hurdle as specification-driven customers tighten acceptance limits.
Key Report Takeaways
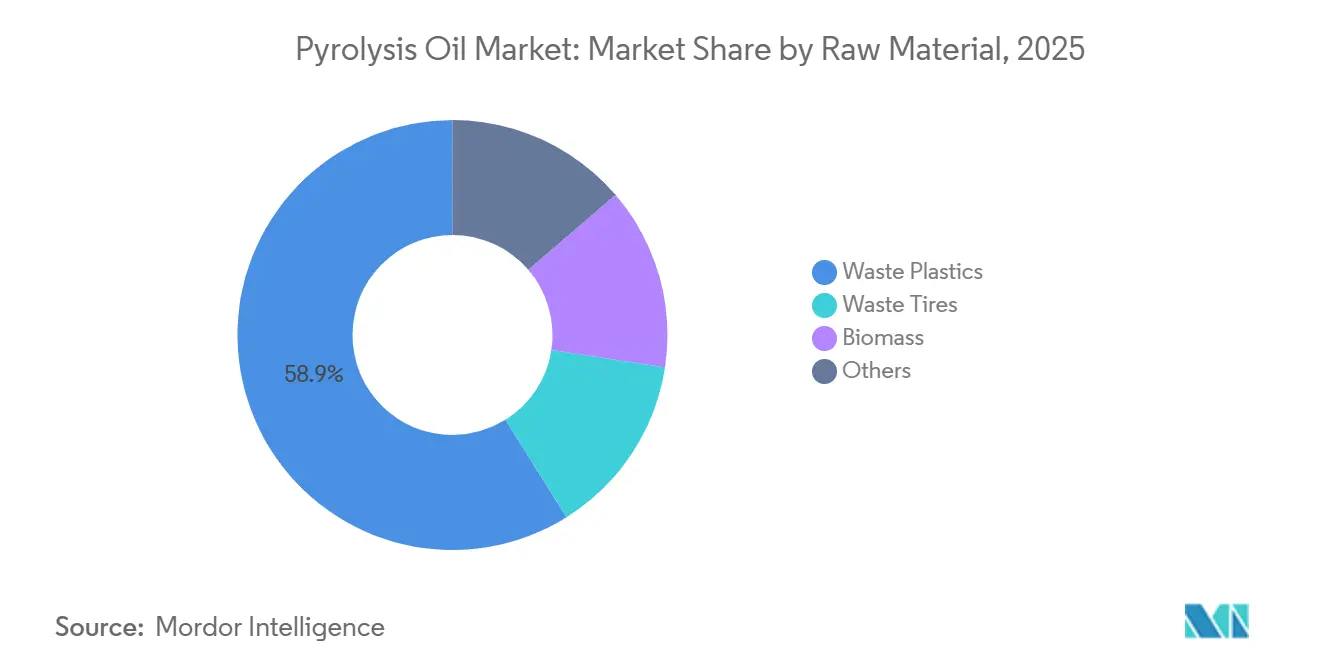
- By raw material, waste plastics captured 58.90% pyrolysis oil market share in 2025 and are expanding at a 16.76% CAGR through 2031.
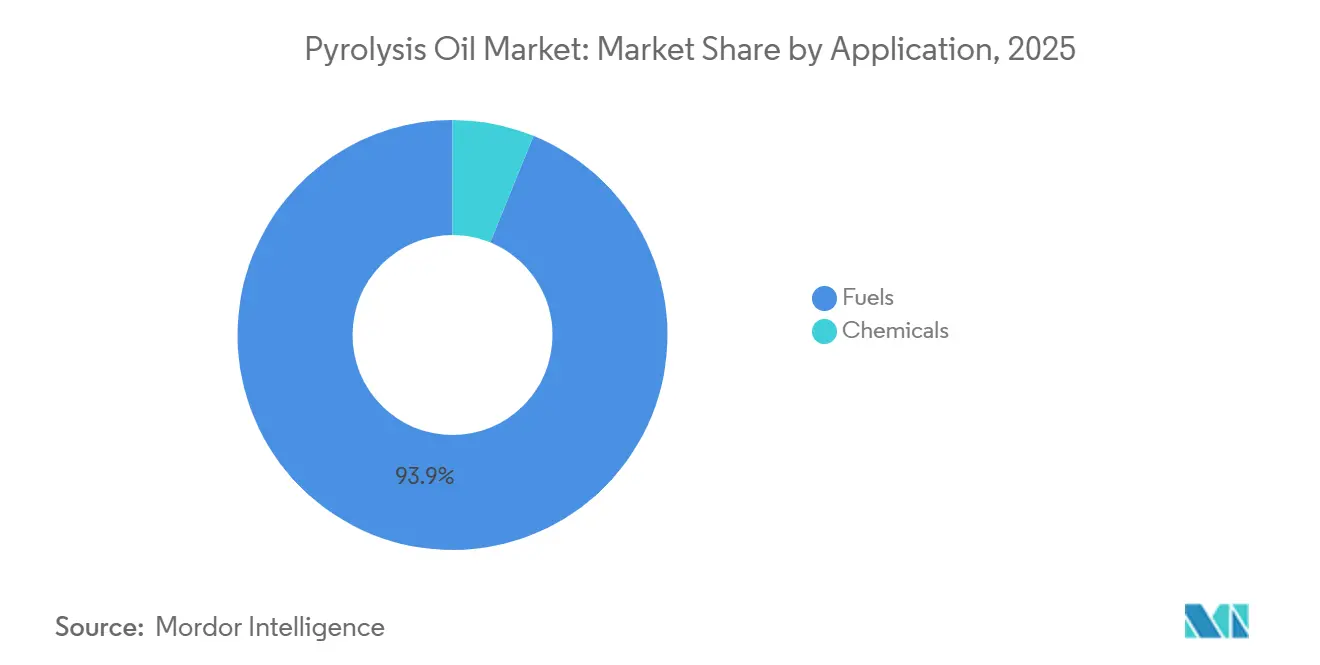
- By application, fuels controlled 93.85% of the pyrolysis oil market size in 2025 and will advance at a 16.22% CAGR through 2031.
- By geography, Europe led with 33.70% revenue share in 2025; Asia-Pacific is poised for the fastest 17.70% CAGR to 2031.
Note: Market size and forecast figures in this report are generated using Mordor Intelligence’s proprietary estimation framework, updated with the latest available data and insights as of 2026.
Global Pyrolysis Oil Market Trends and Insights
Driver Impact Analysis*
| Drivers | (~) % Impact on CAGR Forecast | Geographic Relevance | Impact Timeline |
|---|---|---|---|
| Rising demand for renewable and circular fuel substitutes | +4.2% | Global, with early adoption in EU and California | Medium term (2-4 years) |
| Stricter plastic-waste regulations and bans worldwide | +3.8% | EU, North America, Asia-Pacific core markets | Short term (≤ 2 years) |
| Rising chemical-recycling investment pipelines | +3.1% | North America and EU, spill-over to APAC | Medium term (2-4 years) |
| FCC/hydro-processing co-feeding lowers refinery CAPEX | +2.7% | Global refining hubs, concentrated in Gulf Coast and Rotterdam | Long term (≥ 4 years) |
| Carbon-credit monetisation for low-carbon pyrolysis oil | +2.9% | California, Canada, EU markets with established LCFS frameworks | Short term (≤ 2 years) |
| Source: Mordor Intelligence | |||


Rising Demand for Renewable and Circular Fuel Substitutes
California’s Low Carbon Fuel Standard now targets a 30% carbon-intensity cut by 2030, issuing high-value credits that make waste-derived pyrolysis oil competitive with petroleum inputs[1]California Air Resources Board, “LCFS Data Dashboard,” arb.ca.gov. Canada’s Clean Fuel Regulations set a 15% reduction goal and earmark USD 1.5 billion for domestic production, reinforcing North American demand. In parallel, Japan’s plastics resource-circulation strategy and U.S. sustainable aviation-fuel tax credits position pyrolysis oil as a qualifying feedstock with direct financial upside. Together these measures transform waste oil from an environmental liability into a compliance-grade decarbonization commodity.
Stricter Plastic-Waste Regulations and Bans Worldwide
Europe’s mandate for 100% recyclable packaging by 2030 and China’s push to recycle 4 billion tons of bulk solid waste by 2025 sharply raise demand for processing routes beyond mechanical recycling. Canada’s Federal Plastics Registry, effective September 2025, adds transparent feedstock tracking that favors advanced facilities capable of quality certification. Indonesia’s 30% waste-reduction target further broadens the raw-material pool. These regulatory forces provide predictable long-term feedstock streams and catalyze investments in high-efficiency thermal decomposition.
FCC/Hydro-Processing Co-Feeding Lowers Refinery CAPEX
Shell’s Singapore upgrader integrates pyrolysis oil directly with existing cracking units, sidestepping greenfield plant costs. The global shift toward crude-to-chemical complexes unlocks natural feedstock entry points, while ENEOS and Mitsubishi Chemical demonstrated commercial-scale co-processing via supercritical hydrothermal decomposition in Ibaraki. Such integration extends asset life, maximizes throughput and offers refiners an immediate low-carbon option.
Carbon-Credit Monetization for Low-Carbon Pyrolysis Oil
Under California’s LCFS, credit price escalation clauses tighten benchmarks and raise upside for low-intensity producers. Canada’s framework similarly links credits to hydrogen and advanced biofuels, broadening eligibility[2]Natural Resources Canada, “Policy Ecosystem,” nrcan.gc.ca. Emerging sustainable aviation-fuel pathways register 41-89% emission cuts, further validating waste-oil feedstocks for premium credit generation. Carbon revenue now forms a core line item in project financial models, quickening payback.
Restraint Impact Analysis*
| Restraints | (~) % Impact on CAGR Forecast | Geographic Relevance | Impact Timeline |
|---|---|---|---|
| Corrosivity and instability during storage/transport | -2.8% | Global, with acute challenges in humid climates | Short term (≤ 2 years) |
| High CAPEX and scale-up execution risk | -3.4% | Emerging markets and first-time deployers globally | Medium term (2-4 years) |
| PAH/contaminant concerns triggering regulatory delays | -2.1% | EU and North America with stringent environmental standards | Long term (≥ 4 years) |
| Source: Mordor Intelligence | |||
Corrosivity and Instability During Storage/Transport
Tire-derived oils often contain more than 10% polycyclic aromatic hydrocarbons such as benzo[a]pyrene, requiring stainless or lined tanks and inert-gas blanketing, which inflate logistics costs. Mixed-plastic oils exhibit elevated sulfur, oxygen and chloride levels that foul refinery catalysts unless pre-treated. Ongoing post-production reactions alter viscosity and acidity during long-haul shipment, demanding stabilizers and temperature control. These technical complications restrict cross-border trade and limit standardization, slowing global adoption.
PAH/Contaminant Concerns Triggering Regulatory Delays
EPA regulation 40 CFR 721.10939 sets strict exposure limits for benzene and naphthalene in pyrolyzed products, compelling expensive monitoring and worker-protection protocols. Canada’s decision to list coal tars and related distillates as toxic escalates classification risk for high-aromatic oils. Divergent state-level standards in the U.S. further muddy compliance pathways, causing permitting timelines to lengthen and adding cost buffers to project budgets.
*Our forecasts treat driver/restraint impacts as directional, not additive. The impact forecasts reflect baseline growth, mix effects, and variable interactions.
Segment Analysis
By Raw Material: Waste Plastics Dominate Capacity Build-Out
Waste plastics held 58.90% of the pyrolysis oil market share in 2025, and the segment is tracking a 16.76% CAGR through 2031. The pyrolysis oil market size attributable to waste-plastic feedstock is projected to rise in tandem as global plastic waste exceeds 380 million t y while mechanical recycling stalls below 10% recovery.
Advances in mixed-plastic processing, such as Resonac’s more than or equal to 60% yield technology and synergistic co-pyrolysis of polypropylene with biomass, simplify feed preparation and cut sorting costs. Tire waste, the second-largest input group, benefits from well-organized collection but suffers from higher PAH contamination that commands price discounts. Biomass streams face oxygen-removal challenges that require costly hydrotreatment, limiting immediate scale-up. As regulators tighten chloride and sulfur limits for refinery feed, demand is rising for high-purity plastic oils, creating a premium segment within overall feedstock markets.


By Application: Fuels Retain the Economic Upper Hand
Fuels commanded 93.85% of 2025 revenue and will maintain leadership at a 16.22% CAGR to 2031, keeping the pyrolysis oil market aligned with legacy refinery value chains. Bench trials show HDPE- and PP-derived oils match diesel brake-thermal efficiency, while PS oils trend toward gasoline-range volatility, widening the product slate.
Sustainable aviation fuel is emerging as the fastest-growing subapplication as life-cycle studies report 41-89% emission savings, unlocking federal tax credits and airline offtake agreements. Chemical-grade oil currently represents only 6.85% of demand, yet high-value pathways are multiplying. BioBTX is spending EUR 80 million on a Groningen plant that will convert 20 000 tons per year waste plastic into benzene, toluene and xylene, signaling premium-aromatics potential
Geography Analysis
Europe accounted for 33.70% of global sales in 2025, underpinned by policy clarity and dedicated funding streams. The region hosts LyondellBasell’s 50,000 tons per year Wesseling unit and OMV’s 16,000 tons per year ReOil plant, both demonstrating scalable output with lower carbon footprints versus incineration.
Asia-Pacific is the fastest-growing market at a 17.70% CAGR, fueled by Japan’s NEDO funding, China’s 4 billion-t waste-utilization target and breakthrough projects such as ENEOS-Mitsubishi Chemical’s hydrothermal plant in Ibaraki. Southeast Asia is following suit, with Indonesian partners JGC and Marubeni evaluating modular Pyro-Blue systems to tackle rising marine-plastic inflows.
North America shows accelerating potential through long-term offtake contracts and robust LCFS credit structures. Dow’s supply deal with Freepoint anchors a 180,000 tons per year Arizona complex, and NOVA Chemicals will add 66,000 tons per year of capacity in Ontario using Plastic Energy’s Tacoil process, supporting its 30% recycled content pledge by 2030.

Competitive Landscape
The pyrolysis oil market is moderately fragmented yet trending toward consolidation as petrochemical majors acquire or partner with technology specialists. Technology differentiation is sharpening competitive edges. Lummus-Resynergi microwave reactors promise more than 30% energy savings and rapid modular installation, attracting USD 18 million for pilot clusters. Patent filings reveal focus on continuous hydrocracking and dual-reactor schemes to handle variable feed quality. Licensing revenue streams are rising as independent developers lacking downstream outlets prefer royalty models over greenfield builds, further shaping consolidation trajectories.
Pyrolysis Oil Industry Leaders
Alterra Energy, LLC
BTG Bioliquids (Green Fuel Nordic Oy)
Nexus Circular
Plastic Energy
Viridor Limited
- *Disclaimer: Major Players sorted in no particular order

Recent Industry Developments
- April 2024: Neste completed its first tire-derived pyrolysis oil processing run, producing high-quality chemical feedstock for plastics.
- February 2024: Viridor acquired Quantafuel ASA to accelerate advanced recycling and achieve full circularity across four major plastics by 2025.
- January 2024: New Hope Energy signed a multi-year feedstock deal with TotalEnergies, enabling polypropylene polymer production at La Porte, Texas.


Global Pyrolysis Oil Market Report Scope
Pyrolysis oil is a liquid substance obtained in the pyrolysis process and subsequent cooling, which is a synthetic fuel manufactured as a substitute for petroleum. The product, also known as biocrude or bio-oil, is a complex blend of molecules generally comprising more than 200 different compounds resulting from the depolymerization of products treated in pyrolysis.
The pyrolysis oil market is segmented by raw material, application, and geography. By raw material, the market is segmented into waste plastic, waste rubber, wood, oil sludge, and other raw materials (waste tyres, etc.). By application, the market is segmented into fuels and chemicals. The report also covers the market size and forecasts for the pyrolysis oil market in 27 countries across major regions.
The report offers market size and forecasts for pyrolysis oil in terms of revenue in USD for all the above-mentioned segments.
| Waste Plastics |
| Waste Tires |
| Biomass |
| Others |
| Fuels |
| Chemicals |
| Asia-Pacific | China |
| India | |
| Japan | |
| South Korea | |
| Malaysia | |
| Thailand | |
| Indonesia | |
| Vietnam | |
| Rest of Asia-Pacific | |
| North America | United States |
| Canada | |
| Mexico | |
| Europe | Germany |
| United Kingdom | |
| France | |
| Italy | |
| Spain | |
| Nordic Countries | |
| Turkey | |
| Russia | |
| Rest of Europe | |
| South America | Brazil |
| Argentina | |
| Colombia | |
| Rest of South America | |
| Middle-East and Africa | Saudi Arabia |
| South Africa | |
| Nigeria | |
| Qatar | |
| Egypt | |
| United Arab Emirates | |
| Morocco | |
| Rest of Middle-East and Africa |
| By Raw Material | Waste Plastics | |
| Waste Tires | ||
| Biomass | ||
| Others | ||
| By Application | Fuels | |
| Chemicals | ||
| By Geography | Asia-Pacific | China |
| India | ||
| Japan | ||
| South Korea | ||
| Malaysia | ||
| Thailand | ||
| Indonesia | ||
| Vietnam | ||
| Rest of Asia-Pacific | ||
| North America | United States | |
| Canada | ||
| Mexico | ||
| Europe | Germany | |
| United Kingdom | ||
| France | ||
| Italy | ||
| Spain | ||
| Nordic Countries | ||
| Turkey | ||
| Russia | ||
| Rest of Europe | ||
| South America | Brazil | |
| Argentina | ||
| Colombia | ||
| Rest of South America | ||
| Middle-East and Africa | Saudi Arabia | |
| South Africa | ||
| Nigeria | ||
| Qatar | ||
| Egypt | ||
| United Arab Emirates | ||
| Morocco | ||
| Rest of Middle-East and Africa | ||


Key Questions Answered in the Report
What is the current value of the pyrolysis oil market?
The market stands at USD 1.75 billion in 2026 and is forecast to climb to USD 3.68 billion by 2031.
Which raw material contributes most to pyrolysis oil production?
Waste plastics account for 58.90% of 2025 volume and show the fastest 16.76% CAGR through 2031.
Why are fuels the dominant application?
Established refinery integration allows 93.85% of output to enter fuel streams, offering immediate commercialization with minimal new infrastructure.
Which region is growing fastest?
Asia-Pacific leads with a projected 17.70% CAGR thanks to major Japanese and Chinese funding programs.
How do carbon-credit schemes affect project economics?
Credits from frameworks like California's LCFS can add double-digit return enhancements, shortening payback periods for compliant plants.
What is the main technical hurdle for wide adoption?
Managing PAH contamination and ensuring storage stability remain key challenges that raise operating costs and slow permitting.
Page last updated on:


