Market Overview
| Study Period | 2020 - 2031 |
|---|---|
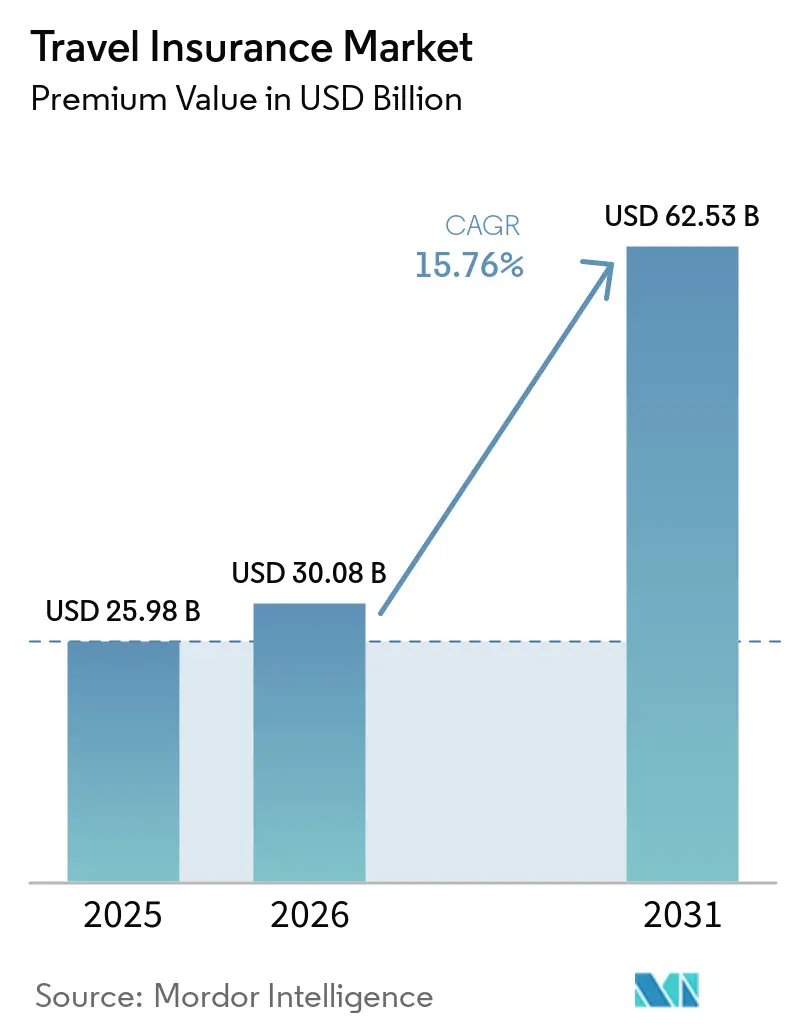
| Market Size (2026) | USD 30.08 Billion |
| Market Size (2031) | USD 62.53 Billion |
| Growth Rate (2026 - 2031) | 15.76% CAGR |
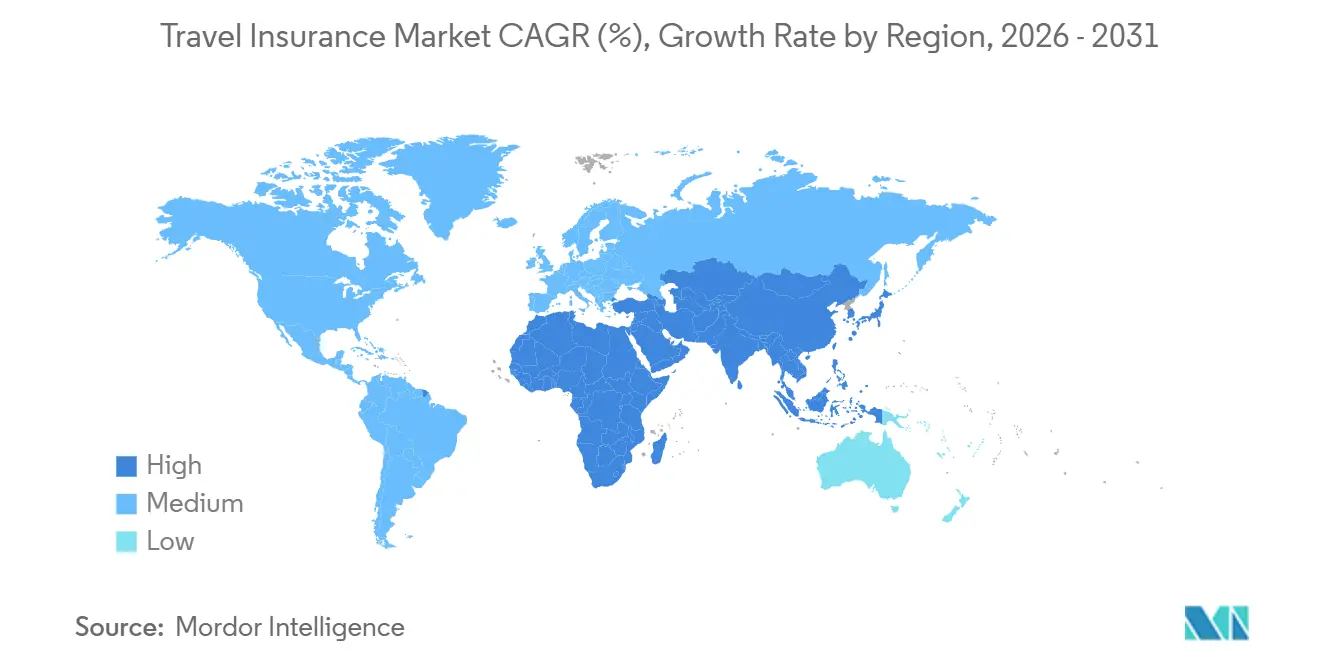
| Fastest Growing Market | Asia Pacific |
| Largest Market | Europe |
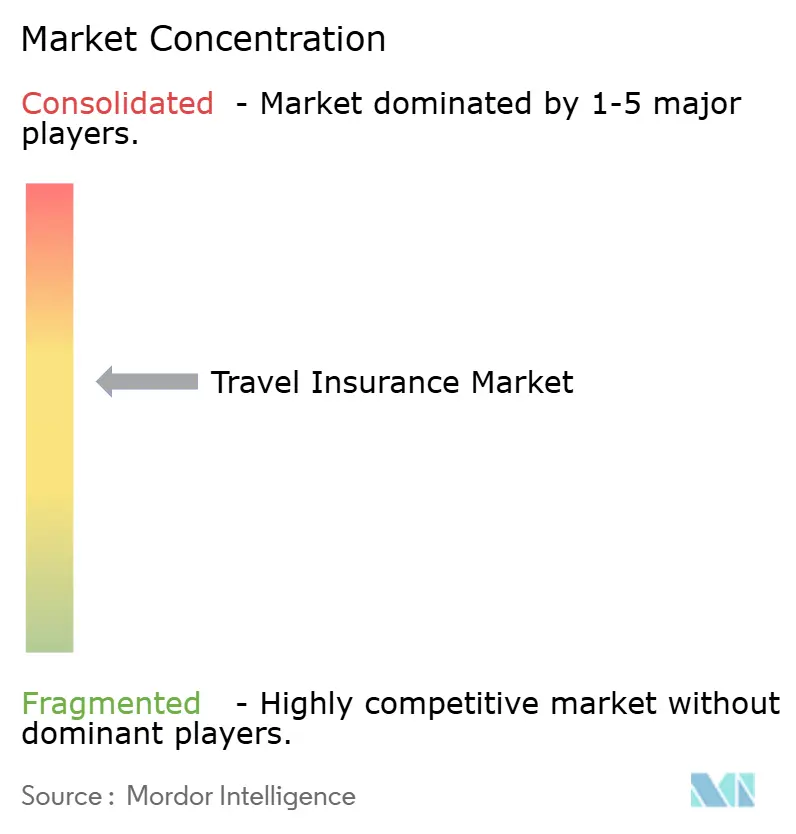
| Market Concentration | Medium |
Major Players *Disclaimer: Major Players sorted in no particular order Image © Mordor Intelligence. Reuse requires attribution under CC BY 4.0. | |
Travel Insurance Market Analysis by Mordor Intelligence
The Travel Insurance Market size in terms of premium value is projected to expand from USD 25.98 billion in 2025 and USD 30.08 billion in 2026 to USD 62.53 billion by 2031, registering a CAGR of 15.76% between 2026 to 2031.
Growth is driven by the strong post-pandemic recovery in international travel, with tourist arrivals surpassing 1.1 billion in the first nine months of 2025, exceeding pre-pandemic levels. Stricter entry requirements and mandatory coverage for visas are boosting baseline demand among outbound travelers. Travelers’ heightened awareness of medical and cancellation risks is further increasing voluntary uptake. Technological innovations, including embedded and parametric insurance products, are improving claims speed and customer satisfaction, encouraging repeat purchases. Asia-Pacific is the fastest-growing region, fueled by a rebound in Chinese outbound travel and record inbound arrivals in Japan, while Europe remains the largest market due to a mature regulatory and distribution framework. Single-trip policies dominate, but long-stay coverage is expanding rapidly to meet the needs of digital nomads and remote workers. Distribution through online aggregators is rising sharply, particularly among younger, tech-savvy travelers who value convenience and AI-driven recommendations. Family and business travel segments are growing, supported by multigenerational packages and corporate travel mandates.
Key Report Takeaways
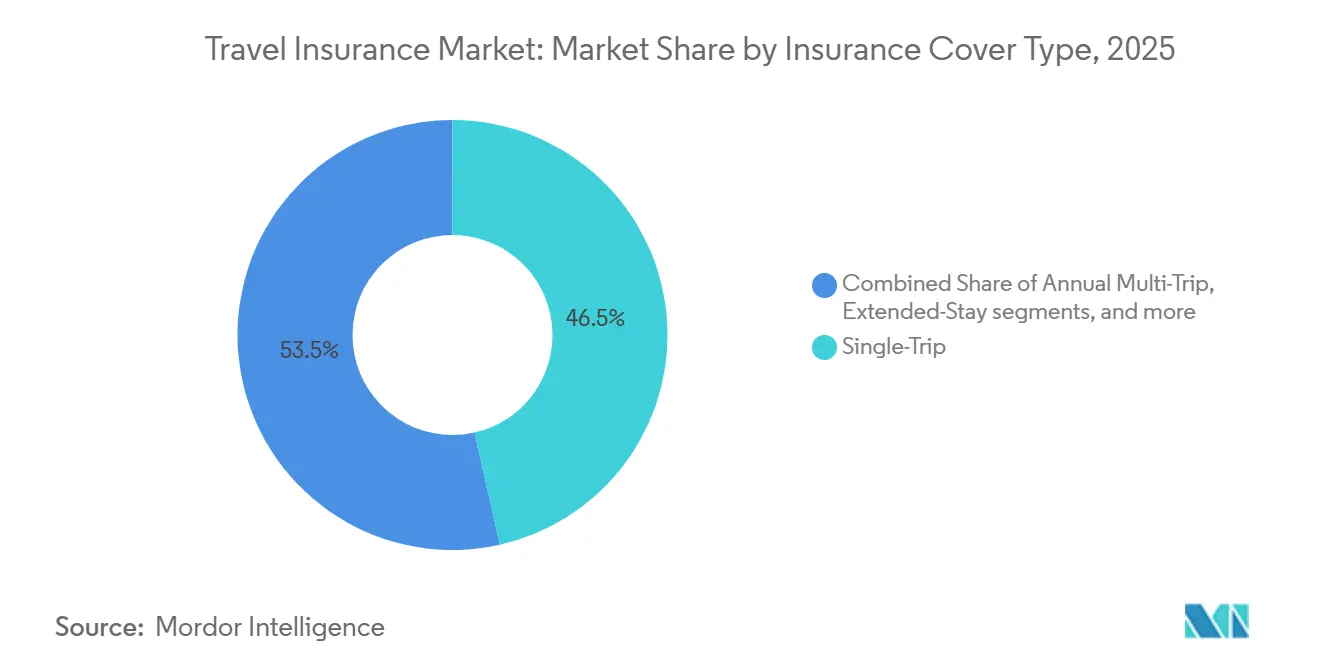
- By insurance cover type, single-trip policies held 46.47% of the travel insurance market share in 2025, while long-stay or extended-stay policies are forecasted to grow at a 19.84% CAGR through 2031.
- By distribution channel, insurance intermediaries held 51.24% of the travel insurance market share in 2025, while online aggregators are projected to record a 21.87% CAGR through 2031.
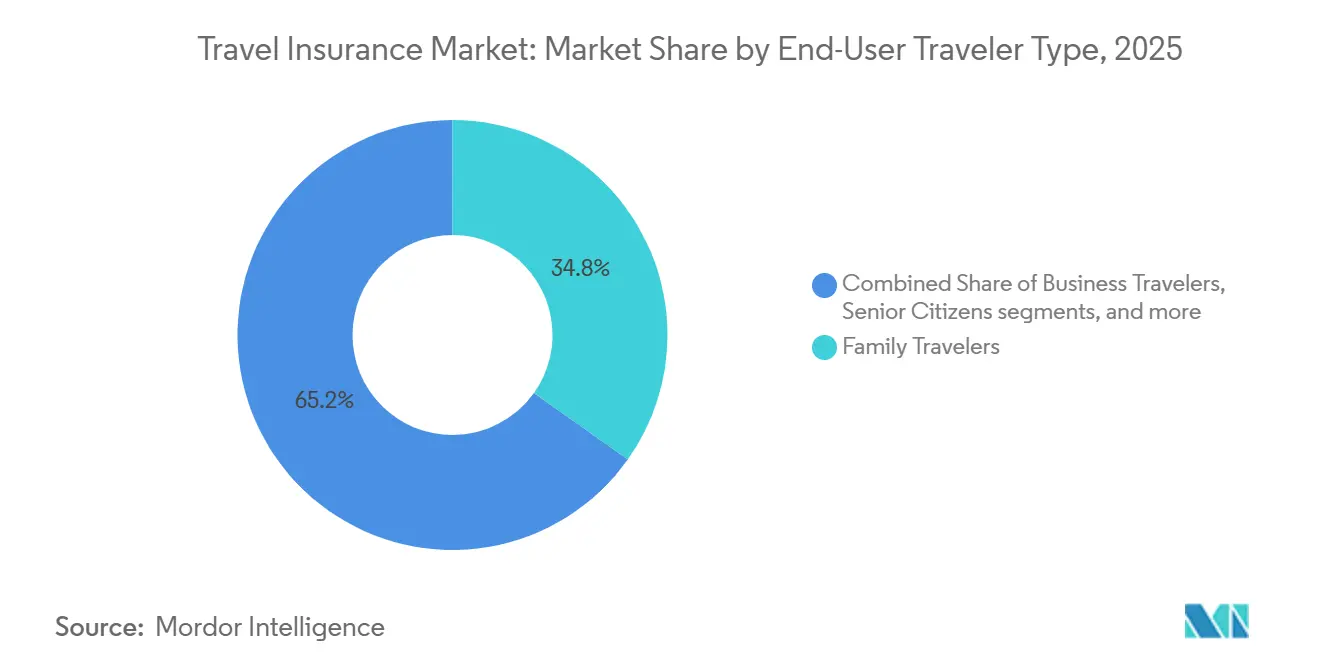
- By end-user, family travelers accounted for 34.84% of the travel insurance market share in 2025, while business travelers are projected to grow at a 23.37% CAGR through 2031.
- By geography, Europe led with 41.87% of the travel insurance market share in 2025, while Asia-Pacific is projected to expand at a 19.37% CAGR to 2031.
Note: Market size and forecast figures in this report are generated using Mordor Intelligence’s proprietary estimation framework, updated with the latest available data and insights as of January 2026.
Global Travel Insurance Market Trends and Insights
Drivers Impact Analysis*
| Driver | (~) % Impact on CAGR Forecast | Geographic Relevance | Impact Timeline |
|---|---|---|---|
| Rising global tourism and increased travel frequency | +4.2% | Global, with spillover gains in the Middle East and Africa | Medium term (2-4 years) |
| Post-pandemic boom in experiential tourism across Asia | +3.8% | Asia core, with spillover to South Korea and India | Short term (≤ 2 years) |
| Mandatory insurance requirements for visas and entry | +3.1% | Schengen Area and selected entry regimes | Long term (≥ 4 years) |
| Technological advancements and digital distribution | +2.9% | North America and Europe lead, scaling across urban APAC and LATAM | Medium term (2-4 years) |
| Parametric flight-delay products scaling in North America | +1.9% | Major U.S. hubs to national reach | Short term (≤ 2 years) |
| Growth of long-stay and multi-trip policies driven by remote work | +2.3% | Global, especially APAC and Europe | Medium term (2-4 years) |
| Source: Mordor Intelligence | |||
Rising Global Tourism and Increased Travel Frequency
International tourism has fully rebounded, carrying strong momentum into the current year, driven by robust cross-border travel and resilient consumer spending in major source markets. This recovery has expanded the base of insured travelers across both leisure and corporate segments. Growing travel volumes align with government projections of continued increases in international arrivals, supporting the broader adoption of travel insurance at the point of booking and through financial services channels. At the same time, elevated load factors and occasional operational constraints are raising the risk of travel disruptions, encouraging more travelers to seek policies that cover delays and interruptions to mitigate financial losses. Similar trends are evident in Asia-Pacific and the Middle East, where infrastructure improvements, resumed flight capacity, and sustained demand are enhancing growth prospects for carriers that tailor benefits to local travel patterns.
Post-Pandemic Boom in Experiential Tourism Across Asia-Pacific
Asia-Pacific tourism is nearing full recovery, with international visitor flows in early 2025 approaching pre-pandemic levels. In 2024, the region welcomed around 648 million international arrivals, reaching nearly 92 % of 2019 levels, while the first half of 2025 alone recorded approximately 296 million arrivals, showing continued growth. The region’s diverse destinations, particularly those offering cultural, natural, and experiential attractions, are drawing strong numbers of international travelers[2]. This growth is supported by expanding air connectivity, affordable travel options through low-cost carriers, and the emergence of new source markets, encouraging travelers to embark on more frequent and multi-destination journeys. The shift toward experiential travel, with varied activities, transfers, and complex itineraries, heightens the risk of disruptions from flight delays to health or logistical challenges, making comprehensive travel insurance increasingly essential. The combination of high travel volumes, complex itineraries, and spontaneous travel patterns is driving steady demand for coverage across distribution channels in the Asia-Pacific region.
Mandatory Insurance Requirements for Visas and Entry
Visa-linked insurance mandates are strengthening baseline demand by establishing minimum medical and assistance coverage requirements for non-resident travelers. For example, regions such as the Schengen Area require proof of medical coverage that meets defined thresholds, prompting many visitors from countries with visa requirements to purchase compliant policies as part of their application process. Upcoming systems for visa-exempt travelers are also expected to increase focus on proper documentation and evidence of coverage during trip planning. These mandates not only raise awareness of the value of insurance at the earliest stages of booking but also encourage the adoption of comprehensive policies that include benefits such as evacuation and repatriation. Inbound travel recovery across major destinations further reinforces a stable baseline for insurance purchases, while the influence of entry rules is evident in online travel aggregator searches, cross-sells through financial institutions, and airline or OTA checkout processes that prompt travelers to secure coverage before completing payment.
Technological Advancements and Digital Distribution
Technological advancements and digital distribution are increasingly shaping the travel insurance market by enhancing product discovery, pricing transparency, and claims experience for policyholders. Online aggregators and marketplaces now offer a wider range of options, including multi‑trip, medical‑only, diaspora, and cruise‑specific coverage, allowing travelers to select benefits that closely match their travel plans and risk preferences. For example, Squaremouth’s launch of a cruise‑focused plan offers tailored protections and flexible upgrades for cruise travelers, showing how product innovation is meeting specific trip needs[3]Squaremouth, “Tin Leg Cruise Product Launch,” squaremouth.com. Embedded protection at airline, OTA, and financial institution checkout points is gaining traction, while innovative parametric products simplify claims with automatic payouts triggered by verifiable events. Younger travelers, particularly from urban centers, are comfortable using AI‑driven guidance that recommends suitable plans and add‑ons based on factors such as destination risk and travel seasonality. Speedy reimbursement through digital wallets and instant payment rails further reduces friction at critical moments, enhancing the overall customer experience.
Restraints Impact Analysis*
| Restraint | (~) % Impact on CAGR Forecast | Geographic Relevance | Impact Timeline |
|---|---|---|---|
| Rising fraudulent claims are pressuring APAC loss ratios | -2.1% | Asia-Pacific with secondary effects in the Middle East and Africa | Medium term (2-4 years) |
| Lack of consumer understanding and perceived value | -1.8% | Global, more acute in North America and some LATAM markets | Long term (≥ 4 years) |
| High cost of comprehensive travel insurance and price sensitivity | -1.3% | National, with pressure on seniors and family travelers | Short term (≤ 2 years) |
| Data privacy rules are hindering cross-border underwriting | -1.0% | EU, Singapore, California, Brazil, with multinational spillovers | Long term (≥ 4 years) |
| Source: Mordor Intelligence | |||
Rising Fraudulent Claims Pressuring APAC Loss Ratios
Fraud risks in Asia-Pacific are evolving toward digital channels, with data showing that online fraud accounts for a larger share of total losses as criminals exploit remote onboarding and cross-border anonymity. The True Cost of Fraud Study indicates that each Singapore dollar lost to fraud imposes a multiplier of 3.95 when operational, legal, and recovery costs are included, which raises the effective break-even premium thresholds for carriers seeking to maintain stable loss ratios[4]LexisNexis Risk Solutions, “True Cost of Fraud Study Asia Pacific,” risk.lexisnexis.com. For insurers active in APAC corridors, this pressure translates into stronger identity verification, device fingerprinting, and behavioral analytics to catch anomalies at the new-account stage, where losses tend to be highest. Parametric triggers for flight delays and weather events help cut opportunistic claims because they rely on independent data sources rather than claimant documentation, which reduces disputes and shortens settlement cycles. Balancing anti-fraud controls with a low-friction customer experience remains critical because high-touch authentication can deter legitimate buyers, especially when purchase windows are short. Over time, the spread of standardized data-sharing and consent frameworks across major markets can improve verification and underwriting precision without slowing sales.
High Cost of Comprehensive Travel Insurance and Price Sensitivity
Comprehensive coverage often prices at 4% to 10% of trip costs, and the resulting premiums can feel heavy for long-haul itineraries that include cruises or multi-country routes. Recent marketplace data show an average premium of USD 311 per policy, or USD 21 per day on a median 15-day trip, which forces some travelers to trade down to medical-only plans that reduce protection scope but align with tighter budgets. Seniors face the steepest curve due to higher expected claims, with average premiums for the oldest travelers running several times those of younger cohorts, which can compress uptake unless value is made clear at purchase[5]Squaremouth, “How Much Does Travel Insurance Cost in 2026,” squaremouth.com. Optional enhancements such as cancel-for-any-reason raise premiums and appeal to risk-averse buyers, but they also heighten price sensitivity among families managing group budgets. Stronger education about medical evacuation, hospitalization costs abroad, and the role of delay and interruption benefits improves perceived value, especially for travelers crossing multiple regions on complex itineraries. As embedded and parametric benefits speed payouts and reduce documentation, satisfaction gains can offset some price concerns by delivering tangible support when disruptions occur.
*Our forecasts treat driver/restraint impacts as directional, not additive. The impact forecasts reflect baseline growth, mix effects, and variable interactions.
Segment Analysis
By Insurance Cover Type: Extended-Stay Policies Redefine Annual Recurrence
Single-trip insurance held 46.47% of the travel insurance market share in 2025, which reflects the continued importance of one-off leisure journeys and family vacations where buyers prefer clear benefits and predictable costs. Long-stay or extended-stay policies are projected to grow at 19.84% through 2031, supported by remote work patterns and traveler profiles that require multi-month medical and assistance coverage across jurisdictions, including Indian professionals on extended overseas assignments. The travel insurance market has responded by modularizing benefits around core medical, delay, interruption, and baggage, which improves price-to-value alignment for buyers who do not need full cancellation protection on every trip. Visa-linked medical minimums in the Schengen Area are shaping product baselines and often lead travelers to select higher limits and evacuation options for added peace of mind. For Indian travelers, extended-stay coverage has gained relevance for student, project, and remote work stays that exceed 90 days, where continuous medical support and multilingual assistance become essential.
Annual multi-trip plans serve frequent flyers who prefer continuous protection with streamlined purchase and claims, and they are increasingly configured with flexible add-ons that can be switched on ahead of each journey. Parametric options for flight delays and defined weather events are now embedded into some multi-trip and single-trip plans, and they unlock instant payments for qualifying disruptions based on verifiable data triggers. The travel insurance industry has also focused on cruise benefits and high-value equipment riders for cameras or laptops, which suit content creators and business travelers with sensitive gear. Indian outbound corridors to Europe, North America, and East Asia are seeing broader plan menus, including medical-only and evacuation-focused options for travelers who already receive some cancellation benefits via bank cards. Over the forecast period, extended-stay and annual products should capture more renewals as travelers internalize the convenience of continuous coverage and a single claims experience for multiple trips.


By Distribution Channel: Aggregators Scale on AI and Transparency
Insurance intermediaries retained a 51.24% share in 2025, supported by long-standing relationships with travel agencies and tour operators that bundle protection into trip packages. Online aggregators are projected to grow at 21.87% through 2031 as buyers use comparison tools to parse limits and exclusions across dozens of plan variants, and as checkout flows improve with clearer default options. Marketplace activity shows expansion in multi-trip and cruise-specific products, which allows travelers to right-size benefits to the journey and avoid overpaying for unused coverage elements. Younger demographics, including Indian millennials and Gen Z, expect AI guidance for plan selection and faster claims via digital wallets, which drives more shopping and conversions on mobile-first interfaces. In parallel, parametric products are becoming easier to integrate into airline and OTA workflows, and they deliver straightforward benefits that align with how travelers experience disruptions.
Regulatory environments influence channel economics and compliance, which is visible in state and national frameworks that govern licensing and sales practices. In the United States, evolving state-level rules interact with the NAIC model, while New York’s 2025 action offers a view of how large markets are calibrating policy oversight for travel coverage. India’s DPDP Act drives consent and localization requirements that shape how aggregators collect and process personal data, which has implications for personalization and underwriting in cross-border plans. For Indian consumers, banks and payment apps remain important touchpoints where embedded offers surface during trip planning, and airlines often position coverage alongside seat selection and baggage add-ons. Over time, open data frameworks and consent-based sharing in major markets may further lower search costs and support more competitive pricing in the travel insurance market for digital buyers.
By End-User/Traveler Type: Business Hybrid Fuels Growth
Family travelers accounted for 34.84% in 2025, reflecting demand for group-friendly prices and policies that cover multiple age bands with simple rules and clear medical, cancellation, and baggage limits. Business travelers are projected to grow at 23.37% through 2031 as work trips combine with personal extensions and as corporate travel policies adapt to evolving duty-of-care expectations. Surveyed trends show that younger parents and solo travelers are taking longer or multi-stop plans and want coverage that follows them across diverse itineraries, which improves the baseline addressable pool for mid-tier plan options. Corporate travel managers place greater emphasis on medical and security assistance, and they value products that pair real-time alerts with well-defined benefits for delays and missed connections. Segment needs are clear in aggregator activity, where mix shifts show increased interest in medical, interruption, and delay combinations for travelers balancing cost and reliability.
Seniors are a structurally important segment due to higher medical risk awareness and longer average trip lengths, but premiums can be a barrier without targeted plan design. Marketplace data show that older travelers pay more than younger cohorts on a per-policy basis, which places a premium on clear value demonstration and responsive claims handling at critical moments. Parametric benefits resonate with business and frequent travelers who need fast, predictable relief when flights are delayed, or weather forces schedule changes. Indian travelers show a wide range of needs that span student, family, and corporate profiles, and this diversity is driving the design of persona-based options that blend cost control with adequate medical and evacuation support. As embedded offers become more common across travel and banking platforms, the travel insurance market should see demand concentrate in plans that optimize price-to-benefit trade-offs for common trip types.
Geography Analysis
Europe retained leadership with 41.87% in 2025, reflecting a long-standing base of insured inbound and outbound travel underpinned by clear regulatory guardrails. The Schengen Area’s medical coverage requirement for many non-EU visitors supports steady policy uptake, and the planned late-2026 ETIAS start is expected to keep documentation and insurance top of mind for visa-exempt travelers. Embedded distribution remains important at airline, OTA, and card-issuer touchpoints, which helps maintain scale advantages for large carriers and assistance networks in the travel insurance market. India-to-Europe corridors remain a core flow for leisure, education, and business, underscoring the relevance of plans that meet Schengen proof-of-coverage thresholds with sufficient medical and evacuation limits. With product menus that favor modularity and faster payouts, Europe’s incumbents and partners are positioned to defend share while adapting to digital buyer preferences across segments.
Asia-Pacific is the fastest-growing region with a projected 19.37% CAGR through 2031, supported by recovering outbound travel from China and robust inbound demand in Japan. Regional seat capacity and low-cost carrier activity have helped pull traffic closer to pre-pandemic baselines, and this underwrites wider policy uptake for medical, delay, and baggage protection in the travel insurance market. Chinese outbound travelers are prioritizing safety and weather resilience, and stated purchase intentions for insurance are strong, which favors plans that combine medical benefits with parametric features. India’s data-protection framework reinforces privacy and consent rules for cross-border underwriting, guiding how carriers and partners handle personal data and analytics across acquisition and claims. As Asian routes expand and traveler profiles diversify, product design and claims logistics will be key levers for retention in India and neighboring outbound markets.
North and South America show mixed dynamics that still contribute meaningful growth and product innovation. Parametric flight-delay coverage is scaling through integration with booking flows and mobile apps, which aligns benefits with real travel disruptions and accelerates claims. Brazil’s market shows steady premium growth on rising regional travel, and industry association updates indicate higher consumer uptake during peak periods, which supports continued distribution investment in Latin channels. Indian leisure and VFR travelers to North America are a consistent use case for comprehensive plans due to medical cost differentials, which anchor demand for higher-limit products with evacuation and repatriation. Together, these patterns reinforce a broad geographic base for the travel insurance market with region-specific triggers for adoption across product types.

Competitive Landscape
The travel insurance market is moderately concentrated, with global carriers and assistance providers operating at scale across embedded, aggregator, and direct channels. Product and channel innovation focus on faster claims, clear benefit structures, and parametric payouts that enhance perceived value during travel disruptions. Marketplaces continue to expand plan offerings, including multi-trip and cruise-specific products tailored to diverse traveler needs and budgets. For India-focused distributors, mobile-first onboarding and policy servicing are essential to align with digital payment habits and evolving trip-planning behaviors. Continuous improvements in user experience and payout speed remain critical as more buyers compare options online and at checkout.
Strategic initiatives are increasingly centered on outcome-based coverage and embedded partnerships that position protection at the point of traveler decision-making. Digital-first parametric solutions demonstrate momentum, automatically triggering claims for flight delays or weather disruptions using objective data. Marketplaces are pursuing vertical integration, creating proprietary products that cater to high-growth niches like cruises, where coverage for itinerary changes and missed ports is standard. Specialized assistance providers are expanding into growth markets, adding regional offices and local service capabilities to support multinational corporate clients and frequent travelers. This combination of embedded deployment, modular plan design, and regional capability expansion strengthens competitive positioning across multiple traveler segments and geographies.
Regulatory compliance and data-governance readiness are becoming core differentiators as privacy and cybersecurity requirements tighten globally. Laws such as India’s DPDP Act, along with regulations in Europe and Asia, influence how insurers manage consent, cross-border data transfers, and localization, affecting both acquisition and claims processes. Companies are investing in identity verification and fraud analytics to protect loss ratios in digital channels while maintaining speed in policy issuance and claims. Parametric and assistance partnerships increase resilience to operational disruptions, simplifying benefits and accelerating relief, which builds trust with policyholders. With growth in aggregation, embedded distribution, and direct channels, differentiation will increasingly depend on transparent plan design, rapid payouts, and localized compliance that meet the expectations of both domestic and international travelers.
Travel Insurance Industry Leaders
American International Group Inc.
Assicurazioni Generali SpA
Allianz SE
AXA S.A.
Berkshire Hathaway Travel Protection
- *Disclaimer: Major Players sorted in no particular order

Recent Industry Developments
- November 2025: Tower Insurance (New Zealand) launched Rainfall Response Cover in Fiji, a parametric insurance product providing rapid cash payouts to communities impacted by heavy rainfall, regardless of damage, in partnership with CelsiusPro via its White Label Platform, supported by the United Nations Capital Development Fund, Pacific Insurance and Climate Adaptation Programme, Reserve Bank of Fiji, and the InsuResilience Solutions Fund, which will subsidize premiums during the pilot phase.
- October 2025: Chubb launched Travel Pro, a suite of digital-first, parametric travel insurance products embedded directly into airline, OTA, and financial institution booking flows via Chubb Studio®, offering automatic claims and quick payouts for flight delays, baggage issues, weather disruptions, and medical emergencies through redemption options including airline miles, lounge access, direct debit, or e-vouchers.
- September 2025: Trawick International announced the launch of its UK Accident & Health Division, introducing a suite of innovative products for the globally mobile population and establishing SureGo Administrative Services, a Lloyd's DCA-approved Third Party Administrator, to service policies with A-rated capacity from a major Lloyd's syndicate.
- March 2025: Squaremouth launched Tin Leg Cruise, a new cruise-specific insurance product underwritten by Squaremouth itself (via its Tin Leg brand), featuring benefits such as USD 250 per person for itinerary changes, $500 for missed port of call after a three-hour delay, USD 100 for travel inconveniences including flight delays and confinement on ship, and coverage for water-level disruptions that force cruise-line cancellations.


Research Methodology Framework and Report Scope
Market Definitions and Key Coverage
Our study defines the global travel insurance market as the gross written premiums that individual travelers pay for single-trip, annual multi-trip, or extended-stay policies covering medical expenses, trip cancellation, baggage loss, personal liability, and emergency assistance while journeying domestically or abroad. Products are captured at the point of premium recognition, irrespective of distribution channel or underwriting domicile, thereby mirroring the value pool available to insurers and intermediaries.
Scope exclusion: We deliberately leave out self-funded corporate travel programs, embedded micro-covers offered free of charge by card issuers, and revenue from insurance technology platforms that merely enable policy administration.
Segmentation Overview
- Segmentation by Insurance Cover Type
- Single Trip
- Annual Multi-Trip
- Long-Stay / Extended-Stay
- Specialized Policies
- Flight-Delay Insurance
- Cancel-for-Any-Reason (CFAR)
- Adventure-Sports Coverage
- Segmentation by Distribution Channel
- Insurance Intermediaries
- Insurance Companies (Direct)
- Banks & Bancassurance
- Travel Agents & Tour Operators
- Online Aggregators / Comparison Portals
- Others (Airlines & Online Travel Agencies, Super-Apps & Digital Wallets)
- Segmentation by End-User / Traveller Type
- Family Travellers
- Business Travellers
- Senior Citizens
- Students
- Others (Remote Workers, Backpackers, Group Travellers)
- Segmentation by Geography
- North America
- United States
- Canada
- Mexico
- South America
- Brazil
- Argentina
- Peru
- Chile
- Rest of South America
- Europe
- Germany
- United Kingdom
- France
- Italy
- Spain
- BENELUX (Belgium, Netherlands, and Luxembourg)
- NORDICS (Denmark, Finland, Iceland, Norway, and Sweden)
- Rest of Europe
- Middle East And Africa
- United Arab Emirates
- Saudi Arabia
- South Africa
- Nigeria
- Rest of Middle East & Africa
- Asia-Pacific
- China
- India
- Japan
- South Korea
- Australia
- Southeast Asia
- Singapore
- Thailand
- Indonesia
- Vietnam
- Philippines
- Malaysia
- Rest of Southeast Asia
- Rest of Asia-Pacific
- North America
Detailed Research Methodology and Data Validation
Primary Research
Underwriting heads, travel agency networks, online aggregators, and bancassurance managers across Europe, North America, and Asia-Pacific are interviewed or surveyed to test penetration rates, average premiums, claim frequencies, and channel shifts that secondary sources only hint at. Their feedback guides parameter tweaks and scenario bounds.
Desk Research
We begin with public-domain foundations such as UNWTO international arrival statistics, World Bank outbound tourism spend, USTIA premium audits, Eurostat holiday travel surveys, and regional regulators like EIOPA, IRDAI, and NAIC. Company filings, investor decks, and regulatory solvency statements are mined through Dow Jones Factiva and D&B Hoovers to benchmark premium splits and loss ratios. Trade associations, peer-reviewed journals, and customs data on outbound passenger flows further ground the baseline. This catalog is illustrative; many additional sources inform our evidence stack.
Market-Sizing & Forecasting
A blended top-down model converts outbound trip volumes and domestic overnight journeys into an addressable traveler pool, applies region-specific take-up rates, and multiplies by weighted average premiums. Supplier roll-ups, sampled ASP × policy counts from intermediaries, and airport channel checks act as bottom-up guardrails before totals are finalized. Key drivers include visa mandate expansions, digital booking share, senior citizen traveler growth, healthcare cost inflation, and currency swings; these factors feed a multivariate regression that projects values through 2030. Gaps in granular country data are bridged by nearest-neighbor ratios validated in primary calls.
Data Validation & Update Cycle
Mordor analysts run variance checks against historical claims ratios, reconcile anomalies, and pass models through a two-level peer review. Reports refresh annually; material shocks such as pandemic rules or major M&A trigger interim updates, and a final pre-publication sweep ensures clients receive the latest view.
Why Our Travel Insurance Baseline Commands Reliability
We acknowledge that published market numbers rarely align because firms vary in product scope, geographic roll-ups, currency treatment, and refresh cadence.
Key gap drivers include whether ancillary covers like rental-car excess are counted, how aggressively future penetration ramps are assumed, and whether exchange rates are frozen or blended. Mordor Intelligence keeps scope tight to traveler-paid premiums, applies consensus FX rates, and refreshes inputs every twelve months, whereas other studies often meld platform revenue, use static 2023 conversions, or project linear adoption.
Benchmark comparison
| Market Size | Anonymized source | Primary gap driver |
|---|---|---|
| USD 25.98 B (2025) | Mordor Intelligence | - |
| USD 27.55 B (2024) | Global Consultancy A | Includes complimentary card-linked covers; single FX base year |
| USD 27.05 B (2024) | Industry Association B | Counts platform service fees alongside premiums |
| USD 23.51 B (2024) | Regional Consultancy C | Excludes domestic travel policies in Asia-Pacific |
Taken together, the comparison shows that our disciplined scope selection and yearly refresh yield a balanced, transparent baseline that decision-makers can reproduce and stress-test with limited inputs.


Key Questions Answered in the Report
What is the travel insurance market size and expected growth by 2031?
The travel insurance market size is USD 30.08 billion in 2026 and is projected to reach USD 62.53 billion by 2031 at a 15.76% CAGR.
Which regions lead and grow fastest in travel insurance?
Europe leads by scale with a 41.87% share in 2025, while Asia-Pacific is the fastest-growing region with a projected 19.37% CAGR through 2031.
What are the main product and channel shifts shaping the travel insurance market?
Single-trip policies hold the largest share, long-stay policies grow fastest, intermediaries lead distribution, and online aggregators scale rapidly with AI-driven comparisons and embedded checkout journeys.
How are parametric products changing the customer experience?
Parametric coverage automates payouts for defined events like flight delays, reducing documentation, accelerating claims, and improving satisfaction at disruption points.
How do privacy and data rules affect travel insurance for Indian travelers?
India's DPDP Act requires consent-based processing and can affect cross-border underwriting and data localization, which shapes how insurers personalize offers and handle claims for Indian customers.
Which traveler segments are driving demand toward 2031?
Families contribute the largest share, while business travelers post the fastest growth on bleisure patterns and stronger duty-of-care needs, with seniors maintaining high medical coverage demand despite higher premiums.
Page last updated on:


