Market Overview
| Study Period | 2020 - 2031 |
|---|---|
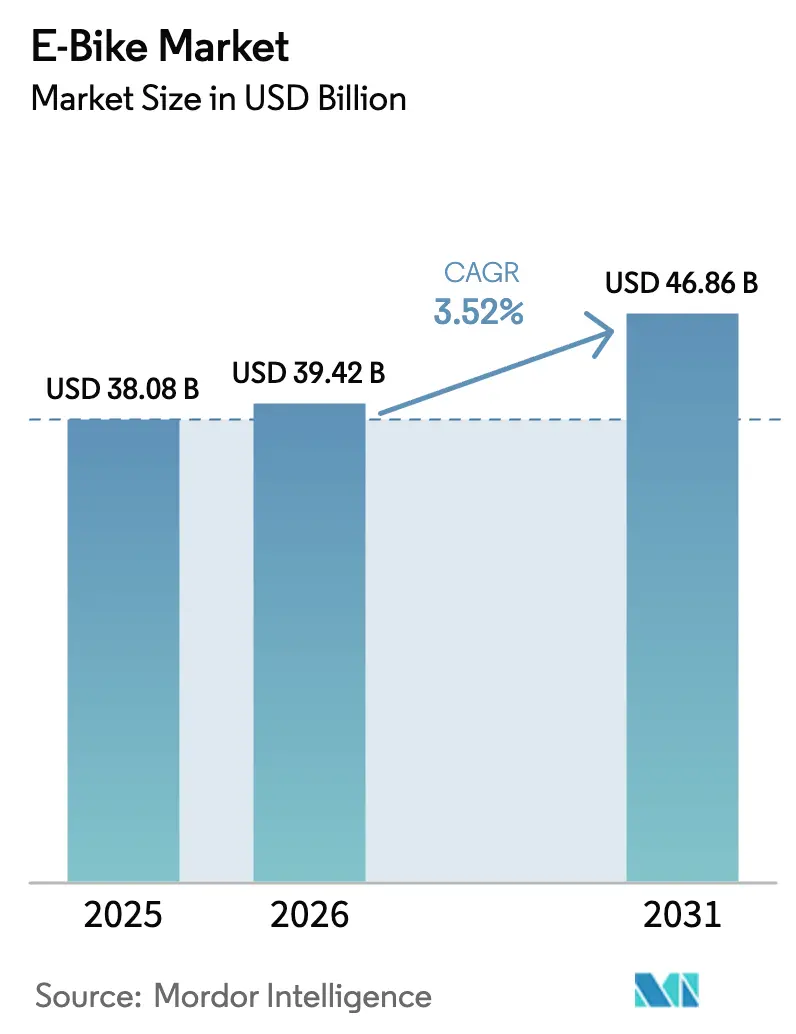
| Market Size (2026) | USD 39.42 Billion |
| Market Size (2031) | USD 46.86 Billion |
| Growth Rate (2026 - 2031) | 3.52% CAGR |
| Fastest Growing Market | North America |
| Largest Market | Europe |
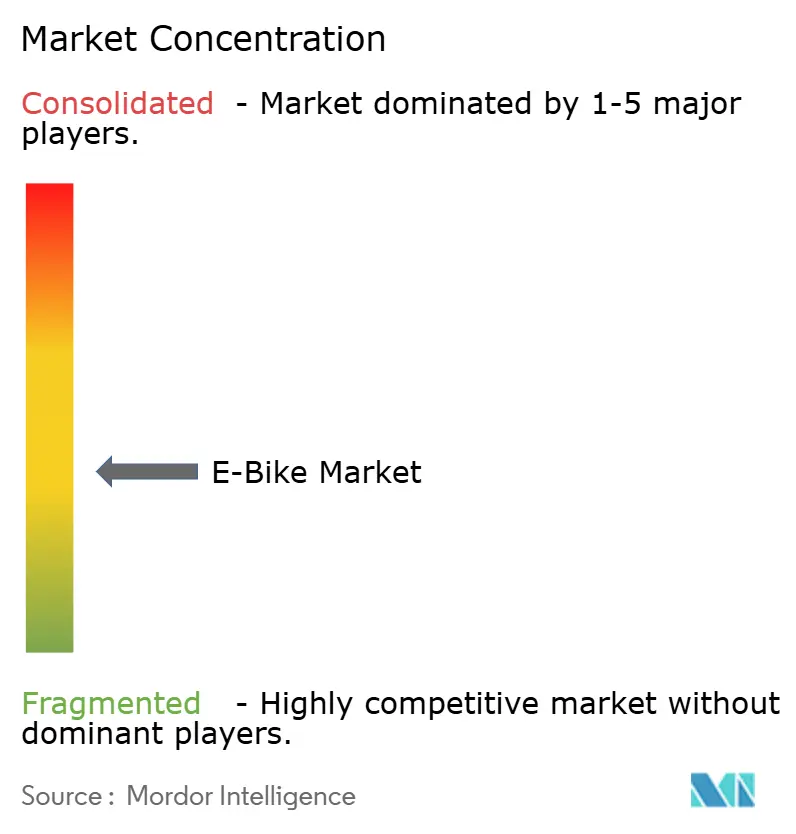
| Market Concentration | Medium |
Major Players *Disclaimer: Major Players sorted in no particular order Image © Mordor Intelligence. Reuse requires attribution under CC BY 4.0. | |
E-Bike Market Analysis by Mordor Intelligence
e-bike market size in 2026 is estimated at USD 39.42 billion, growing from 2025 value of USD 38.08 billion with 2031 projections showing USD 46.86 billion, growing at 3.52% CAGR over 2026-2031. The measured expansion reflects the transition from early adoption to mainstream use as corporate leasing schemes now give employees access to salary-sacrifice bikes. Demand is tilting toward premium models priced USD 3,500-5,999, the fastest-growing band, while targeted subsidies—France’s EUR 4,000 (~USD 4,622) incentive and Poland’s PLN 300 million (~USD 81 million) program—continue to widen the addressable base. Battery technology remains a cornerstone; lithium-ion captures a major share, yet sodium-ion and solid-state chemistries are lining up to ease China-centric raw-material risk.
Key Report Takeaways
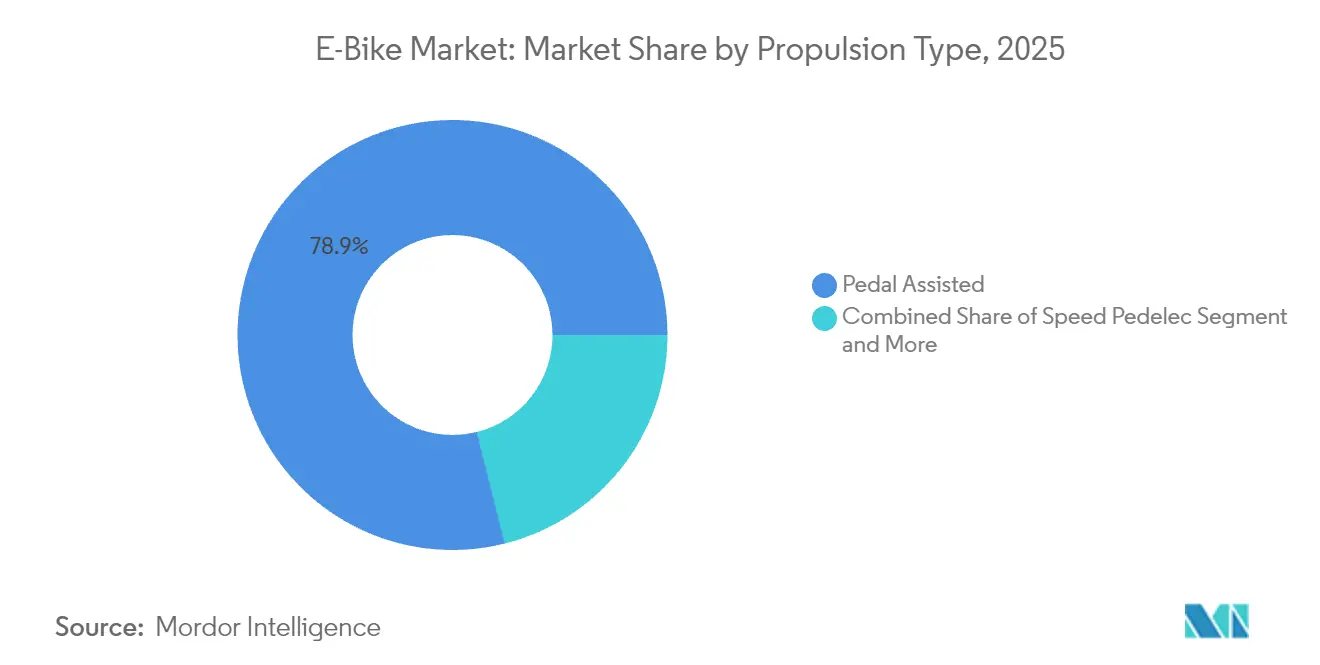
- By propulsion type, pedal-assist systems controlled 78.90% of the e-bike market share in 2025, whereas speed pedelecs are projected to log a 4.02% CAGR through 2031.
- By application type, city/urban models held 76.05% of the e-bike market share in 2025, while trekking/mountain variants are expected to record a 3.65% CAGR to 2031.
- By battery type, lithium-ion packs accounted for 98.41% of the e-bike market share in 2025; the other segment is positioned to grow at a 4.32% CAGR.
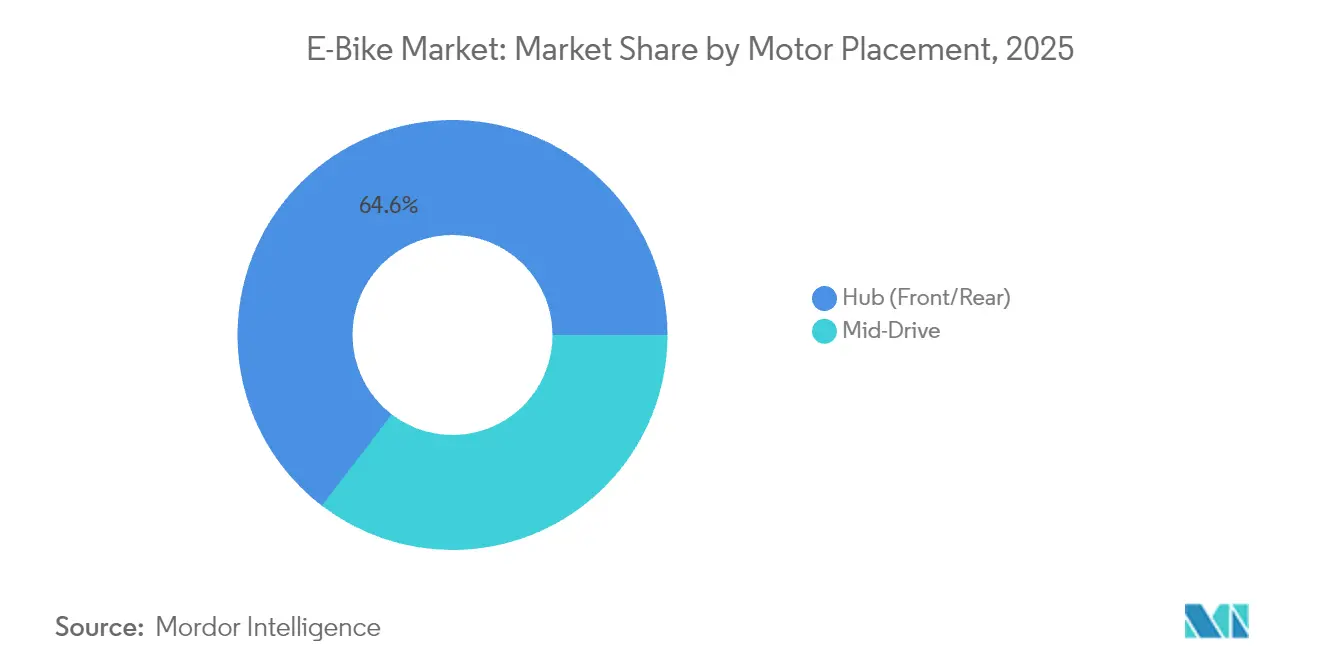
- By motor placement, hub drives secured a 64.60% of the e-bike market share in 2025, whereas mid-drive units are on course for a 4.93% CAGR.
- By drive system, chain drives led with 76.60% of the e-bike market share in 2025; belt drives are forecast to expand at a 5.19% CAGR.
- By motor power, sub-250 W models represented 58.45% of the e-bike market share in 2025, and 501-600 W units are tracking a 4.73% CAGR.
- By price band, bikes priced USD 1,000-1,499 captured 29.60% of the e-bike market share in 2025; the USD 3,500-5,999 band is projected to post a 5.55% CAGR.
- Offline stores still represented 72.40% of the e-bike market share in 2025, however online and subscription models are projected to grow at a 6.62% CAGR through 2031.
- By end use, personal and family purchases comprised 61.60% of the e-bike market share in 2025, while commercial delivery fleets are advancing at a 5.95% CAGR.
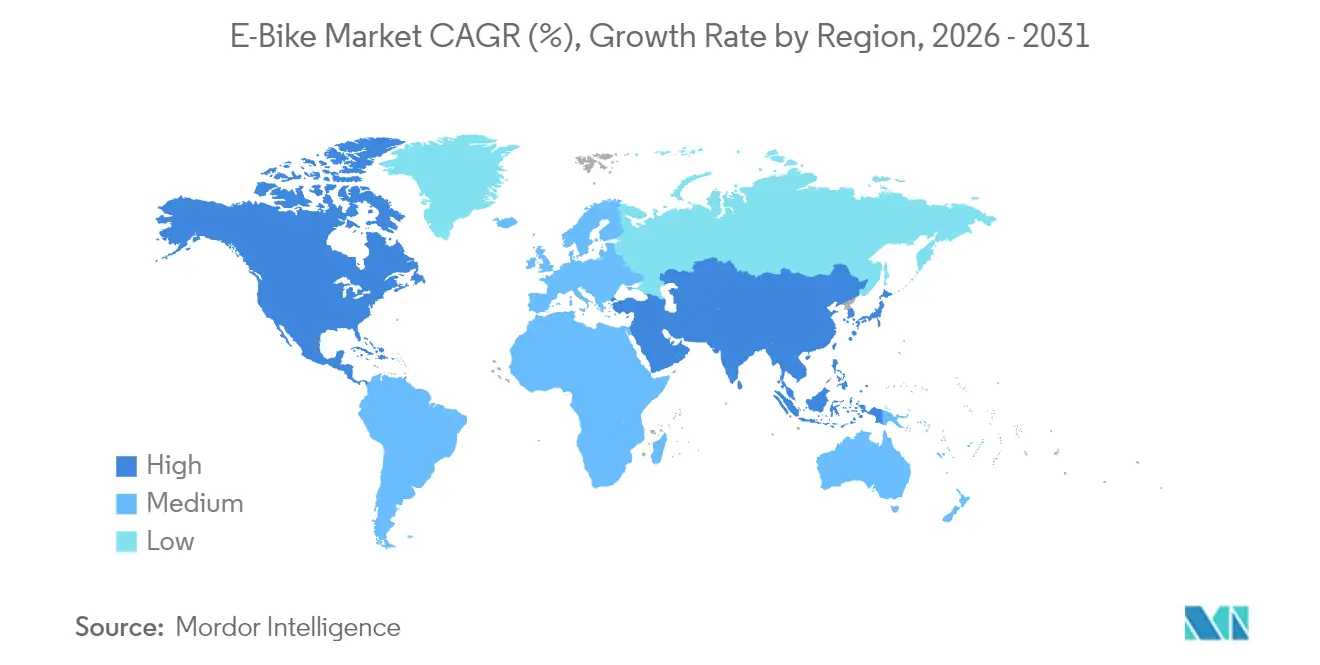
- By geography, Europe led with 54.80% of the e-bike market share in 2025; North America is set to witness the quickest 7.19% CAGR through 2031.
Note: Market size and forecast figures in this report are generated using Mordor Intelligence’s proprietary estimation framework, updated with the latest available data and insights as of 2026.
Global E-Bike Market Trends and Insights
Drivers Impact Analysis*
| Driver | (~) % Impact on CAGR Forecast | Geographic Relevance | Impact Timeline |
|---|---|---|---|
| Urban Congestion Spurs Micro-Mobility | +0.8% | Global urban centers, strongest in Europe and Asia-Pacific | Long term (≥ 4 years) |
| Li-ion Energy Density and Cost Declines | +0.7% | Global manufacturing hubs led by Asia-Pacific | Short term (≤ 2 years) |
| Government Incentives and Purchase Subsidies | +0.6% | Europe, North America, selected Asia-Pacific markets | Medium term (2-4 years) |
| Corporate Employee Benefit Programs | +0.4% | Europe, North America, expanding in Asia-Pacific | Medium term (2-4 years) |
| Insurance Discounts for Cargo E-Bikes | +0.3% | Europe and North America commercial segments | Medium term (2-4 years) |
| Growth of E-Bike Tourism Routes | +0.2% | Europe, North America, select Asia-Pacific destinations | Long term (≥ 4 years) |
| Source: Mordor Intelligence | |||


Urban Congestion Driving Micro-Mobility
Parking spaces in tier-1 cities cost as high as USD 30,000, making e-bikes a cost-efficient commute tool over 5-15 km trips—the distance that accounts for 40% of urban journeys. London’s ULEZ expansion, plus GBP 7,000 (~USD 9,319) scrappage grants, has accelerated uptake among couriers, while companies such as Amazon and Google subsidize monthly e-bike subscriptions to ease parking stress and hit sustainability targets [1]“ULEZ Scrappage Grants,” Transport for London, tfl.gov.uk.
Li-ion Battery Energy-Density and Cost Declines
Lithium-ion pack prices have declined significantly since 2010, moving 100+ km range bikes under the USD 2,000 mark. Fast-charge designs now reach 80% in 30 minutes, opening doors for high-utilization commercial fleets. Sodium-ion prototypes promise similar cycle life at 30% reduced cost, while solid-state roadmaps target 2× energy density by 2028.
Government Incentives and Purchase Subsidies
Targeted subsidies treat e-bikes as low-infrastructure tools for decongesting cities. France now refunds up to EUR 4,000 (~USD 4,622) per bike for low-income buyers, and Poland earmarked PLN 300 million (~USD 81 million) to put 300,000 units on the road. Canada’s CAD 400 million (~USD 286 million) active-transport budget finances lanes and charging points. Means-tested U.S. state rebates of up to USD 1,750 help address mobility gaps, and many programs now prioritize cargo bikes that can substitute cars.
Corporate Employee E-Bike Benefit Programs
Lease-a-Bike covers over 80,000 companies, offering salary-conversion plans that cut purchase cost up to 40% and wrap in insurance plus service. Participation already tops 900,000 riders, and pending U.S. Bicycle Commuter Act legislation aims to mirror Europe’s pretax incentives.
Restraints Impact Analysis*
| Restraint | (~) % Impact on CAGR Forecast | Geographic Relevance | Impact Timeline |
|---|---|---|---|
| Battery-Fire Incidents and Tighter Norms | −0.6% | North America and Europe | Medium term (2-4 years) |
| High Upfront Cost Vs. Standard Bikes | −0.5% | Global, notably in developing regions | Short term (≤ 2 years) |
| Limited Charging Infrastructure | −0.4% | Asia-Pacific, Middle East and Africa, South America | Long term (≥ 4 years) |
| Critical-Mineral Supply Volatility | −0.3% | Global, supply chain clustered in Asia | Medium term (2-4 years) |
| Source: Mordor Intelligence | |||
Battery-Fire Incidents and Stricter Safety Norms
NYC recorded 187 e-mobility fires in 2023, lifting four-year costs to USD 518.6 million. California’s SB 1271 and the UL 2849 standard now require certified packs, adding USD 200-500 per unit. Manufacturers are investing in thermal management and remote diagnostics to keep pace.
High Upfront Cost vs. Conventional Bikes
An e-bike still retails at roughly triple the price of a traditional bicycle, limiting adoption in developing markets. Entry-level USD 1,000-1,499 models form 30.18% of 2024 shipments, yet leasing programs, maintenance bundling, and battery cost erosion are narrowing the gap.
*Our forecasts treat driver/restraint impacts as directional, not additive. The impact forecasts reflect baseline growth, mix effects, and variable interactions.
Segment Analysis
By Propulsion Type: Speed Pedelecs Gain Premium Cachet
The market size for pedal-assist models reached a commanding 78.90% share in 2025, benefiting from favorable EU regulations that classify them as bicycles. Speed-pedelec variants, offering assistance up to 45 km/h, are charting a 4.02% CAGR as commuters seek car-like travel times in dense cities.
Manufacturers are layering AI algorithms onto motor controllers to optimize output by terrain and rider habits. Shimano’s forthcoming automatic-shift drivetrain illustrates how suppliers bundle smart gearboxes with high-torque motors, strengthening their appeal among urban professionals.


By Application Type: Trekking Momentum Builds
City/urban bikes generated 76.05% of the market share in 2025 as urban riders opted for sweat-free commuting. Trekking/mountain models, however, are advancing at 3.65% CAGR, spurred by tour operators that now default to e-assisted fleets.
Operators see expanded demographics, older cyclists and mixed-fitness groups, as key growth levers. As trail access rules evolve, the segment is poised for further penetration into national parks and resort destinations.
By Battery Type: Lithium-Ion Hegemony—But Alternatives Loom
Lithium-ion cells controlled 98.41% of the e-bike market share in 2025, underlining cost leadership and energy density. The “Others” bucket, housing sodium-ion and early solid-state prototypes, is growing at 4.32% CAGR as brands hedge raw-material exposure.
OEMs are dual-sourcing prismatic and cylindrical formats to mitigate China-centric processing. Should sodium-ion hit expected price parity by 2027, the chemistry could siphon double-digit share from legacy packs.
By Motor Placement: Mid-Drive Versus Hub
Hub (front/rear) systems held 64.60% of the e-bike market share in 2025, favored for simplicity and price. Mid-drives, tracking a 4.93% CAGR, deliver superior hill-climb torque and balanced weight for cargo and off-road builds.
Giant’s latest rear-hub platform replicates mid-drive torque via planetary gearing, showing that innovation continues on both paths to serve distinct use cases.
By Drive Systems: Belt Drives Challenge Chains
Chain drives accounted for 76.60% of the e-bike market share in 2025, but belt systems are expanding 5.19% annually. Reduced maintenance and silent operation resonate with commuters and fleet managers.
Fleet operators targeting total cost of ownership view belt systems—capable of 10,000+ km before service—as an operational win, despite higher upfront expense.
By Motor Power: Regional Rules Dictate Demand
Sub-250 W units, essential for EU legal compliance, contributed 58.45% of the e-bike market share in 2025. The 501-600 W tier, prominent in North America’s more liberal regulations, is climbing at 4.73% CAGR.
Efficiency upgrades let controllers squeeze higher peak power from nominally compliant motors, illustrating regulatory adaptation while retaining user benefits.
By Price Band: Premium Value Migration
Bikes priced USD 1,000-1,499 led with 29.60% of the e-bike market share in 2025, yet the USD 3,500-5,999 slot is the fastest riser at 5.55% CAGR, mirroring consumer appetite for integrated displays, carbon frames, and advanced connectivity.
Corporate leasing smooths the premium transition by spreading costs across paychecks and wrapping insurance plus servicing.
By Sales Channel: Online Cuts Out the Middle Layer
Offline stores still represented 72.40% of the market share in 2025, thanks to test-ride needs and service desks. Pure online and subscription models are, however, accelerating at a 6.62% CAGR.
Successful brands blend online discovery with localized service hubs, showing that an omnichannel route is emerging as the durable model for the e-bike market.

By End Use: Commercial Delivery Reshapes Logistics
Personal and family riders produced 61.60% of the e-bike market share in 2025, but commercial fleets are sprinting ahead at a 5.95% CAGR. NYC’s pilot logged 130,000 trips delivering 5 million parcels, cutting 650,000 t of CO₂ in a single year .
Regulators now allocate curb space specifically to cargo bikes, reinforcing their position as the zero-emission backbone of urban last-mile delivery.
Geography Analysis
Europe retained 54.80% of the 2025 e-bike market revenue. Germany alone has 15.7 million units in circulation and sold 2.1 million in 2024, helped by salary-sacrifice programs covering several workers . The Netherlands shows saturation traits, with e-bikes normalized across age groups, while France’s EUR 4,000 (~USD 4,622) low-income grant keeps funneling new buyers. Continuous path networks and bicycle-first urban planning remain Europe’s durable competitive edge.
North America, though smaller today, is the quickest-growing region at 7.19% CAGR. State rebates of up to USD 1,750 in California and New York, alongside corporate stipends, are unlocking latent demand. Canada’s CAD 400 million (~USD 286 million) infrastructure rollout links e-bike lanes to charging nodes, creating end-to-end fleets for commuters and delivery riders alike.
Asia-Pacific reflects a tapestry of conditions. China supplies a major share of e-bike imports in the United States and posted notable export receipts in 2024. India crossed a significant electric two-wheeler mark in 2024, though mopeds still outweigh pedal-assist formats. Japan and South Korea cater to premium, tech-heavy niches, while Australia leans on eco-tourism routes to lift trekking sales. Localized regulation and income profiles dictate tailored channel, price, and specification strategies.

Competitive Landscape
The global e-bike arena remains moderately fragmented, with heritage bicycle brands, scale-driven Chinese producers, and digital-native start-ups all vying for share. Giant, Trek, and Specialized rely on long-standing dealer networks and tight Bosch or Shimano motor partnerships to defend premium ground, while leveraging integrated connectivity and over-the-air updates to lock in customers. Yadea, Aima, and other Chinese majors flood mid-range price tiers through vertically integrated plants that squeeze component costs and compress Western competitors’ margins.
Component suppliers are strategic kingmakers. Shimano’s entrenched drivetrain contracts give it leverage to steer OEM design choices, whereas Bosch faces entry friction despite strong mid-drive technology. Battery specialists are reshuffling as certified UL 2849 packs become compulsory in key U.S. states; the need for safety compliance favors well-capitalized vendors that can absorb testing fees and manage raw-material volatility. Hardware is increasingly inseparable from software, and firms that harmonize both layers gain stickier revenue streams.
Service-centric players add new wrinkles. Lease-a-Bike and Rybit target employers with turnkey leasing that bundles insurance, theft recovery, and maintenance, securing multi-year cash flows independent of one-time bike sales. Zoomo and other fleet-management vendors court gig-economy couriers with telematics dashboards that optimize uptime and route efficiency. As labor, marketing, and warranty costs rise, many smaller assemblers lack the scale or service muscle to stay competitive, suggesting continued consolidation and selective partnerships rather than a winner-take-all shake-out.
E-Bike Industry Leaders
Giant Manufacturing Co., Ltd.
Yadea Group Holdings Ltd.
Merida Industry Co., Ltd.
Aima Technology Group Co., Ltd.
Trek Bicycle Corporation
- *Disclaimer: Major Players sorted in no particular order

Recent Industry Developments
- September 2025: Giant revealed its 2026 Explore E+ range, pairing a 75 Nm motor and 500 Wh battery at entry level and an automatic Enviolo hub plus radar on the flagship Explore E+0.
- September 2024: Tata-owned Stryder Cycle launched Voltic X and Voltic GO at promotional prices of INR 32,495 (~USD 366) and INR 31,495 (~USD 354), signaling a push to mainstream e-bikes amid pollution concerns.
- August 2024: Stromer partnered with Spoke Safety to embed V2X communication in its s-pedelecs, offering real-time traffic alerts and aftermarket upgrade paths.
- May 2024: Heybike introduced the Hauler cargo model, supporting a 440 lb payload and dual batteries to target family and delivery users.


Global E-Bike Market Report Scope
Pedal Assisted, Speed Pedelec, Throttle Assisted are covered as segments by Propulsion Type. Cargo/Utility, City/Urban, Trekking are covered as segments by Application Type. Lead Acid Battery, Lithium-ion Battery, Others are covered as segments by Battery Type. Africa, Asia-Pacific, Europe, Middle East, North America, South America are covered as segments by Region.By Propulsion Type
| Pedal Assisted |
| Speed Pedelec |
| Throttle Assisted |
By Application Type
| Cargo/Utility |
| City/Urban |
| Trekking/Mountain |
By Battery Type
| Lead Acid Battery |
| Lithium-ion Battery |
| Others |
By Motor Placement
| Hub (Front/Rear) |
| Mid-Drive |
By Drive Systems
| Chain Drive |
| Belt Drive |
By Motor Power
| Below 250 W |
| 251-350 W |
| 351-500 W |
| 501-600 W |
| Above 600 W |
By Price Band
| Up to USD 1,000 |
| USD 1,000-1,499 |
| USD 1,500-2,499 |
| USD 2,500-3,499 |
| USD 3,500-5,999 |
| Above USD 6,000 |
By Sales Channel
| Online |
| Offline |
By End Use
| Commercial Delivery | Retail and Goods Delivery |
| Food and Beverage Delivery | |
| Service Providers | |
| Personal and Family Use | |
| Institutional | |
| Others |
By Geography
| North America | United States |
| Canada | |
| Rest of North America | |
| South America | Argentina |
| Brazil | |
| Rest of South America | |
| Europe | Germany |
| United Kingdom | |
| France | |
| Italy | |
| Spain | |
| Netherlands | |
| Austria | |
| Sweden | |
| Switzerland | |
| Rest of Europe | |
| Asia-Pacific | China |
| India | |
| Japan | |
| South Korea | |
| Australia | |
| New Zealand | |
| Rest of Asia-Pacific | |
| Middle East and Africa | Saudi Arabia |
| United Arab Emirates | |
| South Africa | |
| Rest of the Middle East and Africa |
| By Propulsion Type | Pedal Assisted | |
| Speed Pedelec | ||
| Throttle Assisted | ||
| By Application Type | Cargo/Utility | |
| City/Urban | ||
| Trekking/Mountain | ||
| By Battery Type | Lead Acid Battery | |
| Lithium-ion Battery | ||
| Others | ||
| By Motor Placement | Hub (Front/Rear) | |
| Mid-Drive | ||
| By Drive Systems | Chain Drive | |
| Belt Drive | ||
| By Motor Power | Below 250 W | |
| 251-350 W | ||
| 351-500 W | ||
| 501-600 W | ||
| Above 600 W | ||
| By Price Band | Up to USD 1,000 | |
| USD 1,000-1,499 | ||
| USD 1,500-2,499 | ||
| USD 2,500-3,499 | ||
| USD 3,500-5,999 | ||
| Above USD 6,000 | ||
| By Sales Channel | Online | |
| Offline | ||
| By End Use | Commercial Delivery | Retail and Goods Delivery |
| Food and Beverage Delivery | ||
| Service Providers | ||
| Personal and Family Use | ||
| Institutional | ||
| Others | ||
| By Geography | North America | United States |
| Canada | ||
| Rest of North America | ||
| South America | Argentina | |
| Brazil | ||
| Rest of South America | ||
| Europe | Germany | |
| United Kingdom | ||
| France | ||
| Italy | ||
| Spain | ||
| Netherlands | ||
| Austria | ||
| Sweden | ||
| Switzerland | ||
| Rest of Europe | ||
| Asia-Pacific | China | |
| India | ||
| Japan | ||
| South Korea | ||
| Australia | ||
| New Zealand | ||
| Rest of Asia-Pacific | ||
| Middle East and Africa | Saudi Arabia | |
| United Arab Emirates | ||
| South Africa | ||
| Rest of the Middle East and Africa | ||


Market Definition
- By Application Type - E-bikes considered under this segment include city/urban, trekking, and cargo/utility e-bikes. The common types of e-bikes under these three categories include off-road/hybrid, kids, ladies/gents, cross, MTB, folding, fat tire, and sports e-bike.
- By Battery Type - This segment includes lithium-ion batteries, lead-acid batteries, and other battery types. The other battery type category includes nickel-metal hydroxide (NiMH), silicon, and lithium-polymer batteries.
- By Propulsion Type - E-bikes considered under this segment include pedal-assisted e-bikes, throttle-assisted e-bikes, and speed pedelec. While the speed limit of pedal and throttle-assisted e-bikes is usually 25 km/h, the speed limit of speed pedelec is generally 45 km/h (28 mph).
| Keyword | Definition |
|---|---|
| Pedal Assisted | Pedal-assist or pedelec category refers to the electric bikes that provide limited power assistance through torque-assist system and do not have throttle for varying the speed. The power from the motor gets activated upon pedaling in these bikes and reduces human efforts. |
| Throttle Assisted | Throttle-based e-bikes are equipped with the throttle assistance grip, installed on the handlebar, similarly to motorbikes. The speed can be controlled by twisting the throttle directly without the need to pedal. The throttle response directly provides power to the motor installed in the bicycles and speeds up the vehicle without paddling. |
| Speed Pedelec | Speed pedelec is e-bikes similar to pedal-assist e-bikes as they do not have throttle functionality. However, these e-bikes are integrated with an electric motor which delivers power of approximately 500 W and more. The speed limit of such e-bikes is generally 45 km/h (28 mph) in most of the countries. |
| City/Urban | The city or urban e-bikes are designed with daily commuting standards and functions to be operated within the city and urban areas. The bicycles include various features and specifications such as comfortable seats, sit upright riding posture, tires for easy grip and comfortable ride, etc. |
| Trekking | Trekking and mountain bikes are special types of e-bikes that are designed for special purposes considering the robust and rough usage of the vehicles. These bicycles include a strong frame, and wide tires for better and advanced grip and are also equipped with various gear mechanisms which can be used while riding in different terrains, rough grounded, and tough mountainous roads. |
| Cargo/Utility | The e-cargo or utility e-bikes are designed to carry various types of cargo and packages for shorter distances such as within urban areas. These bikes are usually owned by local businesses and delivery partners to deliver packages and parcels at very low operational costs. |
| Lithium-ion Battery | A Li-ion battery is a rechargeable battery, which uses lithium and carbon as its constituent materials. The Li-Ion batteries have a higher density and lesser weight than sealed lead acid batteries and provide the rider with more range per charge than other types of batteries. |
| Lead Acid Battery | A lead acid battery refers to sealed lead acid battery having a very low energy-to-weight and energy-to-volume ratio. The battery can produce high surge currents, owing to its relatively high power-to-weight ratio as compared to other rechargeable batteries. |
| Other Batteries | This includes electric bikes using nickel–metal hydroxide (NiMH), silicon, and lithium-polymer batteries. |
| Business-to-Business (B2B) | The sales of e-bikes to business customers such as urban fleet and logistics company, rental/sharing operators, last-mile fleet operators, and corporate fleet operators are considered under this category. |
| Business-to-Customers (B2C) | The sales of electric scooters and motorcycles to direct consumers is considered under this category. The consumers acquire these vehicles either directly from manufacturers or from other distributers and dealers through online and offline channel. |
| Unorganized Local OEMs | These players are small local manufacturers and assemblers of e-bikes. Most of these manufacturers import the components from China and Taiwan and assemble them locally. They offer the product at low cost in this price sensitive market which give them advantage over organized manufacturers. |
| Battery-as-a-Service | A business model in which the battery of an EV can be rented from a service provider or swapped with another battery when it runs out of charge |
| Dockless e-Bikes | Electric bikes that have self-locking mechanisms and a GPS tracking facility with an average top speed of around 15mph. These are mainly used by bike-sharing companies such as Bird, Lime, and Spin. |
| Electric Vehicle | A vehicle which uses one or more electric motors for propulsion. Includes cars, scooters, buses, trucks, motorcycles, and boats. This term includes all-electric vehicles and hybrid electric vehicles |
| Plug-in EV | An electric vehicle that can be externally charged and generally includes all-electric vehicles as well as plug-in hybrids. In this report we use the term for all-electric vehicles to differentiate them from plug-in hybrid electric vehicles. |
| Lithium-Sulphur Battery | A rechargeable battery that replaces the liquid or polymer electrolyte found in current lithium-ion batteries with sulfur. They have more capacity than Li-ion batteries. |
| Micromobility | Micromobility is one of the many modes of transport involving very-light-duty vehicles to travel short distances. These means of transportation include bikes, e-scooters, e-bikes, mopeds, and scooters. Such vehicles are used on a sharing basis for covering short distances, usually five miles or less. |
| Low Speed Electric Vehicls (LSEVs) | They are low speed (usually less than 25 kmph) light vehicles that do not have an internal combustion engine, and solely use electric energy for propulsion. |


Research Methodology
Mordor Intelligence follows a four-step methodology in all its reports.
- Step-1: Identify Key Variables: To build a robust forecasting methodology, the variables and factors identified in Step-1 are tested against available historical market numbers. Through an iterative process, the variables required for market forecast are set and the model is built based on these variables.
- Step-2: Build a Market Model: Market-size estimations for the historical and forecast years have been provided in revenue and volume terms. Market revenue is calculated by multiplying the volume demand with volume-weighted average battery pack price (per kWh). Battery pack price estimation and forecast takes into account various factors affecting ASP, such as inflation rates, market demand shifts, production costs, technological developments, and consumer preferences, providing estimations for both historical data and future trends.
- Step-3: Validate and Finalize: In this important step, all market numbers, variables, and analyst calls are validated through an extensive network of primary research experts from the market studied. The respondents are selected across levels and functions to generate a holistic picture of the market studied.
- Step-4: Research Outputs: Syndicated Reports, Custom Consulting Assignments, Databases & Subscription Platforms


