Market Overview
| Study Period | 2020 - 2031 |
|---|---|
| Forecast Data Period | 2026 - 2031 |
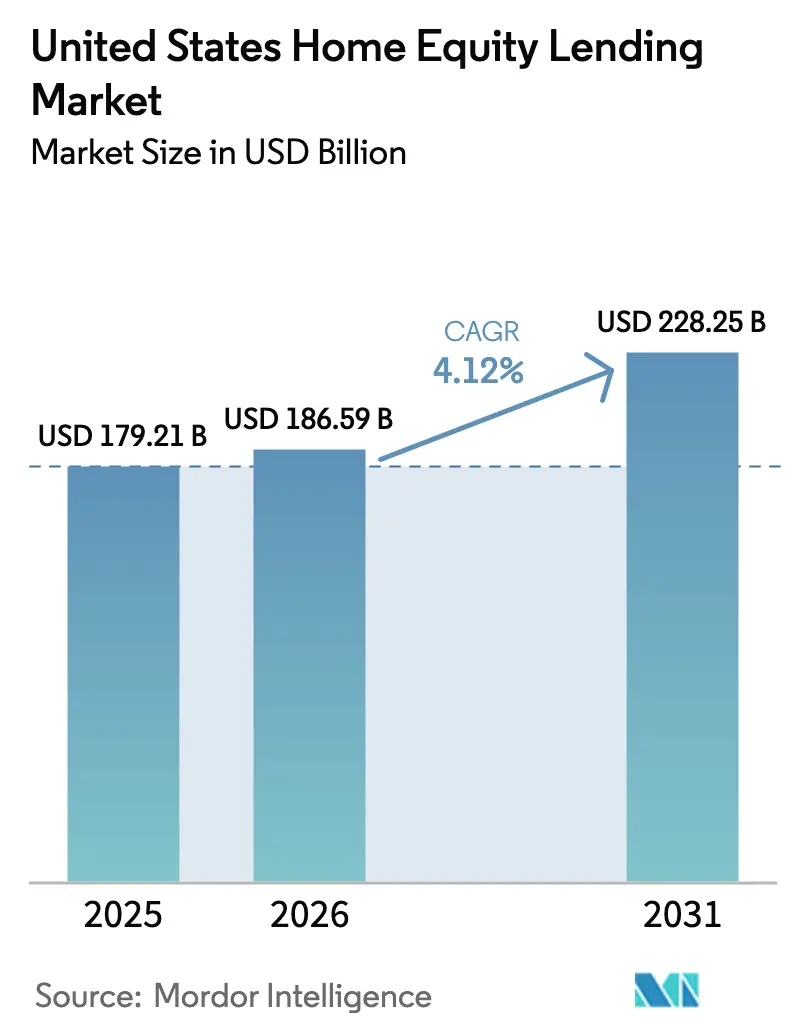
| Base Year Market Size (2025) | USD 179.21 Billion |
| Market Size (2026) | USD 186.59 Billion |
| Market Size (2031) | USD 228.25 Billion |
| Growth Rate (2026 - 2031) | 4.12% CAGR |
| Market Concentration | Medium |
Major Players *Disclaimer: Major Players sorted in no particular order Image © Mordor Intelligence. Reuse requires attribution under CC BY 4.0. | |
United States Home Equity Lending Market Analysis by Mordor Intelligence
The United States home equity lending market size was valued at USD 179.21 billion in 2025 and estimated to grow from USD 186.59 billion in 2026 to reach USD 228.25 billion by 2031, at a CAGR of 4.12% during the forecast period (2026-2031). This growth trajectory aligns with a record pool of tappable home equity in 2024 and a sharp decline in first-lien refinancing, prompting households to favor second-lien solutions that keep their original low-rate mortgages intact. Substantial renovation outlays provide a continuing demand engine for equity-backed borrowing. Digital-first underwriting and e-closing platforms, capable of delivering approvals in minutes and funding in days, are lowering origination costs and widening consumer reach, while an expanding secondary market for closed-end seconds bolsters lender liquidity. Regulatory scrutiny from the Consumer Financial Protection Bureau (CFPB) over fee structures, coupled with the Federal Register’s new HOEPA thresholds in force from 2025, is raising compliance requirements, yet also clarifying the operating environment. Overall, the United States home equity lending market is positioned for disciplined but sustained advance as banks, credit unions, and fintechs refine second-lien offerings, enhance risk controls, and tap investor appetite for home-equity-backed securities.
Key Report Takeaways
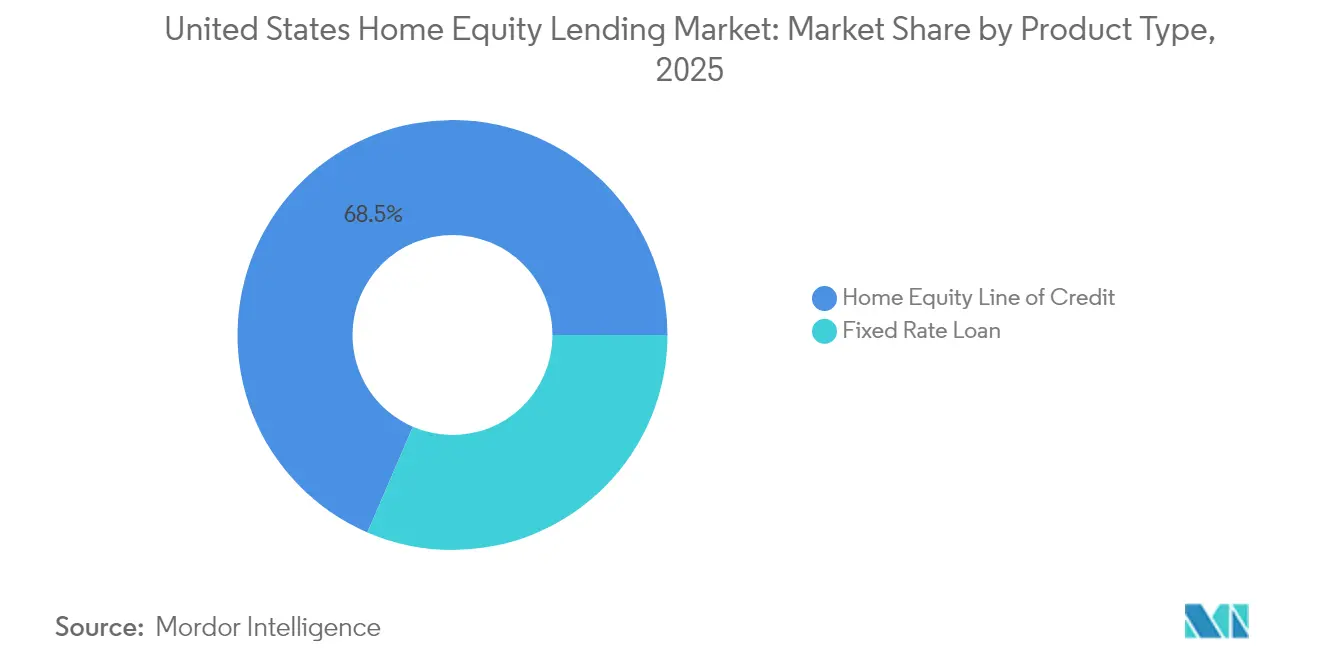
- By product type, Home Equity Lines of Credit (HELOCs) commanded 68.52% of the United States home equity lending market share in 2025 and are projected to register the highest expansion at a 5.34% CAGR through 2031.
- By provider, banks held 70.62% share of the United States home equity lending market size in 2025, whereas the Others segment (fintechs, brokers, and specialty lenders) is forecasted to post an 8.35% CAGR to 2031.
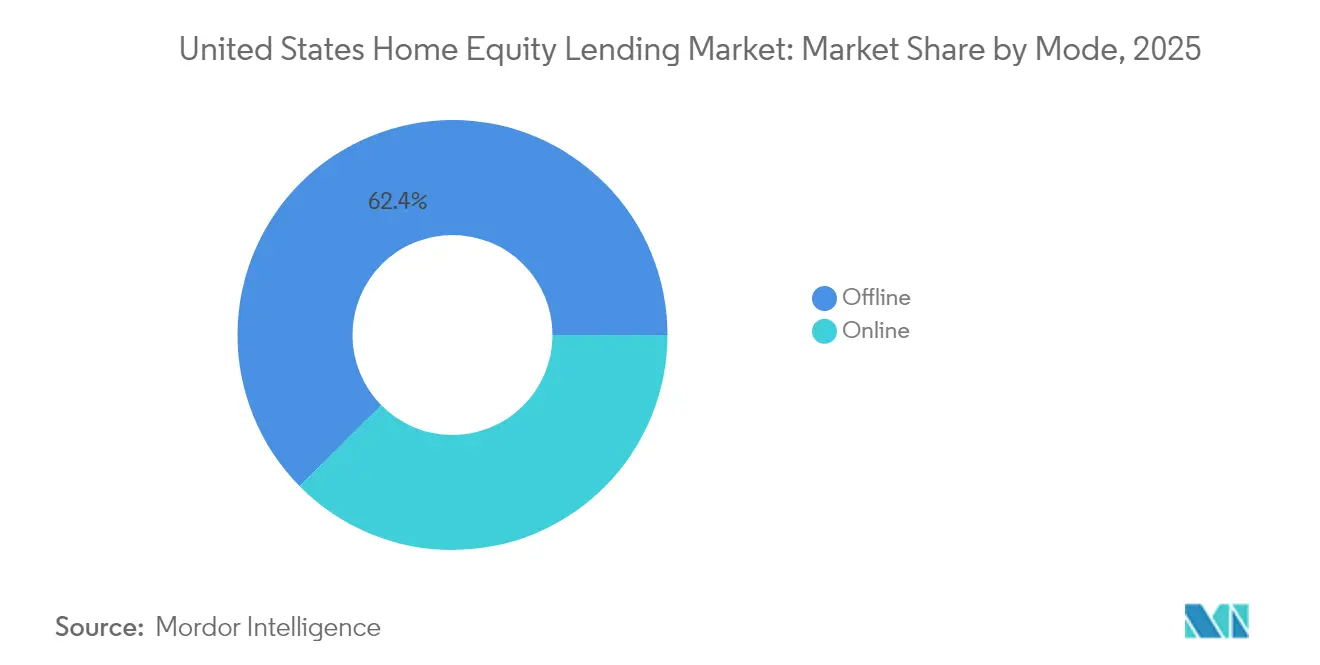
- By mode, offline channels retained 62.41% share of the United States home equity lending market in 2025, yet online platforms are expected to expand at a 8.74% CAGR over the forecast horizon.
- The United States home equity lending market is moderately fragmented. Major players in the market include Bank of America, JP Morgan Chase, Wells Fargo, and U.S Bank.
Note: Market size and forecast figures in this report are generated using Mordor Intelligence’s proprietary estimation framework, updated with the latest available data and insights as of 2026.
United States Home Equity Lending Market Trends and Insights
Drivers Impact Analysis*
| Driver | ( ~ ) % Impact on CAGR Forecast | Geographic Relevance | Impact Timeline |
|---|---|---|---|
| Record-high tappable home-equity pools | +1.8% | Nationwide, concentrated in high-value metros | Long term (≥ 4 years) |
| Post-pandemic home-improvement boom | +1.2% | Nationwide, led by suburban neighborhoods | Medium term (2-4 years) |
| Falling HELOC introductory rates since 2024 | +0.9% | Nationwide | Short term (≤ 2 years) |
| Digital-first origination & e-closing platforms | +0.7% | Nationwide, early adoption in tech-forward states | Medium term (2-4 years) |
| Secondary-market demand for closed-end seconds | +0.5% | National, with institutional investor concentration | Long term (≥ 4 years) |
| Credit-union push into home-equity to replace refi income | +0.4% | Regional, concentrated in credit union strongholds | Medium term (2-4 years) |
| Source: Mordor Intelligence | |||
Record-high Tappable Home-Equity Pools
An unprecedented USD 11.5 trillion in tappable equity is sitting on household balance sheets, yet only 0.41% was accessed in Q1 2025[1]ICE Mortgage Technology, “Mortgage Monitor Report,” icemortgagetechnology.com . Roughly 60% of mortgage holders hold at least USD 100,000 of equity, and most enjoy first-mortgage rates below 4%, generating an attractive credit profile for lenders. Banks and credit unions are mining internal servicing portfolios to identify second-lien prospects, aided by data models that blend property-value analytics with borrower risk parameters. Because only 23% of borrowers return for cash-out refinances, equity lines, and closed-end seconds provide the main liquidity avenue. With households averaging USD 212,000 in tappable equity, this reservoir remains the core fuel for the United States home equity lending market.
Post-pandemic Home-Improvement Boom
Annual remodeling outlays stabilized near USD 600 billion, still 50% above pre-pandemic norms. Elevated spending reflects the median 44-year age of the U.S. housing stock, climate-driven disaster repair needs exceeding USD 49 billion, and homeowners’ preference to upgrade rather than relocate in a low-inventory environment. Roughly 45% of home-equity borrowers cite renovation funding as the primary purpose, and energy-efficiency retrofits add further momentum as federal tax incentives raise return-on-investment calculations. Demographic factors—particularly the growing share of older owners and more racially diverse borrowers—broaden the addressable base. Together, these dynamics secure a medium-term uplift for the United States' home equity lending market.
Falling HELOC Introductory Rates Since 2024
The prime-rate cycle has pushed variable HELOC rates below 7.5%, and market consensus anticipates a mid-6% range as the Federal Reserve eases in 2025[2]Federal Reserve, “Board of Governors Statistical Release H.15,” federalreserve.gov. Lower coupon levels have trimmed the typical payment on a USD 50,000 balance, widening affordability for middle-income households and making debt-consolidation use cases more compelling relative to rotating credit-card balances. Lenders sharpen competitive edges by waiving origination fees and offering promotional margins over prime to accelerate share capture. Rate sensitivity amplifies loan demand in the short term, giving borrowers an incentive to act before the next cycle shift, thereby reinforcing near-term growth in the United States home equity lending market.
Digital-first Origination & E-closing Platforms
Automated underwriting, real-time income verification, and blockchain-based lien indexing enable some fintechs to grant approvals in under five minutes and fund in as few as five days. Figure Technologies, for example, leverages proprietary algorithms and tokenized collateral records to scale originations and cut per-loan processing costs by hundreds of dollars. ICE Mortgage Technology’s Encompass eClose suite integrates document ordering, borrower collaboration, and settlement workflows, shrinking cycle times and boosting pull-through. While 54% of homeowners still express cybersecurity concerns, adoption is rising rapidly among digital-native cohorts, positioning technology capability as a decisive differentiator across the United States home equity lending market.
Restraints Impact Analysis*
| Restraint | ( ~ ) % Impact on CAGR Forecast | Geographic Relevance | Impact Timeline |
|---|---|---|---|
| CFPB & state-level fee-cap scrutiny | −0.8% | Nationwide with state variances | Medium term (2-4 years) |
| Rising property-tax & insurance pressures | −0.5% | High-tax and coastal states | Long term (≥ 4 years) |
| Rate-volatility dampening borrower appetite | -0.6% | National | Short term (≤ 2 years) |
| Cyber-fraud risks on digital HELOC portals | -0.3% | National, with higher impact in digital-first markets | Medium term (2-4 years) |
| Source: Mordor Intelligence | |||
CFPB & State-level Fee-Cap Scrutiny
The CFPB’s 2025 amendments to Regulation Z elevate HOEPA coverage thresholds to USD 26,968 in total loan size and USD 1,348 in points and fees, subjecting more products to additional compliance layers. Texas, meanwhile, retains stringent caps under Article XVI, Section 50 of its state constitution, limiting fee structures and permissible terms. Lenders must bolster governance, audit, and disclosure processes, which add fixed costs that scale less easily for smaller originators[3]Office of the Secretary of State of Texas, “Texas Constitution Article XVI Section 50,” texas.gov. Although the rules aim to protect consumers, the resulting margin compression could restrain the growth tempo of the United States home equity lending market. This could also accelerate market consolidation as smaller lenders struggle to absorb rising compliance costs and operational overhead.
Rising Property-tax & Insurance Pressures
Escalating property-tax levies and insurance premiums, especially in disaster-prone coastal markets, erode available equity by increasing mandatory carrying costs. When escrow obligations climb, back-end debt-to-income ratios tighten, limiting loan size eligibility and suppressing draw volumes. Florida, Louisiana, and California exhibit the sharpest insurance-rate jumps, while Northeastern states show steep tax-bill growth. Over time, these cost pressures curtail the equity borrowers can prudently access, subtracting incremental basis points from the long-term expansion of the United States home equity lending market. Lenders may also face increased risk-layering concerns, as rising non-loan obligations dilute borrower repayment capacity even when credit scores remain stable. This dynamic forces tighter underwriting.
*Our forecasts treat driver/restraint impacts as directional, not additive. The impact forecasts reflect baseline growth, mix effects, and variable interactions.
Segment Analysis
By Product Type: HELOCs Drive Market Evolution
Home Equity Lines of Credit (HELOCs) held 68.52% of the United States home equity lending market share in 2025 and will pace sector growth with a 5.34% CAGR to 2031. This flexible, revolving structure allows borrowers to draw and repay on demand while benefitting from variable-rate resets that historically track prime moves downward, thereby widening utilization amid easing cycles. Fixed-rate home-equity loans remain a strategic option for customers prioritizing payment predictability on lump-sum needs such as tuition outlays or major renovations, preserving a sizable minority slice of the United States home equity lending market size.
Securitization momentum adds fresh liquidity: In 2025, Angel Oak brought the first landmark HELOC securitization to market, validating investor appetite and signaling a maturing secondary outlet for non-bank issuers. Average utilization rates now exceed 90%, with many households drawing substantially at origination rather than treating lines as standby resources. This behavioral pivot underscores rising borrower confidence in variable-rate debt servicing and cements the HELOC format as the fulcrum within the United States home equity lending market.


By Provider: Fintech Disruption Accelerates
Banks captured 70.62% of the 2025 value, leveraging deposit funding and branch networks to set rate and fee benchmarks across the United States home equity lending market. Yet technology-centric entrants are expanding at an 8.35% CAGR to 2031, propelled by data-driven underwriting, remote identity verification, and direct-to-consumer branding. Figure Technologies surpassed USD 10.4 billion in cumulative originations while pursuing a multi-billion-dollar IPO, underscoring investors’ bullish view on fintech scalability. Traditional lenders are responding by integrating APIs and AI-driven credit scoring models into legacy infrastructure. However, their slower innovation cycles and regulatory inertia often constrain full-scale adoption, keeping them behind the curve in consumer experience.
Credit unions, historically reliant on first-mortgage refinances, are reallocating capital to second-lien portfolios to offset the refinancing downturn. Institutions such as Valley Strong Credit Union have originated more than USD 2 billion in home-equity loans via white-label fintech partnerships, illustrating how cooperative lenders combine relationship banking with modern workflow engines. The competitive gap is therefore narrowing, and a hybrid lender-fintech ecosystem is becoming the standard operating model within the United States home equity lending industry. Smaller credit unions are also forming consortia to share technology costs and enhance underwriting capabilities through pooled data platforms. As a result, regional players are gaining agility and scale without sacrificing their local engagement advantage.
By Mode: Digital Transformation Reshapes Access
Offline channels still accounted for 62.41% of 2025 originations, reflecting borrower comfort with in-person consultations for complex financial transactions. Even so, online platforms are forecast to grow at a 8.74% CAGR as automated document ingestion, embedded e-signature, and AI-driven stipulation clearing shorten cycle times. Rocket Mortgage’s AI-based Rocket Logic suite processes nearly 1.5 million documents per month and trims closing windows by 25%, proving the scale efficiencies attainable through systemization. Moreover, digital originations often yield higher per-loan profitability due to reduced staffing and processing overhead. This margin advantage is prompting even traditional lenders to reengineer customer journeys around hybrid-digital workflows.
Community banks and credit unions safeguard their niche by offering blended models that couple self-service portals with loan-officer guidance. Solutions like Coviance’s Home Equity Express, adopted by more than 425 local institutions, exemplify how smaller lenders can deliver rapid approvals without surrendering personal touch. As digital fluency rises across demographics, a phygital strategy, where borrowers toggle seamlessly between online interfaces and human advice, will define the optimal service blueprint for the United States home equity lending market. These institutions are also investing in digital CRM systems and omni-channel support to deepen engagement and cross-sell opportunities. The ability to blend empathy-driven relationship management with tech-enabled efficiency is becoming a core differentiator.
Geography Analysis
California and Northeast corridor states amassed the largest absolute equity gains in 2024, with Connecticut, New Jersey, and Delaware leading median home-equity growth following sustained property-value appreciation and limited housing inventory. Although these coastal markets boast sizable balances, elevated property taxes and insurance costs temper borrowing capacity. Texas, governed by Article XVI, Section 50 fee caps and strict loan-to-value ceilings, compels lenders to tailor products within narrower compliance guardrails, thus moderating penetration relative to underlying demand.
Florida and Arizona demonstrate robust momentum owing to inbound migration, favorable homestead protections, and volume growth from retirees unlocking equity for lifestyle and medical expenditures. The Mountain West—Colorado, Utah, and Nevada—benefits from amenable regulation and continued job inflows that sustain home-price resilience, enticing firms like Splitero to extend equity-sharing platforms into these territories. Nonetheless, softening price trends in select Floridian metros and rising insurance premiums present nascent headwinds.
Midwestern and Southeastern states offer a mixed picture: median home values are lower, but strong credit-union density drives relationship-based lending that supports home-equity usage for deferred maintenance of an aging housing stock. Rural counties lag in digital-access infrastructure, inhibiting online application volume, whereas urban hubs leverage fintech penetration to deliver competitive pricing. Collectively, these regional dynamics ensure diversified growth vectors that underpin the nationwide expansion of the United States home equity lending market.
Competitive Landscape
The United States home equity lending market features moderate concentration. Large depository institutions—JPMorgan Chase, Wells Fargo, and Bank of America—capitalize on cross-sell capabilities, branch visibility, and low-cost deposits to sustain origination leadership. JPMorgan Chase, for instance, logged more than USD 1 billion in home-lending revenue in Q2 2024 while introducing new equity-access products aligned with mobile-banking channels.
Fintech innovators intensify rivalry by coupling frictionless onboarding with alternative securitization pipelines. Figure Technologies applies blockchain to automate lien perfection and investor settlement, achieving five-minute approval metrics that recalibrate customer expectations. Angel Oak’s 2025 issuance of a stand-alone HELOC structured note diversified secondary-market take-out options and validated appetite among fixed-income managers for non-agency paper, thereby lowering capital costs for tech-enabled originators.
Strategic M&A accelerates scale economics: Rocket Companies’ USD 9.4 billion all-stock acquisition of Mr. Cooper united a combined servicing portfolio exceeding USD 2.1 trillion, granting the entity roughly one in six U.S. mortgages. Consolidation pressures smaller lenders to seek white-label partnerships or exit the segment, while vertical integrations that pair real-estate search, brokerage, and lending suggest a future landscape dominated by diversified, technology-centric platforms that continually reshape the contours of the United States home equity lending market.
United States Home Equity Lending Industry Leaders
Bank of America
JPMorgan Chase
Wells Fargo
U.S. Bank
PNC Financial Services
- *Disclaimer: Major Players sorted in no particular order

Recent Industry Developments
- May 2025: Angel Oak completed the first stand-alone HELOC securitization, broadening liquidity channels for second-lien lenders.
- April 2025: PHH Mortgage rolled out EquityIQ®, a reverse-mortgage alternative for borrowers aged 55+ with no upfront mortgage-insurance premium.
- March 2025: Rocket Companies agreed to acquire Mr. Cooper in an all-stock deal valued at USD 9.4 billion, creating a USD 2.1 trillion servicing giant.
- January 2025: The CFPB’s revised Regulation Z thresholds came into effect, raising HOEPA triggers and expanding fee-cap coverage.


United States Home Equity Lending Market Report Scope
Home equity loans are a particular kind of loan where the borrower pledges the value of their house as security. This report aims to offer a detailed analysis of the US Home Equity Lending Market. It concentrates on the market dynamics, emerging trends in the segments and regional markets, and insights into various product and application types. Also, it focuses on the key players and the competitive landscape in the market. US Home Equity lending Market is segmented by type (Fixed rate loans and home equity lines of credit), by Service Providers (Commercial banks, Financial Institutions, Credit Unions, and other creditors), and by Mode (Online and Offline). The report offers market size and forecast in value (USD billion) for all the above segments.
By Product Type
| Fixed Rate Loans |
| Home Equity Line of Credit |
By Provider
| Banks |
| Credit Unions |
| Non-Banking Financial Institutions |
| Others (Fintech, Brokers, etc.) |
By Mode
| Online |
| Offline |
| By Product Type | Fixed Rate Loans |
| Home Equity Line of Credit | |
| By Provider | Banks |
| Credit Unions | |
| Non-Banking Financial Institutions | |
| Others (Fintech, Brokers, etc.) | |
| By Mode | Online |
| Offline |


Key Questions Answered in the Report
What is the current value of the United States home equity lending market?
The market stood at USD 186.59 billion in 2026 and is projected to reach USD 228.25 billion by 2031.
How fast is the United States home equity lending market expected to grow?
The forecast compound annual growth rate (CAGR) is 4.12% between 2026 and 2031.
Which product leads the United States home equity lending market?
HELOCs held 68.52% market share in 2025 and are expected to record the fastest growth through 2031.
Why are homeowners choosing HELOCs over refinancing?
Many borrowers prefer to retain sub-4% first-lien mortgage rates while tapping equity through second-lien lines that offer flexible draw structures.
Page last updated on:


