Market Overview
| Study Period | 2020 - 2031 |
|---|---|
| Forecast Data Period | 2026 - 2031 |
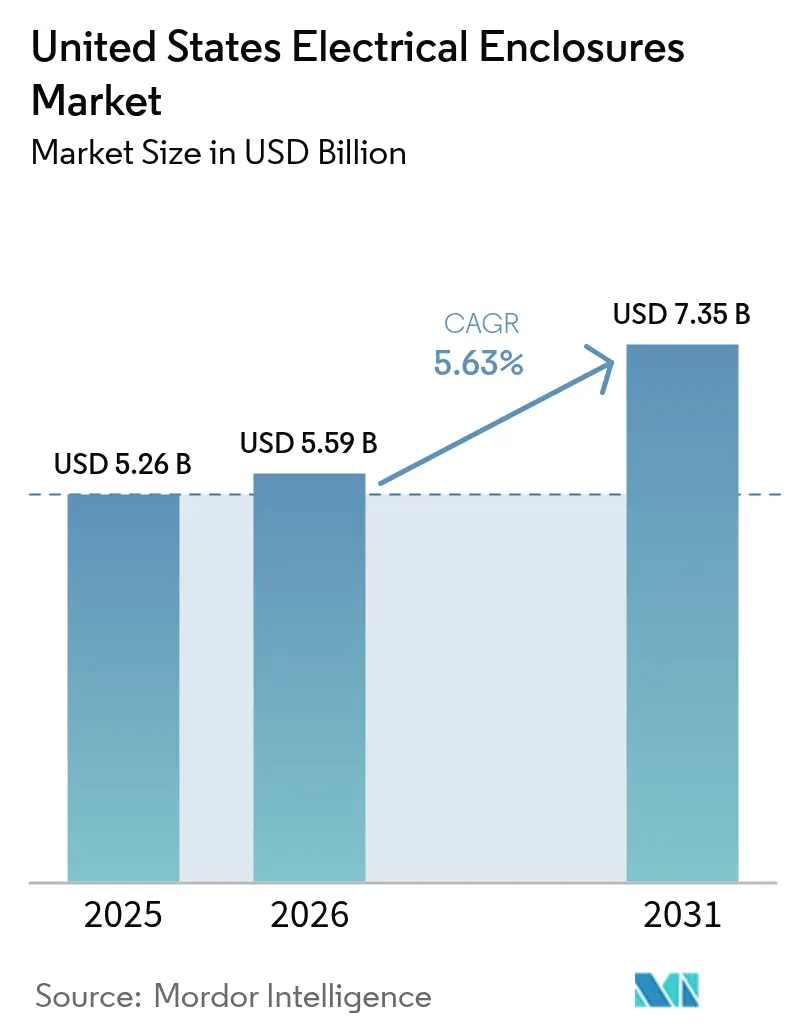
| Base Year Market Size (2025) | USD 5.26 Billion |
| Market Size (2026) | USD 5.59 Billion |
| Market Size (2031) | USD 7.35 Billion |
| Growth Rate (2026 - 2031) | 5.63% CAGR |
| Market Concentration | Medium |
Major Players *Disclaimer: Major Players sorted in no particular order Image © Mordor Intelligence. Reuse requires attribution under CC BY 4.0. | |
United States Electrical Enclosures Market Analysis by Mordor Intelligence
The United States electrical enclosures market size was valued at USD 5.26 billion in 2025 and estimated to grow from USD 5.59 billion in 2026 to reach USD 7.35 billion by 2031, at a CAGR of 5.63% during the forecast period (2026-2031). Unprecedented federal funding for grid resilience, surging utility-scale solar and battery projects, and rapid electrification of transportation are expanding addressable demand, while data-center power densities are pushing designers toward higher-value modular switchgear cabinets. Utilities now specify stainless-steel NEMA 4X enclosures rated for hurricane winds, battery developers require UL 508A cabinets with integrated fire-suppression controls, and gigafactory projects are pulling enclosure supply chains into the Midwest. Meanwhile, reshoring incentives under Section 45X are accelerating domestic sheet-metal capacity, compressing lead times from twelve to six weeks, and encouraging suppliers to embed IoT sensors for predictive maintenance. Volatile metals pricing and longer UL certification cycles remain structural headwinds, yet rising premiumization, specification complexity, and federal content rules allow manufacturers to preserve margins despite raw-material swings.
Key Report Takeaways
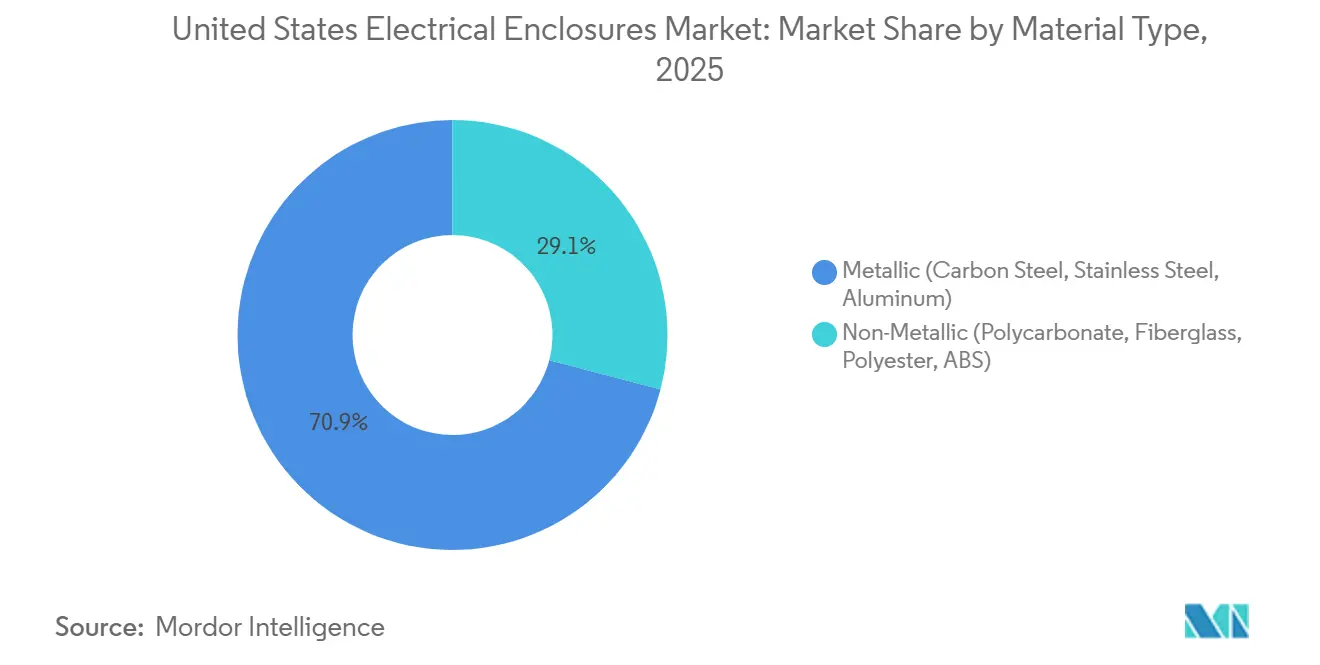
- By material, metallic enclosures led with 70.92% of the United States electrical enclosures market share in 2025, while non-metallic variants are expanding at a 6.16% CAGR through 2031.
- By form factor, free-size / full-size (above 50 L) accounted for 33.16% of the US electrical enclosures market size in 2025, and modular or configurable systems are projected to grow at a 6.41% CAGR through 2031.
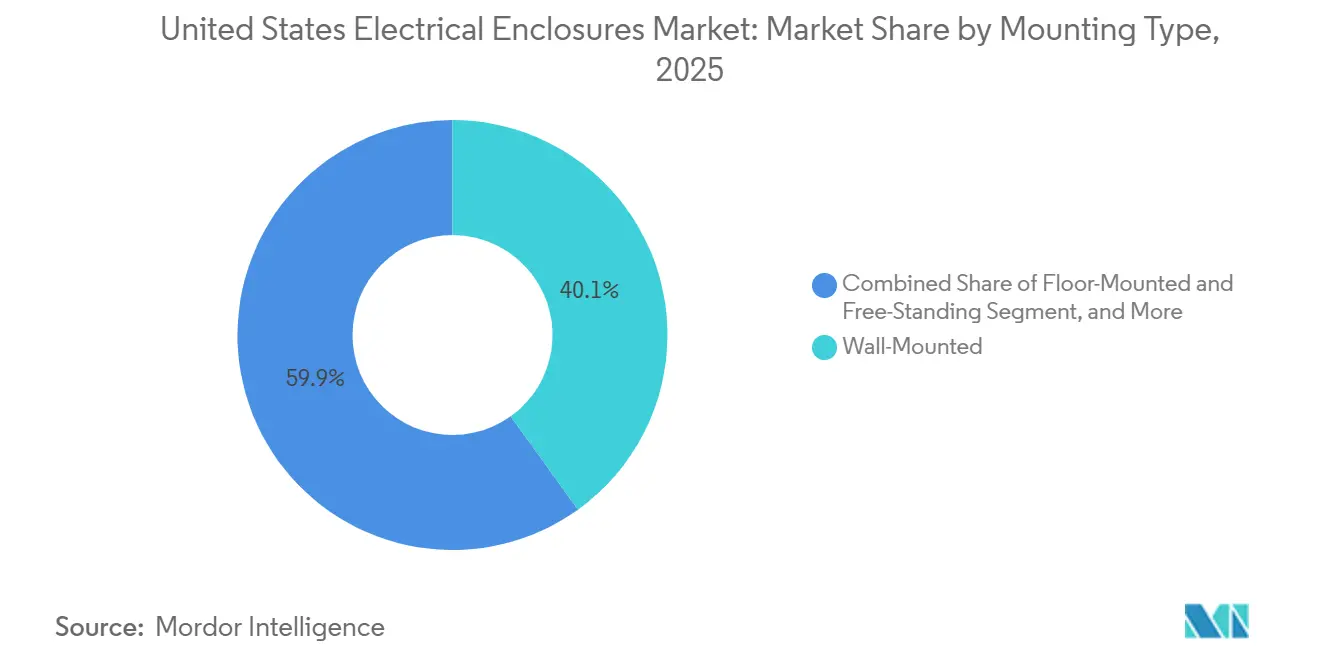
- By mounting type, wall-mounted configurations held 40.09% share of the US electrical enclosures market size in 2025, whereas underground or pad-mounted systems are advancing at a 6.13% CAGR through 2031.
- By end-user industry, energy and power accounted for 27.93% of the US electrical enclosures market share in 2025, while data centers and telecom installations are expected to grow at the fastest rate, with a 7.95% CAGR, from 2025 to 2031.
Note: Market size and forecast figures in this report are generated using Mordor Intelligence’s proprietary estimation framework, updated with the latest available data and insights as of 2026.
United States Electrical Enclosures Market Trends and Insights
Drivers Impact Analysis*
| Driver | (~) % Impact on CAGR Forecast | Geographic Relevance | Impact Timeline |
|---|---|---|---|
| Record Grid-Hardening CAPEX Under GRIP and IIJA | +1.2% | National, concentrated in Texas, California, and Northeast ISO regions | Medium term (2-4 years) |
| Accelerated Utility-Scale Solar and Battery Build-out | +1.4% | National, led by Texas, California, Arizona, and Florida | Short term (≤ 2 years) |
| Rapid Electrification of Commercial Fleet Depots | +0.9% | Urban metros in California, New York, and Illinois | Medium term (2-4 years) |
| Reshoring Boost From 45X Domestic Manufacturing Credits | +0.7% | Midwest battery-belt states | Long term (≥ 4 years) |
| Mandated Cyber-Security Certification (UL 2900-2-2) | +0.5% | Critical-infrastructure sectors nationwide | Long term (≥ 4 years) |
| AI-Driven Condition-Monitoring Smart Enclosures | +0.6% | Data centers and advanced manufacturing | Medium term (2-4 years) |
| Source: Mordor Intelligence | |||
Record Grid-Hardening CAPEX Under GRIP and IIJA
Federal programs are reshaping enclosure specifications. The Grid Resilience and Innovation Partnerships initiative allocated USD 10.5 billion through 2025, obliging utilities to swap fiberglass housings for stainless-steel NEMA 4X cabinets that withstand 150-mph winds and direct flame exposure.[1]U.S. Department of Energy, “Biden-Harris Administration Announces USD 10.5 Billion for Grid Resilience and Innovation Partnerships,” energy.gov The Infrastructure Investment and Jobs Act added USD 65 billion for grid modernization, with about one-fifth earmarked for ballistic-rated enclosures protecting vital switching stations. California utilities now install underground pad-mount transformers in concrete-reinforced vaults, lifting demand for custom steel cabinets by 31% in 2025. Average selling prices for substation enclosures rose from USD 4,200 in 2023 to USD 5,800 in 2026 as corrosion-resistant alloys and arc-flash sensors become standard. Independent system operators in Texas and the Northeast mandate remote-monitoring gateways housed in secondary weatherproof boxes, effectively doubling enclosure counts per substation.
Accelerated Utility-Scale Solar and Battery Build-out
Renewables are the fastest-growing customer group for large free-standing enclosures. Developers added 43.4 GW of utility-scale solar in 2026, each megawatt requiring up to three inverter cabinets plus a combiner box rated for -40 °C to +70 °C thermal cycling.[2]U.S. Energy Information Administration, “Utility-Scale Solar and Battery Storage Capacity Additions,” eia.gov Battery projects supplied another 24 GW, and every lithium-ion container now specifies a UL 508A-listed stainless-steel fire-control panel with NEMA 4 seals. The Inflation Reduction Act’s tax credits are compressing project schedules, so builders favor pre-assembled skid-mounted enclosures that cut on-site labor 40%.[3]Solar Energy Industries Association, “Solar Market Insight Report 2024 Q2,” seia.org Texas and California dominate new solar capacity, boosting demand for lightweight aluminum housings that trim crane costs by 35%. Emerging offshore wind farms require marine-grade 316L stainless cabinets with IP67 ratings, priced 60%-80% above land-based equivalents.
Rapid Electrification of Commercial Fleet Depots
Transit agencies and logistics operators are installing megawatt-scale chargers that multiply enclosure counts. The National Electric Vehicle Infrastructure program committed USD 7.5 billion through 2025, with depots absorbing 38% of funds.[4]U.S. Department of Transportation, “National Electric Vehicle Infrastructure Program,” transportation.gov A 50-bay electric-bus yard needs a dozen or more outdoor cabinets for load management and emergency disconnects, versus just two at a diesel site. California’s Advanced Clean Fleets rule pushes seaport drayage operators toward zero-emission trucks, driving demand for NEMA 3R power-distribution enclosures priced USD 3,200-USD 5,100 each. Justice40 allocations focus investments in space-constrained urban lots, favoring compact wall-mounted boxes that free floor area .
Reshoring Boost From 45X Domestic Manufacturing Credits
Section 45X gives battery and solar supply chains up to USD 0.07 per kWh in production tax credits, triggering 23 gigafactory announcements worth USD 89 billion. Each facility orders 400-600 industrial-control cabinets for cleanroom HVAC and robotics, creating a captive market insulated from distributor channels. Nucor’s USD 1.7 billion Kentucky mini-mill now feeds enclosure plants within four weeks, saving USD 120 per ton in freight. Buy America clauses require domestic melting and fabrication, sidelining imports that once held 18% share. Fabricators invest in laser-cutting and robotic welding, trimming labor content 28% and preserving price competitiveness despite higher wages.
Restraints Impact Analysis*
| Restraint | (~) % Impact on CAGR Forecast | Geographic Relevance | Impact Timeline |
|---|---|---|---|
| Steel and Aluminum Price Volatility | -0.8% | Midwest manufacturing hubs | Short term (≤ 2 years) |
| Slower Non-Residential Construction Recovery 2024-2025 | -0.6% | Secondary metro markets nationwide | Short term (≤ 2 years) |
| Escalating UL 508A / NEMA 4X Certification Costs | -0.4% | National, small fabricators most affected | Medium term (2-4 years) |
| Lack of Wireless-Sensor Interoperability Inside Metal Cabinets | -0.3% | Industrial sectors nationwide | Long term (≥ 4 years) |
| Source: Mordor Intelligence | |||
Steel and Aluminum Price Volatility
Hot-rolled coil swung from USD 742 per ton in January 2024 to USD 982 in August before settling near USD 814 in December 2025 as tariff exemptions lapsed and capacity restarted. Aluminum ranged USD 2,340-USD 2,890 per metric ton amid bauxite supply shocks. Small fabricators without hedging saw gross margins drop six points and eleven regional players exited or merged in 2025. Nickel surcharges on stainless 304/316 added USD 0.42 per pound, inflating a standard NEMA 4X box from USD 1,850 to USD 2,310, prompting food processors to postpone upgrades.
Slower Non-Residential Construction Recovery 2024-2025
Non-residential spending grew just 1.2% in 2024 and 1.8% in 2025, prolonging retrofit cycles for HVAC controls and lighting panels. Electrical contractors extended service life of indoor NEMA 1 enclosures from 18 to 22 years, cutting aftermarket volumes 14% below pre-pandemic norms. Office-to-residential conversions reuse existing electrical rooms, further trimming demand. Vacancy above 18% in major metros constrains tenant-improvement budgets that historically absorbed 25% of small-box sales. Warehouse builds rise, but they favor large free-standing gear over margin-rich wall cabinets.
*Our forecasts treat driver/restraint impacts as directional, not additive. The impact forecasts reflect baseline growth, mix effects, and variable interactions.
Segment Analysis
By Material Type: Stainless Grades Gain in Harsh Environments
Metallic solutions continued to anchor revenues in the United States electrical enclosures market, generating 70.92% of 2025 sales through carbon-steel and stainless-steel variants that satisfy the toughest utility and refinery specifications. Carbon-steel cabinets still dominate indoor NEMA 1 control panels because cost per cubic liter remains unmatched, although their susceptibility to rust forces utilities to demand galvanizing or powder-coating upgrades for any outdoor deployment that faces moisture or salt spray. Buyers in coastal regions now insist on stainless-steel 304 or 316L alloys, since a 2025 Gulf Coast operator survey showed 68% adoption for new motor-control centers, which eliminates repetitive five-year corrosion replacements and justifies higher purchase prices. Aluminum enclosures captured niche renewable projects where a 35% weight savings reduces crane and logistics fees, and recent alloy improvements are closing the thermal-conductivity gap that once constrained passive cooling above 1,500 V DC. The combined effect of these trends is that metallic housings will hold their leadership position, yet value migration toward premium stainless grades is expected to lift the average selling price within the United States electrical enclosures market for materials.
Non-metallic polycarbonate, fiberglass, and polyester boxes are projected to advance 6.16% annually through 2031, outpacing the overall United States electrical enclosures market despite their 40% to 60% price premium over painted steel. Food-processing and pharmaceutical companies prefer polycarbonate’s crevice-free interiors, which survive aggressive caustic wash-down procedures without harboring bacteria, thereby eliminating costly electropolishing steps still required for stainless cabinets in similar settings. Fiberglass-reinforced polyester cabinets rated NEMA 4X increasingly appear in wastewater facilities, because hydrogen-sulfide off-gassing corrodes steel in only three years, whereas fiberglass lasts two decades without structural degradation. Radio-frequency transparency provides an additional advantage: polycarbonate walls allow Wi-Fi and Bluetooth sensors to transmit freely, which removes the need for special antenna windows and trims installation labor 25% compared with metal equivalents. Consequently, the non-metallic segment will continue stealing share in hygiene-critical or IoT-intensive environments, even though overall tonnage remains firmly weighted toward metallic alternatives.


By Form Factor: Modular Systems Reshape Supply Chains
Free-size enclosures above 50 liters accounted for 33.16% of 2025 shipments because utility switchgear, data-center power distribution units, and industrial motor-control centers demand tall vertical cabinets that house breakers, busbars, and intelligent relays. Nonetheless, modular configurable platforms represent the fastest growth trajectory at a 6.41% compound rate, since build-to-order kits permit fabricators to stock a lean menu of base frames, doors, and mounting plates that can be recombined into 240 dimensional permutations within 48 hours. Data-center operators favor these modular enclosures because 10-megawatt expansions must be delivered within 90-day windows, so welding-free snap-together frames shave construction schedules that historically stretched to four months. Electrical distributors also like the approach, as modularity reduces dead inventory by allowing a single side panel or plinth to fit multiple depth configurations across a customer’s installed base. As more industries shift toward mass customization, the United States electrical enclosures market size for modular cabinets will keep expanding, adding predictable recurring revenue for laser-cutting and powder-coating subcontractors that specialize in late-stage personalization.
Compact enclosures between 10 liters and 50 liters remain indispensable for EV charging pedestals, building-automation controllers, and 5G remote radio heads, a segment that still managed 4.9% growth in 2025 despite macroeconomic headwinds. The smallest sub-10-liter boxes posted a modest 3.2% increase because retrofit opportunities in suburban housing are becoming saturated, yet smart-home integrators continue specifying IP65 plastics that accommodate Zigbee and Z-Wave radios without costly antenna modifications. Wall-mounted designs dominate aftermarket replacements inside commercial mechanical rooms where floor space carries a premium, whereas skid-mounted floor-standing assemblies lead on greenfield solar or battery sites where open pads allow generous footprints. Underground vaults, discussed separately, are now seeing their component plates standardized for modular interiors as well, enabling utilities to repair damaged sections without unearthing entire concrete housings. The overarching message is that flexibility and compressible lead times drive purchasing decisions more than absolute material cost, so form-factor innovation is translating directly into competitive differentiation within the United States electrical enclosures market.
By Mounting Type: Underground Vaults Rise With Grid Hardening
Wall-mounted cabinets preserved their 40.09% market share in 2025 because legacy buildings, retrofit energy-management projects, and telecom central offices universally favor vertical installation that conserves valuable floor real estate and routes conduit overhead with minimal disruption. These boxes also dominate pharmaceutical cleanrooms, where stainless-steel NEMA 4X units must withstand daily wash-downs yet fit flush against partition walls to eliminate dust-collecting ledges, fulfilling recent FDA guidance that recommends IP66 ratings for aseptic zones . Manufacturers are enhancing wall units with tool-less hinges, quarter-turn latches, and quick-change gland plates, which together slash field labor by 20% relative to older gasketed designs requiring multiple fasteners per side panel. Even so, utilities and municipalities are pivoting toward buried infrastructure, thereby accelerating demand for pad-mount configurations that remove visual clutter and boost storm resilience, challenging the dominance of traditional wall models. As public agencies commit to more aggressive undergrounding timetables, wall-mounted unit share is projected to erode slowly, although absolute shipments will still rise in tandem with broader replacement cycles across commercial facilities.
Underground and pad-mounted enclosures are growing at a 6.13% compound pace because wildfire mitigation in California and hurricane hardening in Florida both require relocating transformers below grade, inside sealed stainless or powder-coated steel vaults capable of surviving submersion events. Pacific Gas and Electric alone plans to bury 10,000 miles of distribution line by 2026, and each mile demands four to six vaults priced between USD 11,000 and USD 16,000, meaning a single regional program shifts hundreds of millions in enclosure value. Florida Power and Light added 3,400 vaults in 2025 featuring 150-mile-per-hour wind ratings and corrosion-resistant epoxy coatings, setting a coastal standard other southeastern utilities are now copying. Free-standing switchgear cabinets remain prevalent in greenfield factories and data centers, but even there designers are integrating aisle-containment structures that merge enclosures with hot-aisle barriers, trimming cooling loads by up to 24% while enabling service personnel to access breakers without donning arc-flash suits. Pole-mounted housings will continue declining as neighborhood aesthetic ordinances prohibit new overhead lines, thus reinforcing the structural growth advantage enjoyed by underground installations within the United States electrical enclosures market share for mounting types.

By End-User Industry: Data Centers Outpace Traditional Sectors
Energy and power projects contributed 27.93% of 2025 demand, spanning utility substations, wind-farm collector stations, and solar inverter pads that require large free-standing NEMA 3R switchgear rows often exceeding seven meters in length. Substation modernization under the Infrastructure Investment and Jobs Act obliges utilities to specify ballistic-rated steel skins, dual-compartment designs with segregated control wiring, and embedded fiber-optic arc-flash sensors, collectively adding 35% to bill-of-material costs compared with 2019 baseline cabinets but boosting safety credentials correspondingly. By contrast, data-center and telecom buyers are registering the fastest 7.95% CAGR because artificial-intelligence servers draw 25 kW per rack today and could hit 40 kW by 2030, which requires twice the number of busway tap boxes and remote power panels per megawatt of IT capacity. Telecom carriers deployed 18,000 5G small cells in 2025, each populated with two or three outdoor IP66 cabinets for power supplies, optical splitters, and edge compute nodes, thereby multiplying SKU complexity and logistics touches that favor vendors with nationwide service fleets. Industrial manufacturing, transportation electrification, and food or pharma plants are advancing steadily at mid-single-digit rates, but none match the enclosure intensity per square foot that hyperscale cloud or colocation providers now command.
Oil and gas capital budgets remain focused on mid-life asset integrity, which sustains a healthy market for explosion-proof NEMA 7 cast-aluminum housings rated for Class I Division 1 atmospheres on Gulf Coast platforms and West Texas shale pads. Process manufacturers are deploying distributed control architectures that replace centralized motor-control centers with IP65 edge boxes mounted directly on robotic cells, reducing copper runs 60% and enabling line reconfigurations without lengthy downtime, a trend that feeds incremental volume into the United States electrical enclosures market size for compact housings. Transportation agencies, backed by National Electric Vehicle Infrastructure funding, are building megawatt charging hubs where each 50-bay depot needs a dozen NEMA 3R cabinets for load management and utility metering. Food and beverage processors continue adopting non-metallic enclosures in wet zones, because fiberglass eliminates rust and polycarbonate outperforms stainless in caustic foam-cleaning cycles, generating premiums that offset raw-material cost inflation. The end-user mosaic therefore illustrates a clear shift from heavy centralized industrial plants toward distributed energy and digital infrastructure, realigning sales channels and product roadmaps across the United States electrical enclosures market share by application.
Geography Analysis
Texas retained its leadership in the United States electrical enclosures market during 2025, claiming roughly 16% to 18% of national revenue because 12.7 gigawatts of utility-scale solar were commissioned alongside aggressive midstream oil infrastructure projects that both require rugged hazardous-location housings and large inverter cabinets. Developers along the Permian Basin favor aluminum enclosures to cut crane costs on remote lease roads, while solar EPC firms near Austin order lightweight skid-mounted switchgear that can be deployed in fewer than three hours once delivered onsite. Houston petrochemical complexes choose 316L stainless boxes equipped with explosion-proof rated ventilation glands, since sulfuric vapors corrode painted carbon steel in under one operational year, raising maintenance budgets if inferior materials are used. Regional competition among job shops remains intense, yet substantial purchasing volumes encourage global suppliers to locate satellite finishing lines inside the state, shortening lead times for custom orders. Accordingly, Texas functions as both the largest consumer and the most competitive production cluster within the United States electrical enclosures market.
California followed with approximately 14% to 16% share, propelled by statutory wildfire-mitigation undergrounding mandates that force utilities to bury 10,000 miles of distribution feeders and install 8,200 stainless pad-mount transformer vaults between 2023 and 2026. San Joaquin Valley solar farms continue specifying aluminum housings rated for 70 °C ambient temperatures, whereas coastal data centers near Silicon Valley demand IP67 stainless cabinets fitted with integrated liquid cooling to safeguard AI accelerators operating at unprecedented thermal outputs. Stringent seismic codes in both Northern and Southern California add bracing kits, vibration isolators, and dual latches to every floor-standing enclosure, pushing average box prices 22% higher than national medians. Local environmental regulations further require powder-coat chemistries with ultra-low volatile organic compound emissions, limiting approved coating suppliers and elongating procurement cycles. Despite elevated cost structures, California remains a premium volume engine because virtually all infrastructure projects include advanced sensorization that mandates secondary communication cabinets alongside primary power gear.
The Southeast and Mountain West now deliver the highest projected growth, each running above 6% CAGR through 2031, yet for markedly different reasons. Florida Power and Light’s USD 17 billion storm-hardening program installed 3,400 underground vaults in 2025 alone, featuring 150-mile-per-hour wind ratings and epoxy coatings that guarantee a 35-year service life in salt-spray coastal environments. Meanwhile, Arizona and Nevada added 4.2 gigawatts of solar capacity in 2025, and every megawatt commanded multiple NEMA 3R inverter enclosures plus combiner boxes, which collectively lifted regional order volumes for lightweight aluminum housings that dissipate heat effectively under desert sun. Data-center campuses flocking to Nevada’s low-cost hydropower now expect aisle-containment-ready switchgear that integrates fire detection, thermal management, and cyber-secure gateway modules, premiumizing the local demand mix above historical averages. Northern markets such as Oregon and Washington are smaller in absolute dollars but accelerating quickly as offshore wind cable-termination houses adopt marine-grade 316L stainless cabinets sealed for submersion cycles over the turbine lifetime. Together these geographic shifts underline a fragmentation into at least ten specification clusters, complicating national inventory strategy yet creating opportunities for regional specialists focused on climate-specific enclosure technologies.
Competitive Landscape
The five largest suppliers, Schneider Electric, ABB, Eaton, Hubbell, and nVent, collectively control between 40% and 45% of 2025 United States electrical enclosures market revenue, a share that signals moderate concentration but still leaves more than half the market for regional or niche competitors. Schneider’s new USD 180 million Fort Worth plant outputs 120,000 cabinets annually, and its digital thread from laser cutting through robotic welding enables four-week delivery cycles that undercut Asian lead times by two-thirds while meeting strict Buy America content thresholds. ABB differentiates through embedded Smart Sensor packages that measure vibration, temperature, and humidity inside motor-control centers, providing predictive-maintenance analytics that customers value at a 15% to 20% price premium over unmonitored boxes. Eaton’s acquisition of Stahlin extends its portfolio into polycarbonate and fiberglass, which opens higher-margin sales channels with food-processing and wastewater clients who pay 40% to 60% more for corrosion-resistant solutions. Each incumbent is simultaneously integrating vertically, purchasing sheet-metal job shops and powder-coat lines to secure capacity amid volatile metals pricing, a strategy that protects gross margins even as nickel and aluminum fluctuate week by week.
Specialist fabricators remain essential, exploiting white spaces ignored by global majors who rarely pursue UL 1203 flameproof approvals or IPX9K wash-down certifications because annual demand volumes are comparatively modest. Adalet rules the hazardous-location niche with cast-aluminum flameproof housings certified for Class I Division 1, and its engineering team can configure custom hub locations in under five days, which aligns with oil-and-gas maintenance shutdown windows. Allied Moulded dominates wash-down polycarbonate enclosures for USDA environments, delivering gasketless designs that withstand 1,500 psi cleaning at 180 °F without microbe-harboring crevices, attributes that scored approval in 2025 audits at several Fortune 100 food brands. Emerging 3D-printing firms offer 48-hour turnaround on carbon-fiber reinforced nylon boxes, competing not on volume but on rapid prototype iterations for aerospace or defense contractors seeking one-off configurations otherwise costing thousands in tooling. In parallel, low-cost challengers from Mexico and China attempt “final assembly” in southern U.S. border zones, yet the 2025 USTR ruling requires substantial transformation, defined as welding, powder coating, and functional testing, to occur domestically, curtailing this circumvention route and defending incumbent share.
Technology roadmaps concentrate on thermal innovation and cyber-secure gateway integration, because higher AI rack densities and grid-connected charger deployments push traditional passive cooling beyond safe operating limits. Rittal’s Blue e+ phase-change cooling module, for example, stores latent heat during short spikes before venting it through high-efficiency heat sinks, cutting energy consumption 35% relative to compressor systems while halving enclosure footprint, an attribute prized by hyperscale data centers pursuing PUE targets below 1.15 . nVent and Siemens now co-engineer cabinets embedding MindSphere edge analytics, offering real-time health dashboards that feed predictive-maintenance platforms in twelve hyperscale facilities, and early pilots show breaker fault events detected up to six weeks beforehand, reducing unplanned downtime dramatically. Patent filings also focus on RF-transparent plastics; Fibox secured multiple claims covering low-loss polycarbonate blends enabling internal Wi-Fi radios without external antennas, saving installers thirty minutes per cabinet and eliminating potential ingress weak points. Competitive intensity is therefore shifting from mere fabrication capacity toward integrated digital functionality, solidifying the United States electrical enclosures market as a proving ground for smart, resilient, and domestically manufactured infrastructure hardware.
United States Electrical Enclosures Industry Leaders
Schneider Electric SE
ABB Ltd.
Eaton Corporation plc
nVent Electric plc
Rittal GmbH and Co. KG
- *Disclaimer: Major Players sorted in no particular order

Recent Industry Developments
- August 2025: Hubbell acquired DMC Power, adding USD 130 million forecast sales and reinforcing utility enclosure capability.
- March 2025: Eaton finalized Fibrebond takeover for USD 1.4 billion, boosting modular data-center cabin lineup.
- February 2025: PPL, Duke Energy, and Exelon raised 2025-2029 CAPEX by USD 23.5 billion, signaling durable enclosure demand.
- January 2025: nVent expanded its Eleanor, West Virginia plant, creating 100 jobs to scale large data-center cabinet output.


United States Electrical Enclosures Market Report Scope
An electrical enclosure is a cabinet for electrical or electronic equipment to mount switches, knobs, and displays and prevent electrical shock to equipment users and protect the contents from the environment. Electrical enclosures are made up of two types of material, namely metallic and non-metallic. The electrical enclosures are being used in energy and power, industrial, process industries, transportation, infrastructure, and telecommunication industries.
The United States Electrical Enclosures Market Report is Segmented by Material Type (Metallic (Carbon Steel, Stainless Steel, Aluminum), and Non-Metallic (Polycarbonate, Fiberglass, Polyester, ABS)), Form Factor (Small (Less than or Equal to 10 L), Compact (10-50 L), Free-Size / Full-Size (Above 50 L), and Modular / Configurable Systems), Mounting Type (Wall-Mounted, Floor-Mounted / Free-Standing, Underground / Pad-Mounted, and Pole-Mounted), End-user Industry (Energy and Power, Oil and Gas, Industrial Manufacturing, Metals and Mining, Transportation (Rail, Road, Air, EV Charging), Data Centres and Telecom, and Food, Beverage and Pharmaceuticals), and Geography. The Market Forecasts are Provided in Terms of Value (USD).
By Material Type
| Metallic (Carbon Steel, Stainless Steel, Aluminum) |
| Non-Metallic (Polycarbonate, Fiberglass, Polyester, ABS) |
By Form Factor
| Small (Less than or Equal to 10 L) |
| Compact (10-50 L) |
| Free-Size / Full-Size (Above 50 L) |
| Modular / Configurable Systems |
By Mounting Type
| Wall-Mounted |
| Floor-Mounted / Free-Standing |
| Underground / Pad-Mounted |
| Pole-Mounted |
By End-user Industry
| Energy and Power |
| Oil and Gas |
| Industrial Manufacturing and Robotics |
| Metals and Mining |
| Transportation (Rail, Road, Air, EV Charging) |
| Data Centres and Telecom |
| Food, Beverage and Pharmaceuticals |
| By Material Type | Metallic (Carbon Steel, Stainless Steel, Aluminum) |
| Non-Metallic (Polycarbonate, Fiberglass, Polyester, ABS) | |
| By Form Factor | Small (Less than or Equal to 10 L) |
| Compact (10-50 L) | |
| Free-Size / Full-Size (Above 50 L) | |
| Modular / Configurable Systems | |
| By Mounting Type | Wall-Mounted |
| Floor-Mounted / Free-Standing | |
| Underground / Pad-Mounted | |
| Pole-Mounted | |
| By End-user Industry | Energy and Power |
| Oil and Gas | |
| Industrial Manufacturing and Robotics | |
| Metals and Mining | |
| Transportation (Rail, Road, Air, EV Charging) | |
| Data Centres and Telecom | |
| Food, Beverage and Pharmaceuticals |


Key Questions Answered in the Report
How large is the United States electrical enclosures market in 2026?
The market stands at USD 5.59 billion in 2026 and is on track to reach USD 7.35 billion by 2031.
What is the forecast CAGR for electrical enclosures demand through 2031?
Demand is projected to grow at a 5.63% CAGR between 2026 and 2031.
Which material type leads sales today?
Metallic enclosures, mainly carbon-steel and stainless variants, generated 70.92% of 2025 revenue.
Which end-use sector is expanding the fastest?
Data centers and telecom are advancing at 7.95% CAGR as AI workloads drive higher enclosure counts.
How are federal incentives affecting domestic production?
Section 45X tax credits and Buy America rules are spurring new steel mills and automated enclosure plants, cutting lead times and boosting local content.
What is the main constraint on short-term growth?
Volatile steel and aluminum prices are compressing margins and discouraging long-term fixed-price contracts.
Page last updated on:


