Market Overview
| Study Period | 2020 - 2031 |
|---|---|
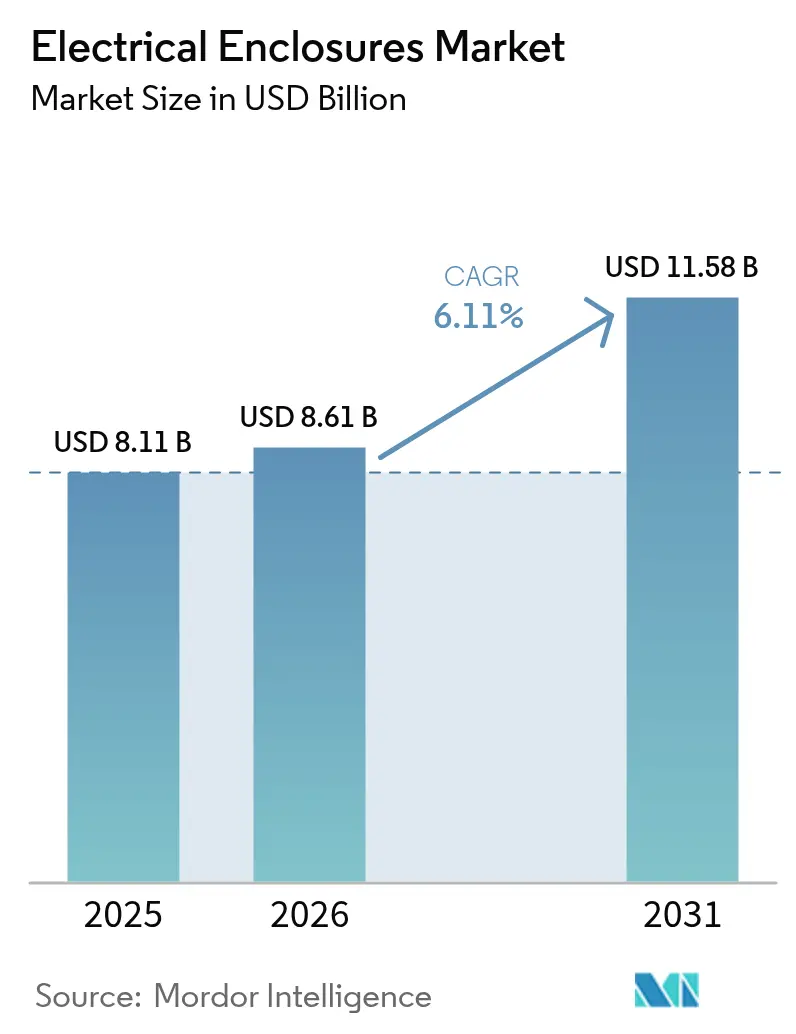
| Market Size (2026) | USD 8.61 Billion |
| Market Size (2031) | USD 11.58 Billion |
| Growth Rate (2026 - 2031) | 6.11% CAGR |
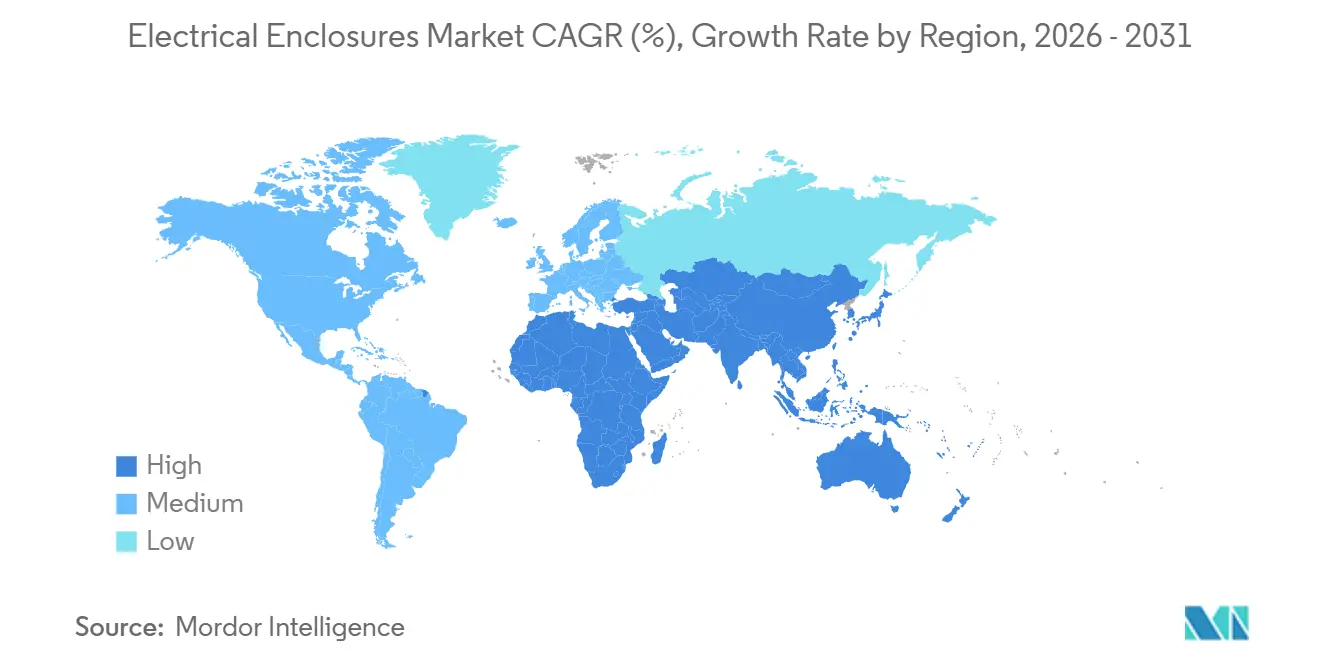
| Fastest Growing Market | Middle East |
| Largest Market | Asia Pacific |
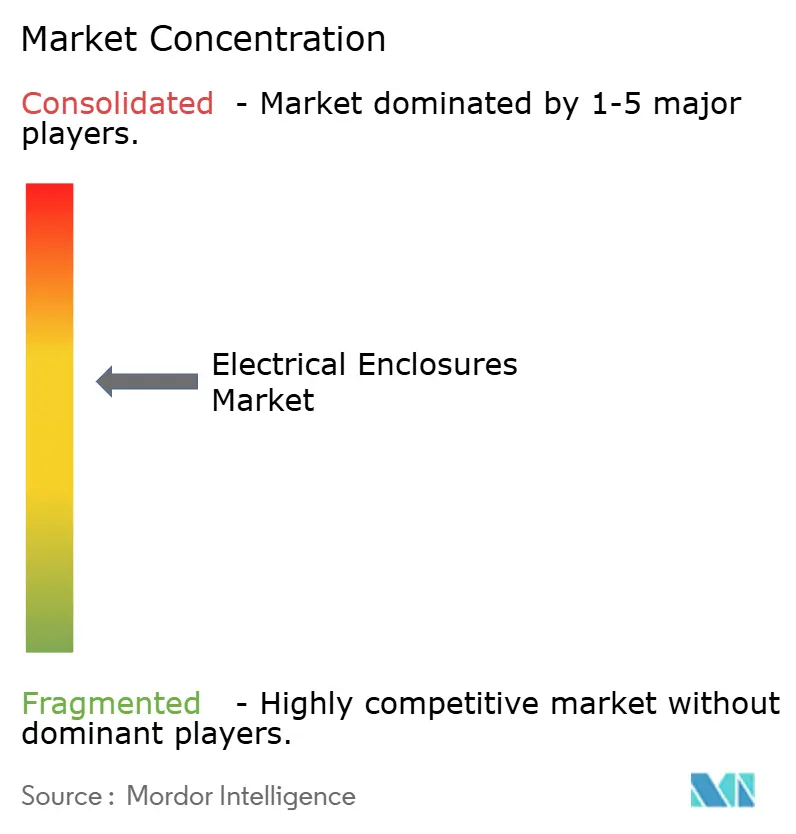
| Market Concentration | Medium |
Major Players *Disclaimer: Major Players sorted in no particular order Image © Mordor Intelligence. Reuse requires attribution under CC BY 4.0. | |
Electrical Enclosures Market Analysis by Mordor Intelligence
The electrical enclosures market size is expected to increase from USD 8.11 billion in 2025 to USD 8.61 billion in 2026 and reach USD 11.58 billion by 2031, growing at a CAGR of 6.11% over 2026-2031. Strong policy support for renewable generation, rising factory automation, and grid-resilience mandates keep capital flowing toward rugged housings that protect increasingly digital assets. Metallic products continue to dominate because of their structural strength and electromagnetic interference shielding, yet composite alternatives are eroding market share as corrosion-resistant fiberglass and polycarbonate pass stringent salt-spray and chemical-exposure tests. Telecom operators accelerating 5G densification and utilities modernizing substations are standardizing on IP66- and IP67-rated designs, lifting average selling prices even as unit volumes grow. Vendors able to certify to evolving IEC 60529, UL 50E, and IEC 62443 requirements enjoy a widening moat while laggards struggle to fund test-chamber upgrades. The electrical enclosures market thus balances high-volume commodity lines against premium smart cabinets that integrate sensors and edge gateways, creating multiple growth avenues.
Key Report Takeaways
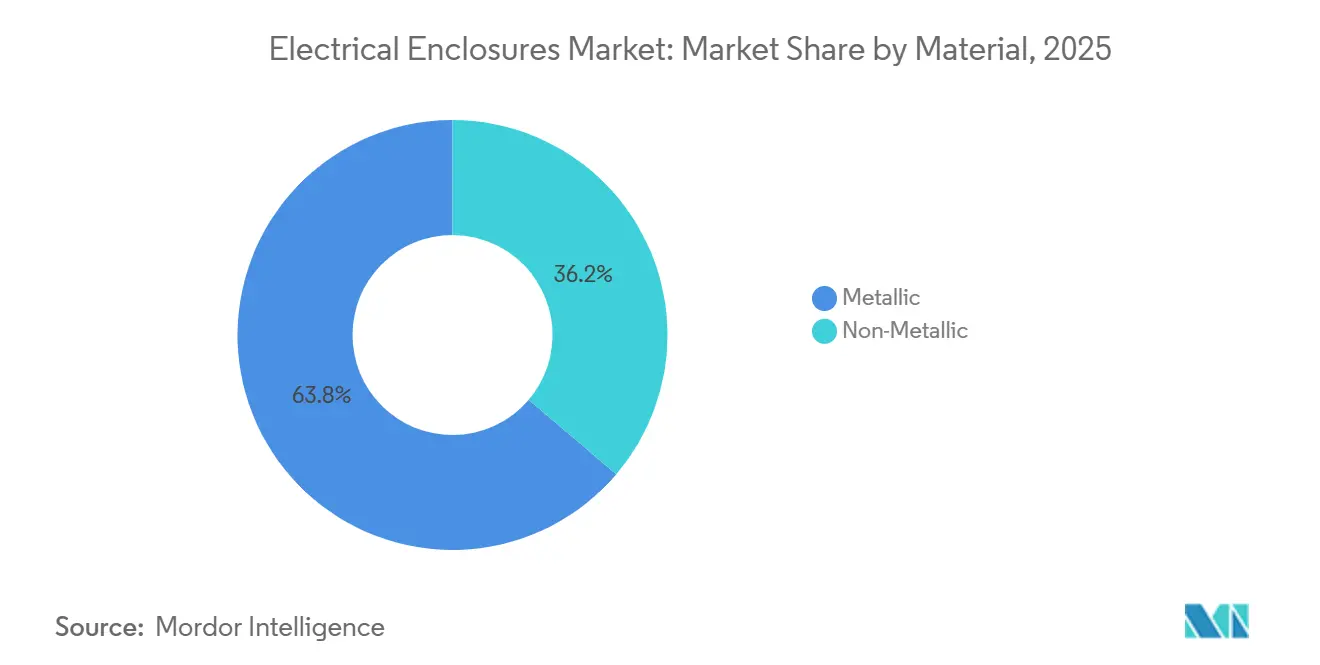
- By material, metallic enclosures led with 63.78% of 2025 revenue, while non-metallic composites are projected to expand at a 6.57% CAGR through 2031.
- By mounting type, wall-mounted units accounted for 43.67% of 2025 shipments, whereas pole-mounted designs are forecast to grow at 6.88% over 2026-2031.
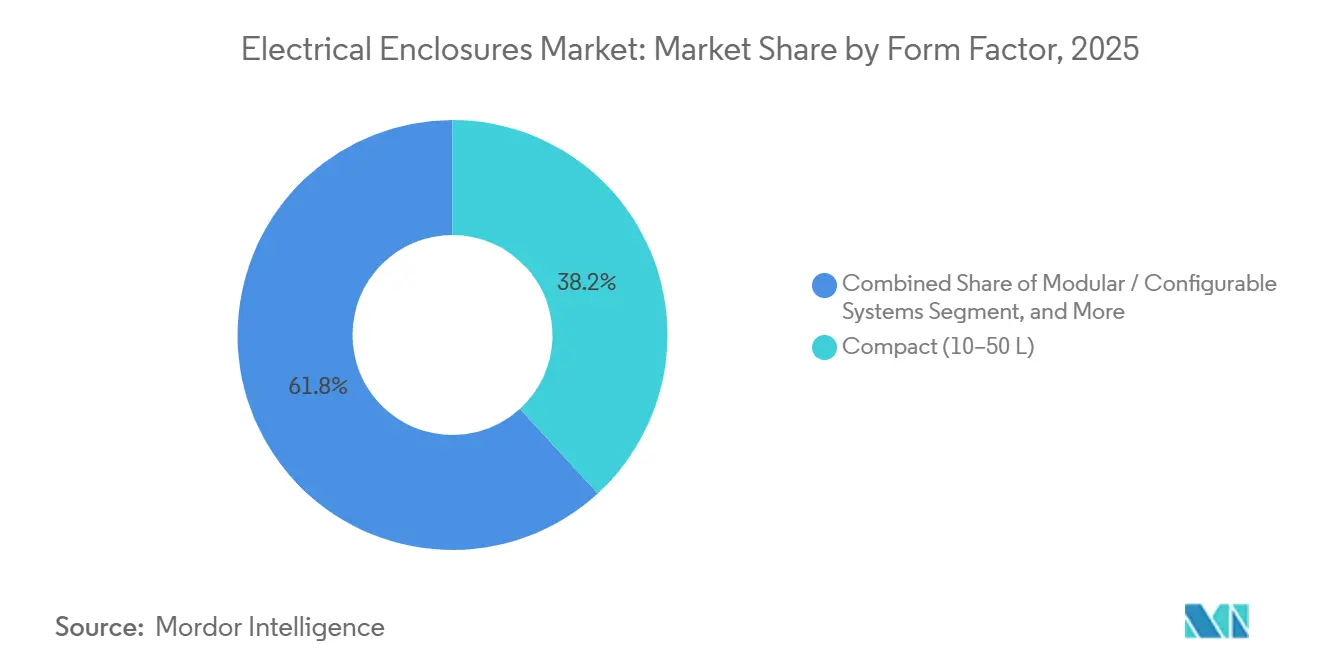
- By form factor, compact 10-50 liter cabinets accounted for 38.19% of the 2025 electrical enclosures market, and modular configurable systems are set to grow at a 6.93% CAGR during the same period.
- By end-user, energy and power applications represented 29.73% of 2025 demand, while data centers and telecom infrastructure are advancing at 7.54% through 2031.
- By geography, Asia Pacific captured 35.67% of 2025 revenue, whereas the Middle East is poised to expand at a 7.13% CAGR to 2031.
Note: Market size and forecast figures in this report are generated using Mordor Intelligence’s proprietary estimation framework, updated with the latest available data and insights as of 2026.
Global Electrical Enclosures Market Trends and Insights
Drivers Impact Analysis*
| Driver | (~) % Impact on CAGR Forecast | Geographic Relevance | Impact Timeline |
|---|---|---|---|
| Accelerating renewable-energy build-out | +1.2% | Asia Pacific, Europe, Middle East, Global | Medium term (2-4 years) |
| Industrial automation and Industry 4.0 | +1.0% | Asia Pacific, North America, Global | Long term (≥ 4 years) |
| Grid-modernization and substation retrofits | +0.9% | North America, Europe, Asia Pacific | Medium term (2-4 years) |
| Stricter global safety and ingress codes | +0.7% | Europe, North America, Global | Short term (≤ 2 years) |
| Outdoor 5G small-cell rollout | +0.6% | Asia Pacific, North America, Middle East, Global | Short term (≤ 2 years) |
| Smart IoT-enabled enclosures | +0.5% | North America, Europe, expanding to Asia Pacific | Long term (≥ 4 years) |
| Source: Mordor Intelligence | |||
Accelerating Renewable-Energy Build-Out
Utility-scale solar and offshore wind projects specify IP65 or higher combiner boxes, inverter housings, and transformer kiosks that withstand corrosive spray, ultraviolet radiation, and temperature swings for 25 years.[1]Germany Federal Ministry for Economic Affairs and Climate Action, “Industry 4.0 Funding Programs 2024,” bmwk.de Stainless-steel 316L dominates North Sea farms, while powder-coated aluminum with passive louvers protects equipment in the Arabian Peninsula’s 50 °C heat. Battery-energy-storage systems co-located with solar arrays add a fire-test layer, as UL 9540A certification becomes non-negotiable for bankability. Because renewable capacity is deployed across thousands of micro-sites rather than a few centralized stations, logisticians must orchestrate just-in-time deliveries of smaller, varied enclosure SKUs, pressuring traditional build-to-order plants to embrace modular production.
Industrial Automation and Industry 4.0 Expansion
Factory digitalization programs funded by Germany’s EUR 2 billion (USD 2.26 billion) 2024 grant scheme subsidize sensor networks that each consume five to twenty cabinets per cell.[2]U.S. Department of Energy, “Grid Resilience and Innovation Partnerships Program 2024,” energy.gov Automotive lines in China and Mexico mount collaborative-robot controllers inside IP65 stainless enclosures that prevent electromagnetic interference from servo drives. Food processors prefer sloped-roof, continuous-hinge designs that comply with FDA sanitary codes, while pharmaceutical clean rooms specify polycarbonate windows to enable visual checks without breaching sterile zones. As operational technology integrates with information technology, NEMA TS-2 and IEC 62443 locks, tamper sensors, and intrusion alarms migrate from data centers to plant floors, cementing the electrical enclosures market as a cybersecurity stakeholder.
Grid-Modernization and Substation Retrofits
The United States Department of Energy disbursed USD 3.5 billion in 2024 for wildfire-resilient substations, each outfitted with NEMA 3R cabinets cooled by thermoelectric modules that keep internals below 40 °C during heatwaves.[3]International Energy Agency, “Renewable Energy Market Update – June 2024,” iea.org European networks, scarred by 2023 arc-flash accidents, now retrofit medium-voltage bays with pressure-relief channels to meet IEC 61641 Type 2B requirements. India’s INR 300 billion (USD 3.6 billion) feeder-segregation plan mandates pole-mounted IP54 boxes that deter meter tampering during the monsoon season. Digital relays and synchrophasors shrink form factors, but higher electronic density increases thermal loads, driving demand for cabinets that combine fiber patch panels, convection vents, and arc barriers in a single frame.
Stricter Global Safety and Ingress-Protection Codes
The European Union’s 2024 update to the Low Voltage Directive obliges accredited lab testing before a CE mark may appear on any housing, elevating certification costs and discouraging fly-by-night entrants. NFPA 70E revisions in the same year require arc-rated enclosures above 240 V, affecting more than one million U.S. installations. China’s harmonization of GB 4208 with IEC 60529 now sets IP65 as the national outdoor minimum, banning legacy foam-gasket boxes. UL 50E adds a 1,000-hour salt-spray exposure for corrosive settings, tilting project awards toward vendors with stainless or fiberglass lines. Collectively, these rules funnel volume toward suppliers that maintain in-house chambers and third-party audit pipelines, entrenching the top tier of the electrical enclosures market.
Restraints Impact Analysis*
| Restraint | (~) % Impact on CAGR Forecast | Geographic Relevance | Impact Timeline |
|---|---|---|---|
| Raw-material price volatility | -0.8% | Asia Pacific, Europe, Global | Short term (≤ 2 years) |
| Seal-integrity and thermal-management issues | -0.4% | Middle East, Africa, tropical Asia, Global | Medium term (2-4 years) |
| Cyber-attack risk in connected cabinets | -0.3% | North America, Europe, advanced Asia Pacific | Long term (≥ 4 years) |
| Skilled-labor shortage for customization | -0.3% | North America, Europe, emerging Asia Pacific | Medium term (2-4 years) |
| Source: Mordor Intelligence | |||
Raw-Material Price Volatility
London Metal Exchange aluminum contracts fluctuated 10% intra-year during 2024, eroding margins for enclosure makers that operate on 8-12% net spreads. Chinese cold-rolled steel soared when blast-furnace curbs coincided with unexpected iron-ore outages, forcing contract renegotiations or losses for fabricators tied to fixed-price purchase orders. Stainless-steel surcharges linked to nickel and molybdenum spiked 15-20%, stalling offshore wind substation awards. Buyers now write commodity-index clauses into tenders, but the administrative burden complicates procurement and forecasting in the electrical enclosures industry.
Cyber-Attack Risk in Connected Enclosures
CISA reported 87 cyber-intrusion attempts against industrial control systems in 2024, a dozen of which exploited vulnerabilities inside IoT-enabled housings. A ransomware incident that forced manual operation of 45 European substations underscored the cascading risk of firmware compromise. IEC 62443-4-2 demands encrypted links and role-based controls for any cabinet with a network interface, yet retrofits lag due to cost. Builders are embedding trusted-platform modules that add USD 50-150 per unit, but utilities sometimes turn off radios altogether, sacrificing remote diagnostics to mitigate breach exposure.
*Our forecasts treat driver/restraint impacts as directional, not additive. The impact forecasts reflect baseline growth, mix effects, and variable interactions.
Segment Analysis
By Material: Composites Challenge Metallic Dominance
Metallic units accounted for 63.78% of the electrical enclosures market share in 2025, reflecting cold-rolled steel’s price advantage and aluminum’s weight savings for pole-top gear. Non-metallic cabinets are expected to grow 6.57% annually through 2031 as offshore wind, coastal substations, and chemical plants shift toward fiberglass-reinforced polyester, which shows no rust after 3,000 hours of ASTM B117 salt spray testing. Polycarbonate lids dominate clean rooms where technicians need visual confirmation without breaking the sterile boundary.
Hybrid designs are multiplying: steel frames with polycarbonate doors or aluminum backplates balance cost, grounding, and corrosion resistance. Stainless-steel 316L still owns hazardous zones, meeting NEMA 4X and IP66 while resisting acid and chlorine attack. Meanwhile, carbon steel with epoxy coatings remains the indoor workhorse, but as composite costs fall and flame-retardant ratings reach UL 94 V-0, even factories are questioning legacy metal spend. The electrical enclosures market thus moves toward a mixed-material toolkit tailored to the environment and lifecycle economics.


By Mounting Type: Pole-Mounted Gains Traction in 5G and Grid Edge
Wall-mounted boxes delivered 43.67% of 2025 shipments, anchoring control rooms and machine cells where vertical real estate is cheap. Pole-mounted designs are forecast to expand 6.88% through 2031 as telecom operators add tens of thousands of 5G small cells, each requiring IP65-rated housings for rectifiers, splice trays, and backup batteries. Distribution utilities also retrofit auto-reclosers and fault indicators on overhead feeders, cutting rural outage minutes by 40%.
Pad-mounted and underground units serve urban aesthetics and public-safety rules, hiding transformers out of view while resisting soil moisture and rodent ingress. Floor-standing cabinets remain in heavy-industry motor centers and server rooms where cable depth matters. The outward shift in generation, sensing, and compute power is pushing the electrical enclosures market toward smaller, resilient pole-top shells that must withstand wind and lightning, while wall-mounts will persist in climatized interiors.
By Form Factor: Modular Systems Reshape Scalability
Compact 10-50 liter cabinets captured 38.19% of the 2025 electrical enclosures market size, dotting every conveyor, pump, and robot arm on a shop floor. Modular configurable systems, however, are on pace for a 6.93% CAGR through 2031 as plants chase tool-free expansion. Rittal’s TS 8 frame snaps together without welding, trimming assembly labor by 60% and allowing hot-swap side panels for future cable runs.
Small housings below 10 liters power PV optimizers and smart-building sensors, while free-size walk-in shelters above 50 liters protect substation switchgear and telecom core nodes. Value is migrating toward modularity: buyers pay 20-30% premiums for rails, busbars, and fan trays that can be reconfigured over decades. Compact boxes keep the unit-count crown, but revenue will skew toward higher-priced platform cabinets as the electrical enclosures market monetizes lifecycle adaptability.

By End-User Industry: Data Centers and Telecom Outpace Legacy Verticals
Energy and power contributed 29.73% of 2025 demand, spanning IP66 inverter kiosks, arc-resistant switchgear, and UL 9540A battery racks. Hyperscale clouds expanded their footprint in 2024 by adding 120 facilities, each outfitted with 500 to 1,000 racks featuring integrated sensors and liquid-cooled coil doors. As a result, data centers and telecoms are projected to achieve a CAGR of 7.54% through 2031.
Industrial manufacturing, mining, and transport lines still absorb roughly one-third of units, from IP65 robot controllers to EV-charging pedestals. Oil and gas prefer NEMA 4X aluminum around wellheads, though capital is pivoting to hydrogen and carbon-capture projects that need similar enclosures. Food and beverage, plus pharma, require stainless wash-down models under FDA rules. As digital traffic surges, the electrical enclosures market is increasingly serving servers and radio heads rather than just transformers and motors.
Geography Analysis
Asia Pacific generated 35.67% of 2025 revenue, buoyed by China’s CNY 520 billion (USD 73 billion) grid spend that deployed 1.8 million smart meters and 12,000 automated feeder switches, all nestled inside dust-tight housings. India’s INR 300 billion (USD 3.6 billion) revamp funds tamper-proof polycarbonate meter boxes resilient against monsoon splash. Japan and South Korea retrofit nuclear and coal controls into seismic-rated cabinets that sustain magnitude-7 shocks. Southeast Asian data-center approvals in Singapore reached 400 MW in 2024, translating to roughly 18,000 rack enclosures with rear-door heat exchangers. The electrical enclosures market thus tracks the region’s dual energy and digital build-out.
The Middle East is projected to grow 7.13% through 2031. Saudi Arabia’s NEOM program alone will need about 80,000 inverter and transformer housings suited for 50 °C air laden with sand. The UAE’s Barakah plant specified 12,000 stainless cabinets with arc venting, setting a high bar for nuclear projects. Qatar’s North Field LNG expansion ordered 5,000 explosion-proof shells for Zone 1. Across the Persian Gulf, desert resilience drives stainless or powder-coated aluminum spend, stretching average order values in the electrical enclosures market.
North America and Europe together hold roughly 45% of global sales. The U.S. Grid Resilience program finances NEMA 3R outdoor cabinets with solid-state coolers to mitigate the impacts of wildfires and hurricanes. Europe’s Energiewende funnels EUR 1.8 billion (USD 2.03 billion) into IP67 subsea junction and converter housings for offshore wind. Replacement cycles lengthen in these mature zones, but stricter arc-flash and cybersecurity standards sustain a steady retrofit cadence. Consequently, while growth moderates, specification complexity keeps margins healthy for established vendors in the electrical enclosures market.

Competitive Landscape
Roughly 48-52% of 2025 revenue was accounted for by the top ten vendors, giving the electrical enclosures market a moderate level of concentration. Schneider Electric’s 2023 integration of AVEVA software bundles edge gateways into cabinets, locking clients into analytics subscriptions. Rittal’s 2024 TS 8 launch reduced commissioning time, helping it win orders from automakers facing skilled-labor shortages. ABB patented a phase-change cooling wall that dissipates heat without vents, a boon for dusty mines.
Regional fabricators such as Hammond Manufacturing and Allied Moulded carve niches with five-day custom builds against global lead times of a month. nVent’s 2024 Trachte buyout boosted its footprint in utility shelters, while Eaton’s UL 50E certification positions it for corrosive offshore work. Pentair and Legrand drill into water treatment and AI-laden server racks, respectively, demonstrating vertical specialization.
Emerging disruptors leverage additive manufacturing to produce low-volume, high-complexity geometries that sheet-metal brakes cannot economically match. Meanwhile, smart enclosures with vibration and humidity sensors transition from pilots to procurement catalogs, slowly shifting revenue from once-off hardware to recurring monitoring fees. The electrical enclosures industry, therefore, balances scale economics with customization speed, with digital services as the next battleground.
Electrical Enclosures Industry Leaders
Schneider Electric SE
ABB Ltd.
Emerson Electric Company
Hubbell Incorporated
Legrand SA
- *Disclaimer: Major Players sorted in no particular order

Recent Industry Developments
- December 2025: ABB launched its IP67 stainless-steel “Mariner” series, a corrosion-resistant enclosure line engineered for offshore wind substations, with first deliveries contracted to a 500 MW North Sea project.
- October 2025: Rittal debuted the SmartRack X5 platform featuring embedded AI analytics, vibration and humidity sensors, and edge-compute gateways, securing initial orders from a German luxury-automobile assembly plant.
- August 2025: Eaton inaugurated a 30,000 m² enclosure manufacturing campus in Johor, Malaysia, doubling its Asia Pacific capacity and shortening lead times for regional renewable-energy and telecom customers.
- May 2025: nVent introduced its UL 50E-certified fiberglass modular enclosure system designed for utility-scale battery-storage containers, winning a multi-year supply agreement with a U.S. solar-plus-storage developer.


Global Electrical Enclosures Market Report Scope
The Electrical Enclosures Market Report is Segmented by Material (Metallic, and Non-Metallic), Mounting Type (Wall-Mounted, Floor-Mounted/Free-Standing, Underground/Pad-Mounted, Pole-Mounted), Form Factor (Small (Below 10 L), Compact (10–50 L), Free-Size / Full-Size (Above 50 L), Modular / Configurable Systems), End-User Industry (Energy and Power, Oil and Gas, Industrial Manufacturing and Robotics, Metals and Mining, Transportation, Data Centres and Telecom, Food and Beverage, Pharmaceuticals), and Geography (North America, South America, Europe, Asia Pacific, Middle East, Africa). The Market Forecasts are Provided in Terms of Value (USD).
By Material
| Metallic |
| Non-Metallic |
By Mounting Type
| Wall-Mounted |
| Floor-Mounted / Free-Standing |
| Underground / Pad-Mounted |
| Pole-Mounted |
By Form Factor
| Small (Below 10 L) |
| Compact (10–50 L) |
| Free-Size / Full-Size (Above 50 L) |
| Modular / Configurable Systems |
By End-User Industry
| Energy and Power |
| Oil and Gas |
| Industrial Manufacturing and Robotics |
| Metals and Mining |
| Transportation |
| Data Centres and Telecom |
| Food and Beverage |
| Pharmaceuticals |
By Geography
| North America | United States | |
| Canada | ||
| South America | Brazil | |
| Argentina | ||
| Rest of South America | ||
| Europe | Germany | |
| United Kingdom | ||
| France | ||
| Italy | ||
| Spain | ||
| Rest of Europe | ||
| Asia Pacific | China | |
| Japan | ||
| India | ||
| South Korea | ||
| Rest of Asia Pacific | ||
| Middle East and Africa | Middle East | United Arab Emirates |
| Saudi Arabia | ||
| Turkey | ||
| Rest of Middle East | ||
| Africa | South Africa | |
| Egypt | ||
| Rest of Africa | ||
| By Material | Metallic | ||
| Non-Metallic | |||
| By Mounting Type | Wall-Mounted | ||
| Floor-Mounted / Free-Standing | |||
| Underground / Pad-Mounted | |||
| Pole-Mounted | |||
| By Form Factor | Small (Below 10 L) | ||
| Compact (10–50 L) | |||
| Free-Size / Full-Size (Above 50 L) | |||
| Modular / Configurable Systems | |||
| By End-User Industry | Energy and Power | ||
| Oil and Gas | |||
| Industrial Manufacturing and Robotics | |||
| Metals and Mining | |||
| Transportation | |||
| Data Centres and Telecom | |||
| Food and Beverage | |||
| Pharmaceuticals | |||
| By Geography | North America | United States | |
| Canada | |||
| South America | Brazil | ||
| Argentina | |||
| Rest of South America | |||
| Europe | Germany | ||
| United Kingdom | |||
| France | |||
| Italy | |||
| Spain | |||
| Rest of Europe | |||
| Asia Pacific | China | ||
| Japan | |||
| India | |||
| South Korea | |||
| Rest of Asia Pacific | |||
| Middle East and Africa | Middle East | United Arab Emirates | |
| Saudi Arabia | |||
| Turkey | |||
| Rest of Middle East | |||
| Africa | South Africa | ||
| Egypt | |||
| Rest of Africa | |||


Key Questions Answered in the Report
What is the forecast value of the electrical enclosures market by 2031?
The market is projected to reach USD 11.58 billion by 2031, expanding at a 6.11% CAGR over 2026-2031.
Which material segment is growing fastest?
Non-metallic composites, especially fiberglass-reinforced polyester and polycarbonate, are expected to grow 6.57% annually through 2031.
Why are pole-mounted enclosures gaining popularity?
5G small-cell rollouts and distribution-automation programs place equipment on utility poles, driving a 6.88% CAGR for pole-mounted cabinets.
Which end-user vertical shows the highest growth?
Data centers and telecom infrastructure lead with a 7.54% CAGR as hyperscalers and edge facilities expand worldwide.
How do stricter safety codes affect suppliers?
Updated IEC, UL, and NFPA standards increase certification costs, favoring established vendors with in-house test labs and raising entry barriers.
What is the market concentration level?
The top ten players account for roughly half of global revenue, indicating moderate concentration in this sector.
Page last updated on:


