US Dog Food Market Size and Share
Market Overview
| Study Period | 2018 - 2031 |
|---|---|
| Forecast Data Period | 2026 - 2031 |
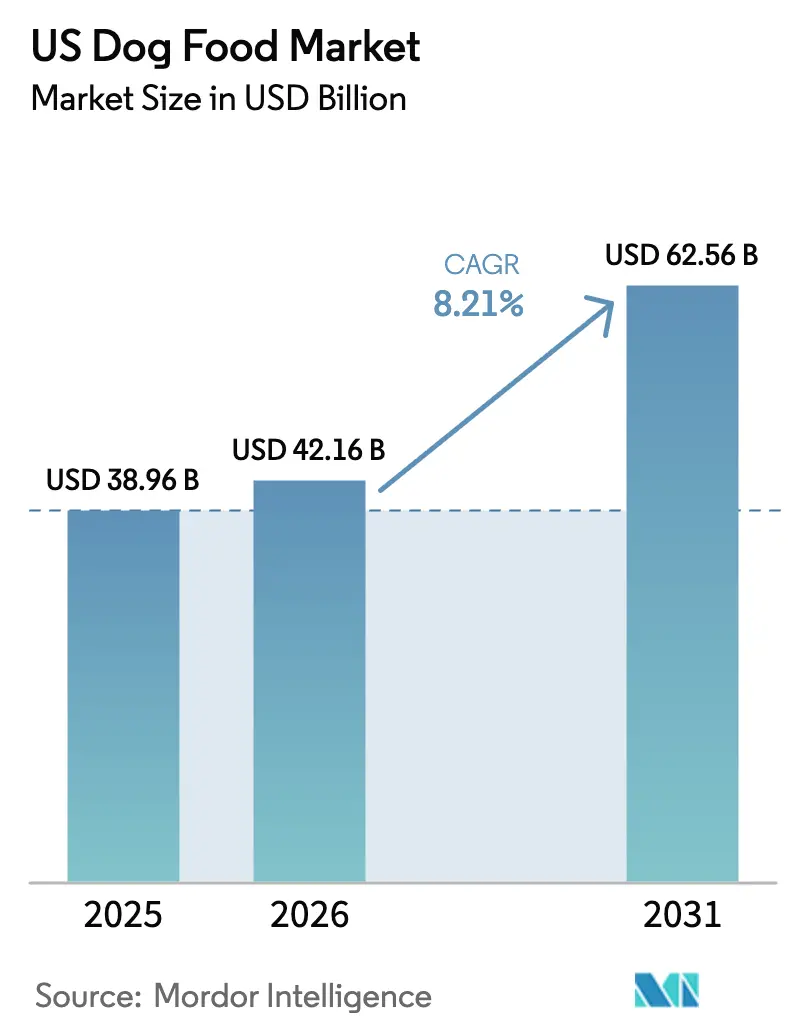
| Base Year Market Size (2025) | USD 38.96 Billion |
| Market Size (2026) | USD 42.16 Billion |
| Market Size (2031) | USD 62.56 Billion |
| Growth Rate (2026 - 2031) | 8.21% CAGR |
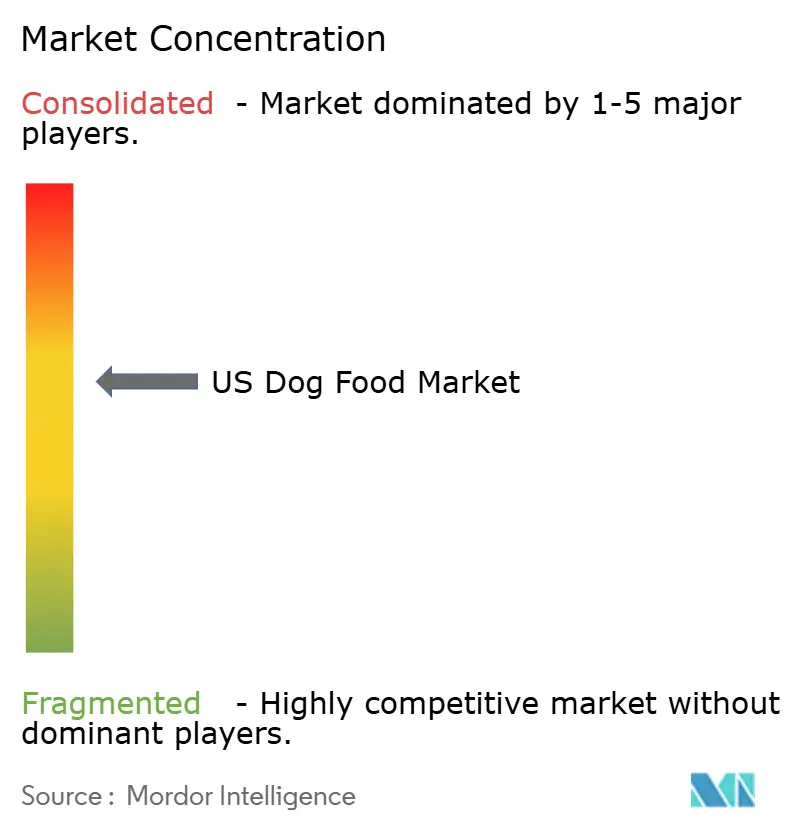
| Market Concentration | Medium |
Major Players *Disclaimer: Major Players sorted in no particular order Image © Mordor Intelligence. Reuse requires attribution under CC BY 4.0. | |
US Dog Food Market Analysis by Mordor Intelligence
US dog food market size in 2026 is estimated at USD 42.16 billion, growing from 2025 value of USD 38.96 billion with 2031 projections showing USD 62.56 billion, growing at 8.21% CAGR over 2026-2031. Rising ownership rates, premiumization, and digital commerce are reshaping demand, with 45.5% of households now including at least one dog. Functional nutrition, insect proteins, and data-driven personalization are helping to lift average spend even as volume growth eases. E-commerce penetration climbed in all sales, subscription models deepen loyalty, and the “Big Five” manufacturers defend share through acquisitions and supply-chain investments. Price pressure from grain and protein cost spikes remains the leading margin risk, while regulatory uncertainty around the PURR Act could alter labeling and ingredient approvals.
Key Report Takeaways
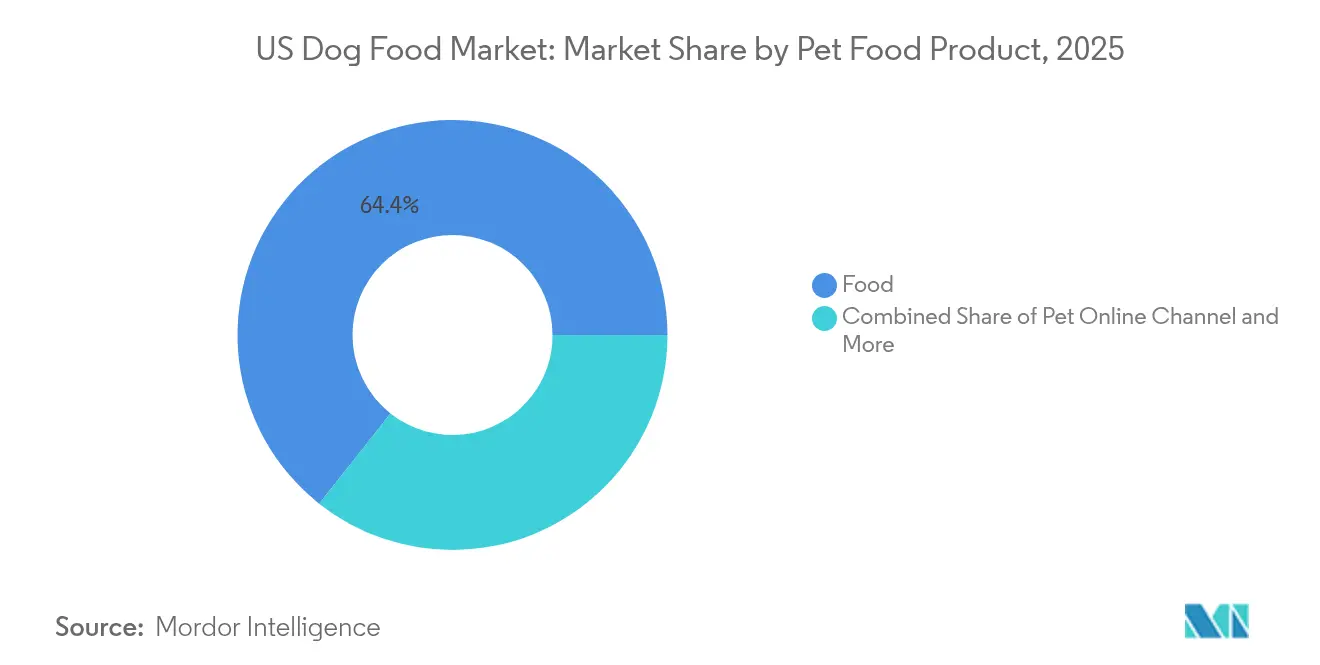
- By pet food product, food held 64.35% of the US dog food market share in 2025, while veterinary diets posted the fastest 9.12% CAGR through 2031.
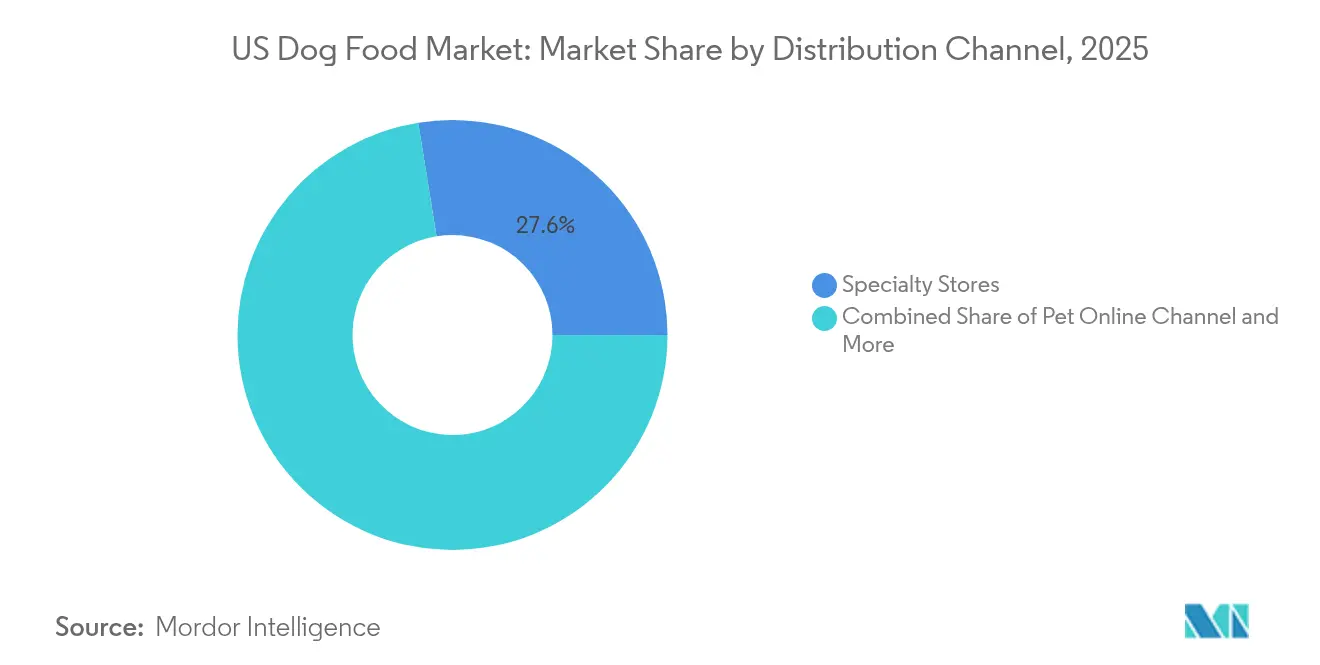
- By distribution channel, specialty stores led with 27.55% of the US dog food market size in 2025, whereas online channel are projected to expand at a 10.45% CAGR through 2031.
Note: Market size and forecast figures in this report are generated using Mordor Intelligence’s proprietary estimation framework, updated with the latest available data and insights as of 2026.
US Dog Food Market Trends and Insights
Drivers Impact Analysis*
| Driver | (~) % Impact on CAGR Forecast | Geographic Relevance | Impact Timeline |
|---|---|---|---|
| Premiumization of dog diets | +1.8% | National, concentrated in urban metros | Medium term (2-4 years) |
| Surge in e-commerce and subscription models | +1.5% | National, with higher penetration in suburban markets | Short term (≤ 2 years) |
| Pet-parent demand for functional nutrition | +1.3% | National, strongest in high-income demographics | Medium term (2-4 years) |
| Data-driven personalized feeding | +1.1% | National, early adoption in tech-forward regions | Long term (≥ 4 years) |
| Corporate ESG push toward insect protein inputs | +0.9% | National, with manufacturing concentration in Midwest | Long term (≥ 4 years) |
| Tele-veterinary partnerships enabling Rx diets at home | +0.6% | National, accelerated in rural and underserved areas | Medium term (2-4 years) |
| Source: Mordor Intelligence | |||
Premiumization of Dog Diets
Fresh, gently cooked, and human-grade recipes continue to command price premiums that exceed conventional kibble. Subscription players, such as The Farmer’s Dog and Nom Nom, reinforce the perception of mealtime as a wellness moment rather than a routine feeding. Packaging upgrades, including resealable pouches and portion cups, nurture convenience and freshness cues. Ingredient labels now mirror human food trends, featuring organic, non-GMO, and locally sourced claims, which reinforces the humanization of the product. Although AAFCO nutrient adequacy still anchors formulations, the PURR Act could shorten the time-to-market for novel additives, potentially accelerating the launch of premium SKUs[1]Source: Industry Intelligence, “AAFCO Raises Concerns Over PURR Act,” industryintel.com.
Surge in E-commerce and Subscription Models
Chewy’s 20 million active customers demonstrate how recurring plans generate predictable revenue and expand data pools for cross-selling. Algorithm-driven recommendations consider breed, weight, and activity metrics, resulting in higher conversion rates than static assortments. Temperature-controlled packaging innovations mitigate spoilage for fresh and frozen SKUs, though last-mile costs remain elevated. Traditional supermarkets respond with click-and-collect add-ons, yet price transparency favors online comparison. The channel shift compresses margins for mass retailers while empowering direct-to-consumer specialists to scale rapidly.
Pet-Parent Demand for Functional Nutrition
Nutraceutical ingredients, such as probiotics, glucosamine, and omega-3 fatty acids, have transitioned from niche extras to core product features, supported by veterinary endorsements that foster consumer trust. A growing senior dog cohort, now accounting for half of the canine population, fuels demand for joint, cognitive, and digestive health formulas. FDA surveillance of structure-function claims moderates marketing language but also legitimizes science-backed offerings. Manufacturers invest in clinical trials to differentiate efficacy and meet the needs of veterinary partners. The pivot blends wellness and prevention narratives, raising price ceilings without reliance on volume gains.
Data-Driven Personalized Feeding
AI engines from firms such as PawCo assess images, vet records, and wearables to tailor macros, calories, and supplement stacks in real time. Continuous feedback loops refine meals as pets age or their activity shifts, converting one-size-fits-all diets into dynamic regimens. Early adopters treat algorithms as service moats, though privacy and data stewardship standards need clearer guardrails. Veterinary sign-off is critical to credential recommendations and satisfies professional ethics. Capital intensity around data infrastructure raises barriers that could widen the gap between incumbents and niche challengers.
Restraints Impact Analysis*
| Restraint | (~) % Impact on CAGR Forecast | Geographic Relevance | Impact Timeline |
|---|---|---|---|
| Ingredient-price volatility and inflation pass-through | -1.2% | National, with regional variations in commodity exposure | Short term (≤ 2 years) |
| Stagnating US dog population growth | -0.9% | National, with urban concentration of decline | Long term (≥ 4 years) |
| Cold-chain logistics gaps for fresh/frozen formats | -0.7% | National, acute in rural and last-mile delivery | Medium term (2-4 years) |
| Federal PURR-Act label-rule uncertainty | -0.4% | National, affecting all manufacturers and distributors | Short term (≤ 2 years) |
| Source: Mordor Intelligence | |||
Ingredient-Price Volatility and Inflation Pass-Through
Protein inputs account for up to half of the cost of goods, making formulations sensitive to tariff-driven spikes and grain-linked swings. With tariffs on merchandise imports, pass-through risks, and demand elasticity, prompt brands to adjust pack sizes or push premium SKUs to defend their margins. Private-label incursion intensifies during inflation as value-seeking owners trade down. Hedging and long-term supplier contracts provide a cushion for larger players, whereas smaller firms struggle to absorb shocks and maintain their market presence.
Stagnating US Dog Population Growth
The number of dog-owning households declined from 2020 to 2024, and puppies now account for only 8% of dogs, which is tightening the pipeline of new customers. Premiumization mitigates unit declines, but value growth depends on convincing aging pet parents to invest in therapeutic and functional lines. Urban densification favors cats, eroding the share of dogs. Manufacturers must innovate around life-stage nutrition and diversified pack sizes to maintain relevance across demographic shifts.
*Our forecasts treat driver/restraint impacts as directional, not additive. The impact forecasts reflect baseline growth, mix effects, and variable interactions.
Segment Analysis
By Pet Food Product: Therapeutic Diet Momentum Outpaces Core Food Sales
Food held 64.35% of the US dog food market share in 2025, underlining its foundational role in daily nutrition spending, while veterinary diets posted the fastest 9.12% CAGR through 2031, capitalizing on tele-vet access and rising chronic disease management needs among senior dogs. Supplements gained traction as probiotics and omega-3 inclusions transitioned from optional to projected. Freeze-dried treats leveraged minimal processing claims to command higher price points, while jerky formats emphasized single-protein transparency.
Functional gains reflect life-stage segmentation where cognitive, renal, and joint formulas fetch premiums. Brands bundle treats as delivery vehicles for actives, blending indulgence with wellness. Dry food faces commoditization, so manufacturers differentiate via grain-free SKUs and targeted kibble shapes. FDA scrutiny keeps therapeutic assertions evidence-based, giving research-intensive incumbents an edge. The diversity of value propositions across sub-categories sustains consumer engagement even as volume moderates.


By Distribution Channel: Digital Subscriptions Redefine Convenience
Specialty stores secured 27.55% revenue share in 2025, anchoring their niche through staff expertise and curated assortments that justify premium price points. However, the online channel is projected to grow at a 10.45% CAGR through 2031, shifting the center of gravity toward direct buying journeys that reward data-driven personalization. Supermarkets remain essential for pantry restocking but increasingly view pet fare as a traffic builder rather than a margin engine. Convenience outlets thrive on small-pack formats for emergencies and impulse purchases.
Subscription economics transform the inventory model. Predictable order intervals enhance demand forecasting and underpin personalized promotions that reduce churn. Specialty players are pivoting to omnichannel click-and-collect services to retain customer loyalty. Mass retailers negotiate slotting fees rigorously as shelf space becomes increasingly scarce. For manufacturers, digital engagement provides granular insights that inform R&D and inform the development of targeted product bundles, thereby deepening the competitive gaps between data-fluent firms and laggards.
Geography Analysis
Metropolitan corridors on the West Coast and in the Northeast lead the US dog food market in premium spend, reflecting higher incomes and humanization mindsets. These regions also show the highest adoption of insect protein formulas and data-driven meal plans, reinforcing their avant-garde reputation. While absolute dog numbers plateau, per-pet expenditure in these urban centers rises, sustaining US dog food market value despite demographic softness.
The South and Southwest contribute incremental volume growth, buoyed by population inflows and rising household formation. Midwestern states, home to many production facilities, benefit from supply-chain efficiencies that aid price competitiveness. Rural areas remain price sensitive but increasingly rely on e-commerce to access specialty and prescription foods. Cold-chain limitations curb fresh and frozen uptake outside urban hubs, so brands invest in regional manufacturing and insulated packaging to expand reach springer.com.
Regulatory harmonization under the PURR Act would likely reduce geographic disparities by establishing uniform approval pathways, shortening rollout cycles for innovation. Tele-vet solutions bridge specialist gaps in sparsely populated areas, driving uptake of veterinary diets. Income and cost-of-living differences influence pack-size preferences, with bulk formats thriving in suburban warehouse outlets and single-serve pouches resonating among city dwellers. Regional tailoring of marketing and merchandising remains critical to capture nuanced demand patterns.
Competitive Landscape
The top five suppliers, Hill's Pet Nutrition Inc., General Mills Inc., Mars Incorporated, Nestle (Purina), and The J.M. Smucker Company, controlled a major share of the US dog food market in 2024, yielding a moderate concentration profile. Still, insurgent direct-to-consumer brands leverage subscription economics, AI personalization, and innovative formats to tap into high-value pockets. Mars’ acquisition of Nom Nom illustrates incumbent appetite for absorbing disruptive capabilities, while Nestlé’s USD 550 million capacity expansion underscores a race to secure supply for cold-chain-intensive lines.
Innovation clusters around alternative proteins, life-stage therapeutics, and data platforms. Ynsect’s breakthrough positions insect protein as a mainstream ingredient, and collaborations with major manufacturers could accelerate scale[3]Source: Ÿnsect, “First Company to Obtain Authorization to Commercialize Mealworm Proteins,” ynsect.com. AI tools like Farmina’s Genius Coach and PawCo’s feed engine deepen customer engagement and lengthen switching costs. Patent activity in encapsulated nutrients and digestive enhancers signals ongoing efforts to differentiate, although FDA compliance timelines remain a gating factor.
Capital intensity in cold-chain, data infrastructure, and regulatory affairs favors scale players, encouraging M&A as smaller firms seek exit options. Retailers such as Chewy expand private-label lines, challenging brand hegemony. ESG commitments push leaders to publish Scope 3 abatement pathways, with ingredient sourcing transparency emerging as a branding battleground. Over the forecast horizon, convergence of pet health, tech, and sustainability is likely to redefine competitive advantage more than price alone.
US Dog Food Industry Leaders
Colgate-Palmolive Company (Hill's Pet Nutrition Inc.)
General Mills Inc.
Mars Incorporated
Nestle (Purina)
The J. M. Smucker Company
- *Disclaimer: Major Players sorted in no particular order

Recent Industry Developments
- January 2024: Ynsect became the first company to obtain US regulatory authorization for the commercialization of mealworm proteins in dog food applications, marking a breakthrough for alternative protein sources and sustainable ingredient development.
- July 2023: Hill's Pet Nutrition introduced its new MSC (Marine Stewardship Council) certified pollock and insect protein products for pets with sensitive stomachs and skin lines. They contain vitamins, omega-3 fatty acids, and antioxidants.
- March 2023: Blue Buffalo, a subsidiary of General Mills Inc., launched its new high-protein dry dog food line, BLUE Wilderness Premier Blend. It is formulated with chicken and a blend of antioxidants, vitamins, and minerals.


US Dog Food Market Report Scope
Food, Pet Nutraceuticals/Supplements, Pet Treats, Pet Veterinary Diets are covered as segments by Pet Food Product. Convenience Stores, Online Channel, Specialty Stores, Supermarkets/Hypermarkets are covered as segments by Distribution Channel.| Food | By Sub Product | Dry Pet Food | By Sub Dry Pet Food | Kibbles |
| Other Dry Pet Food | ||||
| Wet Pet Food | ||||
| Pet Nutraceuticals/Supplements | By Sub Product | Milk Bioactives | ||
| Omega-3 Fatty Acids | ||||
| Probiotics | ||||
| Proteins and Peptides | ||||
| Vitamins and Minerals | ||||
| Other Nutraceuticals | ||||
| Pet Treats | By Sub Product | Crunchy Treats | ||
| Dental Treats | ||||
| Freeze-dried and Jerky Treats | ||||
| Soft & Chewy Treats | ||||
| Other Treats | ||||
| Pet Veterinary Diets | By Sub Product | Derma Diets | ||
| Diabetes | ||||
| Digestive Sensitivity | ||||
| Obesity Diets | ||||
| Oral Care Diets | ||||
| Renal | ||||
| Urinary tract disease | ||||
| Other Veterinary Diets |
| Convenience Stores |
| Online Channel |
| Specialty Stores |
| Supermarkets/Hypermarkets |
| Other Channels |
| By Pet Food Product | Food | By Sub Product | Dry Pet Food | By Sub Dry Pet Food | Kibbles |
| Other Dry Pet Food | |||||
| Wet Pet Food | |||||
| Pet Nutraceuticals/Supplements | By Sub Product | Milk Bioactives | |||
| Omega-3 Fatty Acids | |||||
| Probiotics | |||||
| Proteins and Peptides | |||||
| Vitamins and Minerals | |||||
| Other Nutraceuticals | |||||
| Pet Treats | By Sub Product | Crunchy Treats | |||
| Dental Treats | |||||
| Freeze-dried and Jerky Treats | |||||
| Soft & Chewy Treats | |||||
| Other Treats | |||||
| Pet Veterinary Diets | By Sub Product | Derma Diets | |||
| Diabetes | |||||
| Digestive Sensitivity | |||||
| Obesity Diets | |||||
| Oral Care Diets | |||||
| Renal | |||||
| Urinary tract disease | |||||
| Other Veterinary Diets | |||||
| By Distribution Channel | Convenience Stores | ||||
| Online Channel | |||||
| Specialty Stores | |||||
| Supermarkets/Hypermarkets | |||||
| Other Channels | |||||


Market Definition
- FUNCTIONS - Pet foods are usually intended to provide complete and balanced nutrition to the pet but are primarily used as functional products. The scope includes the food and supplements consumed by pets including veterinary diets. Supplements/nutraceuticals that are directly supplied to pets are considered within the scope.
- RESELLERS - Companies engaged in reselling of pet food without value addition have been excluded from the market scope, in order to avoid double counting.
- END CONSUMERS - Pet owners are considered to be the end-consumers in the market studied.
- DISTRIBUTION CHANNELS - Supermarkets/hypermarkets, specialty stores, convenience stores, online channels and other channels are considered within the scope. The stores which are exclusively providing pet related basic and custom products are considered within the scope of specialty stores.
| Keyword | Definition |
|---|---|
| Pet Food | The scope of pet food includes the food that is eatable by pets including food, treats, veterinary diets, and nutraceuticals/supplements. |
| Food | Food is animal feed intended for consumption by pets. It is formulated to provide essential nutrients and meet the dietary needs of various types of pets, including dogs, cats, and other animals. These are generally segmented into dry and wet pet foods. |
| Dry Pet Food | Dry pet foods may be extruded/baked (kibbles) or flaked. They have a lower moisture content, typically around 12-20%. |
| Wet Pet Food | Wet pet food, also known as canned pet food or moist pet food, generally has a higher moisture content compared to dry pet food, often ranging from 70-80%. |
| Kibbles | Kibbles are dry, processed pet food in small, bite-sized pieces or pellets. They are specifically formulated to provide balanced nutrition for various domestic animals, such as dogs, cats, and other animals. |
| Treats | Pet Treats are special food items or rewards given to pets, to show affection, and encourage good behavior. They are especially used during training. Pet treats are made from various combinations of meat or meat-derived materials with other ingredients. |
| Dental Treats | Pet dental treats are specialized treats that are formulated to promote good oral hygiene in pets. |
| Crunchy Treats | It is a type of pet treat that has a firm and crispy texture which can be a good source of nutrition for pets. |
| Soft and chewy treats | Soft and Chewy pet treats are a type of pet food product that is formulated to be easy to chewy and digest. They are usually made from soft and pliable ingredients, such as meat, poultry, or vegetables, that have been blended and formed into bite-sized pieces or strips. |
| Freeze-dried & Jerky Treats | Freeze-dried and jerky treats are snacks given to pets, that are prepared through a special preservation process, without damaging the nutritional content, resulting in long-lasting, nutrient-rich treats. |
| Urinary Tract Disease Diets | These are commercial diets that are specifically formulated to promote urinary health and reduce the risk of urinary tract infections and other urinary problems. |
| Renal Diets | These are specialized pet foods formulated to support the health of pets with kidney disease or renal insufficiency. |
| Digestive Sensitivity Diets | Digestive-sensitive diets are specially formulated to meet the nutritional needs of pets with digestive issues such as food intolerances, allergies, and sensitivities. These diets are designed to be easily digestible and to reduce the symptoms of digestive problems in pets. |
| Oral Care Diets | Oral care diets for pets are specially formulated diets produced to promote oral health and hygiene in pets. |
| Grain-Free Pet Food | Pet food that does not contain common grains like wheat, corn, or soy. Grain-free diets are often preferred by pet owners seeking alternative options or if their pets have specific dietary sensitivities. |
| Premium Pet Food | High-quality pet food formulated with superior ingredients often offers additional nutritional benefits compared to standard pet food. |
| Natural Pet Food | Pet food made from natural ingredients, with minimal processing and without artificial preservatives. |
| Organic Pet Food | Pet food is produced using organic ingredients, free from synthetic pesticides, hormones, and genetically modified organisms (GMOs). |
| Extrusion | A manufacturing process used to produce dry pet food, where ingredients are cooked, mixed, and shaped under high pressure and temperature. |
| Other Pets | Other pets include birds, fish, rabbits, hamsters, ferrets, and reptiles. |
| Palatability | The taste, texture, and aroma of pet food influence its appeal and acceptance by pets. |
| Complete and Balanced Pet Food | Pet food that provides all essential nutrients in appropriate proportions to meet the nutritional needs of pets without additional supplementation. |
| Preservatives | These are the substances that are added to pet food to extend its shelf life and prevent spoilage. |
| Nutraceuticals | Food products that offer health benefits beyond basic nutrition, often contain bioactive compounds with potential therapeutic effects. |
| Probiotics | Live beneficial bacteria that promote a healthy balance of gut flora, supporting digestive health and immune function in pets. |
| Antioxidants | Compounds that help neutralize harmful free radicals in the body, promoting cellular health and supporting the immune system in pets. |
| Shelf-Life | The duration of which pet food remains safe and nutritionally viable for consumption after its production date. |
| Prescription diet | Specialized pet food formulated to address specific medical conditions under veterinary supervision. |
| Allergen | A substance that can cause allergic reactions in some pets, leading to food allergies or sensitivities. |
| Canned food | Wet pet food that is packed in cans and contains higher moisture content than dry food. |
| Limited ingredient diet (LID) | Pet food formulated with a reduced number of ingredients to minimize potential allergens. |
| Guaranteed Analysis | The minimum or maximum levels of certain nutrients present in pet food. |
| Weight management | Pet food designed to help pets maintain a healthy weight or support weight loss efforts. |
| Other Nutraceuticals | It includes prebiotics, antioxidants, digestive fiber, enzymes, essential oils and herbs. |
| Other Veterinary Diets | It includes weight management diets, skin and coat health, cardiac care, and joint care. |
| Other Treats | It includes rawhides, mineral blocks, lickables, and catnips. |
| Other Dry Foods | It includes cereal flakes, mixers, meal toppers, freeze-dried foods, and air-dried foods. |
| Other Animals | It includes birds, fish, reptiles, and small animals (rabbits, ferrets, hamsters). |
| Other Distribution Channels | It includes veterinary clinics, local unregulated stores, and feed and farm stores. |
| Proteins and Peptides | Proteins are large molecules composed of basic units called amino acids which help in the growth and development of pets. Peptides are the short string of 2 to 50 amino acids. |
| Omega-3 fatty acids | Omega-3 fatty acids are essential polyunsaturated fats that play a crucial role in the overall health and well-being of Pets |
| Vitamins | Vitamins are the essential organic compounds that are essential for vital physiological functioning. |
| Minerals | Minerals are naturally occurring inorganic substances that are essential for various physiological functions in pets. |
| CKD | Chronic Kidney Disease |
| DHA | Docosahexaenoic Acid |
| EPA | Eicosapentaenoic Acid |
| ALA | Alpha-linolenic Acid |
| BHA | Butylated Hydroxyanisol |
| BHT | Butylated Hydroxytoluene |
| FLUTD | Feline Lower Urinary Tract Disease |


Research Methodology
Mordor Intelligence follows a four-step methodology in all our reports.
- Step-1: IDENTIFY KEY VARIABLES: In order to build a robust forecasting methodology, the variables and factors identified in Step-1 are tested against available historical market numbers. Through an iterative process, the variables required for market forecast are set and the model is built on the basis of these variables.
- Step-2: Build a Market Model: Market-size estimations for the forecast years are in nominal terms. Inflation is not a part of the pricing, and the average selling price (ASP) is kept constant throughout the forecast period.
- Step-3: Validate and Finalize: In this important step, all market numbers, variables and analyst calls are validated through an extensive network of primary research experts from the market studied. The respondents are selected across levels and functions to generate a holistic picture of the market studied.
- Step-4: Research Outputs: Syndicated Reports, Custom Consulting Assignments, Databases & Subscription Platforms


