North America Dog Food Market Size and Share
Market Overview
| Study Period | 2018 - 2031 |
|---|---|
| Forecast Data Period | 2026 - 2031 |
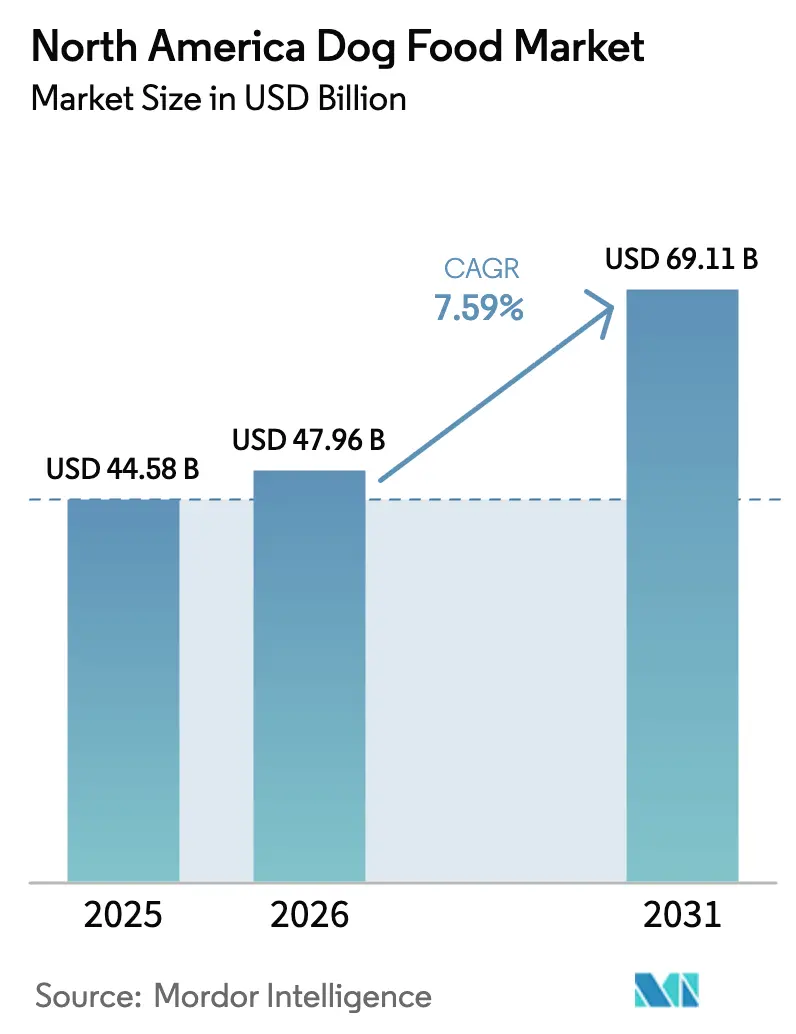
| Base Year Market Size (2025) | USD 44.58 Billion |
| Market Size (2026) | USD 47.96 Billion |
| Market Size (2031) | USD 69.11 Billion |
| Growth Rate (2026 - 2031) | 7.59% CAGR |
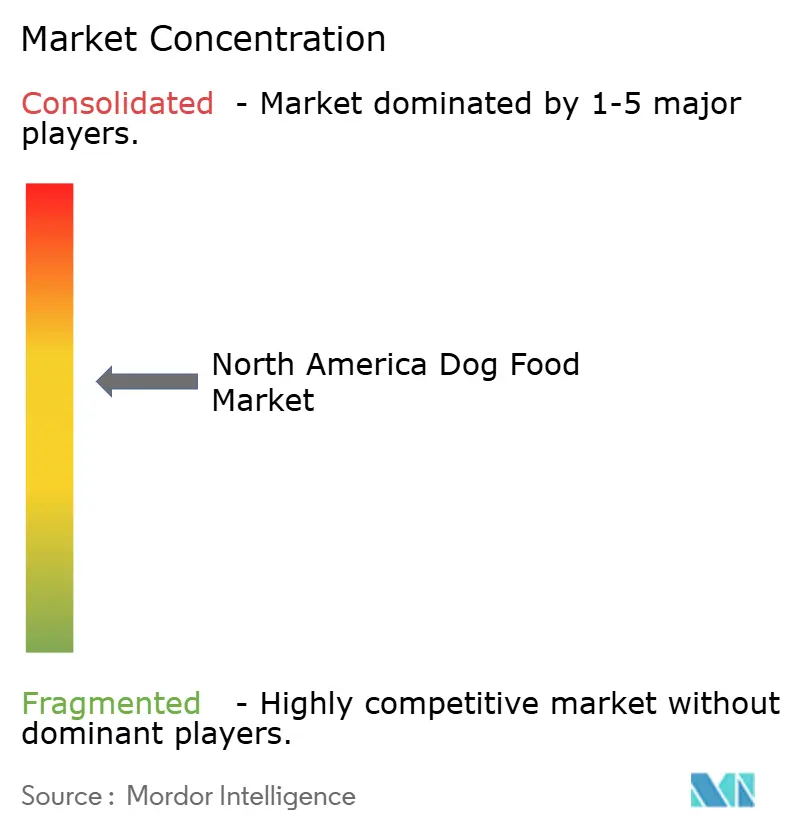
| Market Concentration | Medium |
Major Players *Disclaimer: Major Players sorted in no particular order Image © Mordor Intelligence. Reuse requires attribution under CC BY 4.0. | |
North America Dog Food Market Analysis by Mordor Intelligence
The North America dog food market size is expected to grow from USD 44.58 billion in 2025 to USD 47.96 billion in 2026 and is forecast to reach USD 69.11 billion by 2031 at 7.59% CAGR over 2026-2031. Accelerating pet humanization, demographic shifts favoring millennial and Gen Z dog ownership, and a clear tilt toward functional health formulations keep the North American dog food market on a steady premiumization path. Rapid e-commerce penetration, strategic consolidation among leading manufacturers, and rising demand for sustainable ingredient sourcing continue to shape competitive dynamics. At the same time, volatile meat and grain costs, evolving FAO (Food and Agriculture Organization) and AAFCO (Association of American Feed Control Officials) labeling standards, and tariff-driven supply-chain risks temper profit expansion, forcing brands to balance innovation with cost management. Despite these hurdles, the North American dog Food market remains positioned for durable value growth as subscription models and personalized nutrition platforms deepen customer engagement.
Key Report Takeaways
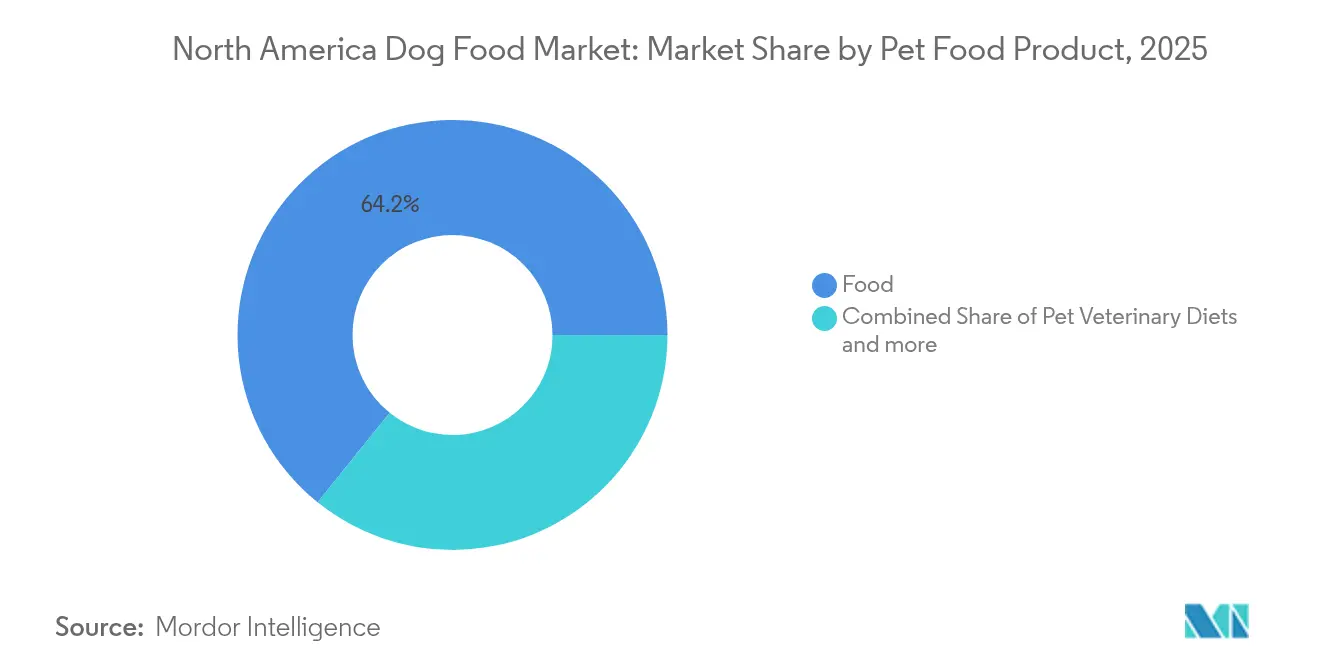
- By product, Food led with 64.20% of the North America dog food market size in 2025, while Pet Veterinary Diets are projected to advance at a 8.87% CAGR through 2031.
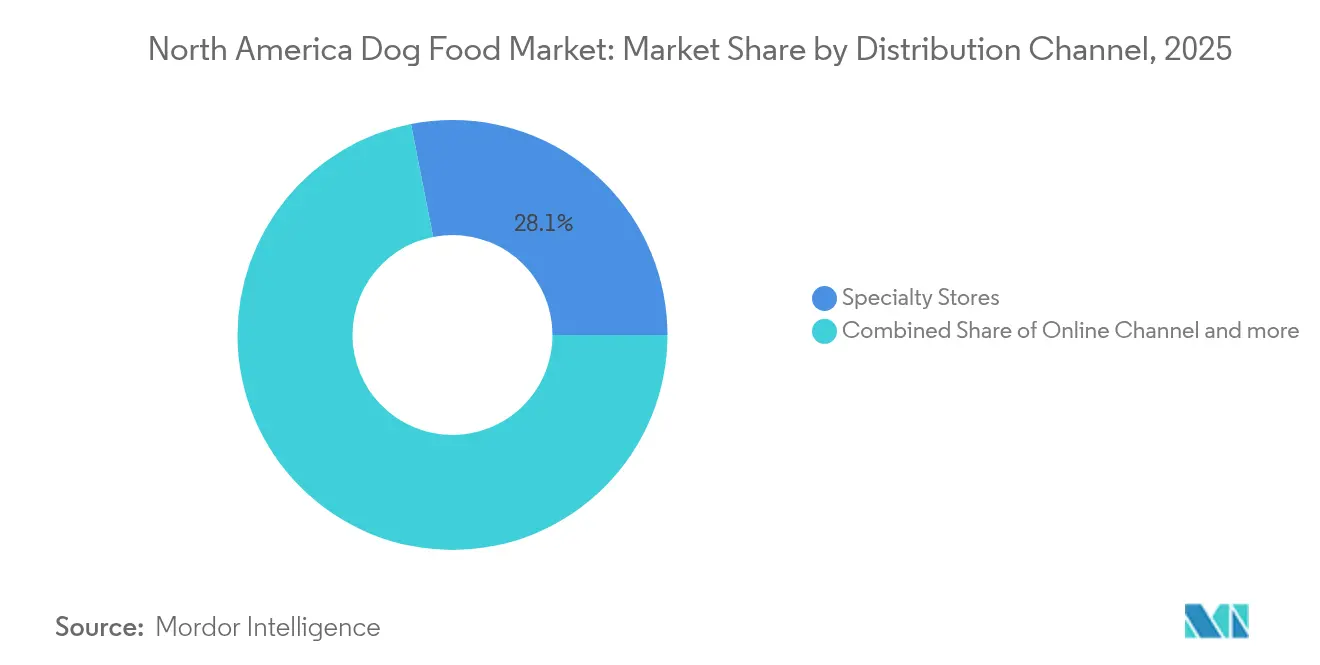
- By distribution channel, Specialty Stores held 28.10% share of the North America dog food market in 2025, while Online Channels are set to expand at a 10.08% CAGR through 2031.
- By geography, the United States accounted for 86.90% of the North American dog Food market size in 2025 and is projected to progress at an 7.94% CAGR to 2031.
- Market concentration remains moderate, with the top players, including Mars, Incorporated, Nestle S.A. (Purina), Colgate-Palmolive Company (Hill's Pet Nutrition, Inc.), General Mills Inc., and Schell & Kampeter, Inc. (Diamond Pet Foods), capturing a combined 53.4% revenue share in 2024
Note: Market size and forecast figures in this report are generated using Mordor Intelligence’s proprietary estimation framework, updated with the latest available data and insights as of 2026.
North America Dog Food Market Trends and Insights
Drivers Impact Analysis*
| Driver | (~) % Impact on CAGR Forecast | Geographic Relevance | Impact Timeline |
|---|---|---|---|
| Accelerating pet humanization and premium-grade nutrition | +1.2% | United States urban markets | Medium term (2-4 years) |
| Expansion of e-commerce and direct-to-consumer channels | +1.8% | United States and urban Canada | Short term (≤ 2 years) |
| Rising adoption rates of dogs across all demographics | +1.5% | Region-wide, millennial and Gen-Z focus | Medium term (2-4 years) |
| Demand for functional ingredients targeting joint, gut, and skin health | +1.1% | Premium specialty retail channels | Long term (≥ 4 years) |
| Rapid uptake of personalized tele-nutrition platforms | +0.9% | United States and urban Canada | Medium term (2-4 years) |
| Commercialization of insect-based proteins as sustainable inputs | +0.7% | Region-wide, regulatory approval pending | Long term (≥ 4 years) |
| Source: Mordor Intelligence | |||


Accelerating Pet Humanization and Premium-Grade Nutrition
Owners are increasingly treating dogs as family members, prompting a willingness to pay premium prices for clean-label, human-grade diets that carry higher margins than mass-market kibble. Social media accelerates the shift by spotlighting ingredient transparency and veterinarian endorsements. Manufacturers answer with gently cooked meals, cereal-inspired treats, and clear sourcing narratives that resonate with younger consumers. The result is sustained trade-up behavior within the North American dog food market, reinforcing brand loyalty and elevating category price floors. Growing adoption of functional claims tied to joint or digestive benefits further widens the premium gap.
Expansion of E-Commerce and Direct-to-Consumer Channels
Online pet food penetration is on track to reach 40% by 2030, driven by the convenience of subscription services and same-day delivery. DoorDash's tie-ups with Pet Supplies Plus and Butcher Box’s cross-sell success highlight how omnichannel strategies can merge local fulfillment with national reach. Direct-to-consumer models unlock customer-level data, which fuels personalized offers and drives higher lifetime value. While logistics expenses and acquisition costs remain high, digital brands bypass traditional retail margins, giving them room to reinvest in innovation. Legacy retailers counter with click-and-collect and auto-ship programs, keeping the North American dog food market intensely competitive online.
Rising Adoption Rates of Dogs Across All Demographics
Post-pandemic ownership gains persist, driving volume growth as millennials and Gen Z households account for one-third of pet parents in 2024. These tech-savvy owners gravitate toward functional nutrition and demand educational content to inform feeding choices. Single-person and delayed-family households view dogs as emotional companions, leading to increased spending on premium food formats that promise holistic wellness. Veterans of the category are also trading up to specialized formulations that address aging-related conditions, ensuring continued value upside for the North American dog food market. Brands must invest in guidance tools to convert first-time buyers into loyal advocates.
Demand for Functional Ingredients Targeting Joint, Gut, and Skin Health
Joint health diets containing glucosamine and omega-3 fatty acids command price premiums, while probiotics and hydrolyzed proteins address rising gastrointestinal concerns. Royal Canin’s 2024 roll-out of five new therapeutic diets underscores the momentum. Skin-and-coat claims leverage omega fatty acids and novel proteins to capture owners of allergy-prone dogs. Brands differentiate through veterinary partnerships and clinical data, which are critical for navigating AAFCO (Association of American Feed Control Officials) compliance. As older dogs remain in the household longer, functional lines deepen their share within the North American Dog Food market.
Restraints Impact Analysis*
| Restraint | (~) % Impact on CAGR Forecast | Geographic Relevance | Impact Timeline |
|---|---|---|---|
| Volatile meat and grain input prices pressuring margins | −1.4% | United States manufacturers | Short term (≤ 2 years) |
| Complex and evolving North American labeling regulations | −0.8% | United States and Canada | Medium term (2-4 years) |
| Tariff-driven supply-chain disruptions for specialty ingredients | −0.6% | United States-Mexico corridor | Short term (≤ 2 years) |
| Higher cost and limited availability of eco-friendly packaging | −0.5% | Region-wide premium brands | Long term (≥ 4 years) |
| Source: Mordor Intelligence | |||
Volatile Meat and Grain Input Prices Pressuring Margins
Ingredients make up as much as 70% of the cost of goods, and 2024 USDA data showed corn prices swinging by 25% over the year. Similar shocks hit protein meals, pushing manufacturers to renegotiate contracts, reformulate recipes, and explore alternative proteins[1]Source: USDA Economic Research Service, “Feed Grains Database,” ers.usda.gov . Consumer surveys reveal that 68% of owners believe tariff costs are reflected in shelf prices, raising concerns about the elasticity of prices. Premium brands defend their pricing through functional parameters, yet mainstream lines face share threats from private labels. Margin pressure is likely to persist, especially for commodity-heavy formulations within the North American dog food market.
Complex and Evolving North American Labeling Regulations
The FAO (Food and Agriculture Organization) and AAFCO (Association of American Feed Control Officials) update demand for stricter substantiation of nutritional claims, while Canada’s CFIA seeks harmonization, adding paperwork layers for cross-border brands. Mexico’s NOM-012-SAG/ZOO-2020 rule set further heightens compliance needs[2]Source: FDA Center for Veterinary Medicine, “Animal and Veterinary,” fda.gov. Small and mid-size players struggle with testing and legal costs, spurring consolidation. Large manufacturers convert regulatory acumen into competitive moats, but must still pass any reformulation costs on to consumers carefully. Overall, regulatory flux hinders near-term agility in the North American dog food market.
*Our forecasts treat driver/restraint impacts as directional, not additive. The impact forecasts reflect baseline growth, mix effects, and variable interactions.
Segment Analysis
By Product: Therapeutic Diets Drive Innovation
Food categories maintain 64.20% North America dog food market size in 2025, with dry pet food dominating through kibble formats that offer convenience and cost efficiency for daily feeding routines. Wet pet food gains traction through premium positioning and hydration benefits, while pet nutraceuticals capture growing demand for targeted health supplementation, including omega-3 fatty acids, probiotics, and joint support formulations.
Pet Veterinary Diets represent the fastest-growing product segment, with a 8.87% CAGR through 2031, driven by the adoption of veterinarian-guided therapeutic nutrition and the increasing number of aging dog populations requiring specialized dietary management. Royal Canin expanded its gastrointestinal portfolio in 2024 with five new therapeutic diets, including hydrolyzed protein formulations for food-sensitive dogs and fiber-response solutions for digestive health management.


By Distribution Channel: Digital Commerce Acceleration
Specialty stores are projected to maintain a 28.10% North America dog food market size in 2025, driven by expert consultation and premium product curation. DoorDash's partnerships with Pet Supplies Plus, spanning 720 locations across the United States, demonstrate omnichannel integration strategies that combine digital convenience with local fulfillment capabilities. Specialty stores particularly excel in offering veterinary diets, premium brands, and specialized nutrition products that are not readily available through other channels. The segment's strength is further reinforced by the increasing consumer preference for high-quality pet food products and the growing trend of pet humanization, where pet owners seek professional advice and premium products for their pets' well-being.
Online channels achieve a 10.08% CAGR through 2031 as subscription models and same-day delivery reshape purchasing behaviors. Online platforms are particularly appealing to modern pet owners due to their ability to provide detailed product information, customer reviews, competitive pricing, and convenient comparison shopping features. The segment's expansion is also supported by the growing presence of major pet food manufacturers and retailers in the digital space, who are investing in enhanced online shopping experiences and efficient delivery systems.
Geography Analysis
The United States maintains overwhelming market dominance, with an 86.90% share in 2025, driven by established pet ownership rates that exceed 65 million dog-owning households and sophisticated distribution networks spanning specialty retailers, e-commerce platforms, and mass-market channels. Growth acceleration at an 7.94% CAGR through 2031 reflects premiumization trends as owners migrate toward functional nutrition products that address specific health needs, including joint mobility, digestive wellness, and skin coat optimization. Mars, Incorporated invested USD 1 billion in technology and data analytics to support the development of personalized nutrition, while Nestle S.A. (Purina) launched over 100 new products in 2024 to capture emerging demand segments.
Canada emerges as a significant growth opportunity through expanding middle-class pet ownership and cross-border supply chain integration that leverages the United States' manufacturing capacity and ingredient sourcing networks. Petcurean launched Go! Solutions functional dog treats in 2024, targeting digestive health, sensitivities management, and weight control through premium meat and fish formulations. Canadian Food Inspection Agency harmonization efforts with United States standards facilitate cross-border trade while maintaining product quality oversight and consumer protection requirements.
Mexico represents an emerging market with favorable demographic trends including urbanization, rising disposable income, and growing pet adoption rates among younger households. The government proposed VAT elimination on pet food to improve affordability, while SENASICA implemented enhanced quality control requirements under NOM-012-SAG/ZOO-2020 regulations. Rest of North America includes smaller markets with limited current penetration but potential for long-term expansion as economic development and pet ownership rates increase across the region.
Competitive Landscape
Market concentration remains moderate, with the top players, including Mars, Incorporated, Nestle S.A. (Purina), Colgate-Palmolive Company (Hill's Pet Nutrition, Inc.), General Mills Inc., and Schell & Kampeter, Inc. (Diamond Pet Foods), capturing a combined 53.4% revenue share in 2024. These market leaders leverage their extensive research and development capabilities, established distribution networks, and strong brand recognition to maintain their competitive positions. Regional players and specialists maintain their presence by focusing on specific market segments such as premium natural products or specialized veterinary diets, though their market share remains relatively limited compared to the major conglomerates.
The market has witnessed significant merger and acquisition activity, with major players acquiring smaller specialized companies to expand their product portfolios and gain access to emerging market segments. These acquisitions have particularly focused on companies specializing in premium pet food, natural ingredients, and innovative production technologies. The trend towards consolidation has been driven by the need to achieve economies of scale, expand geographic presence, and acquire specialized expertise in growing segments such as fresh pet food and customized nutrition solutions.
Success in the North American dog food market increasingly depends on companies' ability to innovate across product formulations, packaging, and distribution channels. Incumbent players must focus on expanding their premium and specialized product offerings while maintaining strong relationships with veterinarians and pet specialty retailers. Investment in research and development, particularly in areas such as personalized nutrition and functional ingredients, remains crucial for maintaining a competitive advantage. Companies must also strengthen their digital capabilities and direct-to-consumer channels while maintaining a traditional retail presence.
North America Dog Food Industry Leaders
Mars, Incorporated
Colgate-Palmolive Company (Hill's Pet Nutrition, Inc.)
General Mills Inc.
Schell & Kampeter, Inc. (Diamond Pet Foods)
Nestle S.A. (Purina)
- *Disclaimer: Major Players sorted in no particular order

Recent Industry Developments
- July 2025: General Mills has launched two new initiatives within its North American Pet segment, focusing on Blue Buffalo and Edgard & Cooper. These launches aim to address changing preferences among pet owners and drive growth in the pet food market. Blue Buffalo is expanding into the fresh pet food category with its "Love Made Fresh" line, offering multiple formats and a range of flavorful recipes. These products are designed to serve as a standalone fresh food option or complement Blue Buffalo's existing dry dog food portfolio.
- July 2023: Hill's Pet Nutrition introduced its new MSC (Marine Stewardship Council) certified pollock and insect protein products for pets with sensitive stomachs and skin lines. They contain vitamins, omega-3 fatty acids, and antioxidants.
- March 2023: Colgate-Palmolive Company's pet care subsidiary Hill’s Pet Nutrition launched its new line of prescription diets to support pets diagnosed with cancer. This prescription line, Diet ONC Care, offers complete and balanced formulas in both dry and wet forms for cats and dogs.


North America Dog Food Market Report Scope
Food, Pet Nutraceuticals/Supplements, Pet Treats, Pet Veterinary Diets are covered as segments by Pet Food Product. Convenience Stores, Online Channel, Specialty Stores, Supermarkets/Hypermarkets are covered as segments by Distribution Channel. Canada, Mexico, United States are covered as segments by Country.| Food | By Sub Product | Dry Pet Food | By Sub Dry Pet Food | Kibbles |
| Other Dry Pet Food | ||||
| Wet Pet Food | ||||
| Pet Nutraceuticals/Supplements | By Sub Product | Milk Bioactives | ||
| Omega-3 Fatty Acids | ||||
| Probiotics | ||||
| Proteins and Peptides | ||||
| Vitamins and Minerals | ||||
| Other Nutraceuticals | ||||
| Pet Treats | By Sub Product | Crunchy Treats | ||
| Dental Treats | ||||
| Freeze-dried and Jerky Treats | ||||
| Soft and Chewy Treats | ||||
| Other Treats | ||||
| Pet Veterinary Diets | By Sub Product | Diabetes | ||
| Digestive Sensitivity | ||||
| Oral Care Diets | ||||
| Renal | ||||
| Urinary tract disease | ||||
| Obesity Diets | ||||
| Derma Diets | ||||
| Other Veterinary Diets |
| Convenience Stores |
| Online Channel |
| Specialty Stores |
| Supermarkets/Hypermarkets |
| Other Channels |
| United States |
| Canada |
| Mexico |
| Rest of North America |
| Pet Food Product | Food | By Sub Product | Dry Pet Food | By Sub Dry Pet Food | Kibbles |
| Other Dry Pet Food | |||||
| Wet Pet Food | |||||
| Pet Nutraceuticals/Supplements | By Sub Product | Milk Bioactives | |||
| Omega-3 Fatty Acids | |||||
| Probiotics | |||||
| Proteins and Peptides | |||||
| Vitamins and Minerals | |||||
| Other Nutraceuticals | |||||
| Pet Treats | By Sub Product | Crunchy Treats | |||
| Dental Treats | |||||
| Freeze-dried and Jerky Treats | |||||
| Soft and Chewy Treats | |||||
| Other Treats | |||||
| Pet Veterinary Diets | By Sub Product | Diabetes | |||
| Digestive Sensitivity | |||||
| Oral Care Diets | |||||
| Renal | |||||
| Urinary tract disease | |||||
| Obesity Diets | |||||
| Derma Diets | |||||
| Other Veterinary Diets | |||||
| Distribution Channel | Convenience Stores | ||||
| Online Channel | |||||
| Specialty Stores | |||||
| Supermarkets/Hypermarkets | |||||
| Other Channels | |||||
| Country | United States | ||||
| Canada | |||||
| Mexico | |||||
| Rest of North America | |||||


Market Definition
- FUNCTIONS - Pet foods are usually intended to provide complete and balanced nutrition to the pet but are primarily used as functional products. The scope includes the food and supplements consumed by pets including veterinary diets. Supplements/nutraceuticals that are directly supplied to pets are considered within the scope.
- RESELLERS - Companies engaged in reselling of pet food without value addition have been excluded from the market scope, in order to avoid double counting.
- END CONSUMERS - Pet owners are considered to be the end-consumers in the market studied.
- DISTRIBUTION CHANNELS - Supermarkets/hypermarkets, specialty stores, convenience stores, online channels and other channels are considered within the scope. The stores which are exclusively providing pet related basic and custom products are considered within the scope of specialty stores.
| Keyword | Definition |
|---|---|
| Pet Food | The scope of pet food includes the food that is eatable by pets including food, treats, veterinary diets, and nutraceuticals/supplements. |
| Food | Food is animal feed intended for consumption by pets. It is formulated to provide essential nutrients and meet the dietary needs of various types of pets, including dogs, cats, and other animals. These are generally segmented into dry and wet pet foods. |
| Dry Pet Food | Dry pet foods may be extruded/baked (kibbles) or flaked. They have a lower moisture content, typically around 12-20%. |
| Wet Pet Food | Wet pet food, also known as canned pet food or moist pet food, generally has a higher moisture content compared to dry pet food, often ranging from 70-80%. |
| Kibbles | Kibbles are dry, processed pet food in small, bite-sized pieces or pellets. They are specifically formulated to provide balanced nutrition for various domestic animals, such as dogs, cats, and other animals. |
| Treats | Pet Treats are special food items or rewards given to pets, to show affection, and encourage good behavior. They are especially used during training. Pet treats are made from various combinations of meat or meat-derived materials with other ingredients. |
| Dental Treats | Pet dental treats are specialized treats that are formulated to promote good oral hygiene in pets. |
| Crunchy Treats | It is a type of pet treat that has a firm and crispy texture which can be a good source of nutrition for pets. |
| Soft and chewy treats | Soft and Chewy pet treats are a type of pet food product that is formulated to be easy to chewy and digest. They are usually made from soft and pliable ingredients, such as meat, poultry, or vegetables, that have been blended and formed into bite-sized pieces or strips. |
| Freeze-dried & Jerky Treats | Freeze-dried and jerky treats are snacks given to pets, that are prepared through a special preservation process, without damaging the nutritional content, resulting in long-lasting, nutrient-rich treats. |
| Urinary Tract Disease Diets | These are commercial diets that are specifically formulated to promote urinary health and reduce the risk of urinary tract infections and other urinary problems. |
| Renal Diets | These are specialized pet foods formulated to support the health of pets with kidney disease or renal insufficiency. |
| Digestive Sensitivity Diets | Digestive-sensitive diets are specially formulated to meet the nutritional needs of pets with digestive issues such as food intolerances, allergies, and sensitivities. These diets are designed to be easily digestible and to reduce the symptoms of digestive problems in pets. |
| Oral Care Diets | Oral care diets for pets are specially formulated diets produced to promote oral health and hygiene in pets. |
| Grain-Free Pet Food | Pet food that does not contain common grains like wheat, corn, or soy. Grain-free diets are often preferred by pet owners seeking alternative options or if their pets have specific dietary sensitivities. |
| Premium Pet Food | High-quality pet food formulated with superior ingredients often offers additional nutritional benefits compared to standard pet food. |
| Natural Pet Food | Pet food made from natural ingredients, with minimal processing and without artificial preservatives. |
| Organic Pet Food | Pet food is produced using organic ingredients, free from synthetic pesticides, hormones, and genetically modified organisms (GMOs). |
| Extrusion | A manufacturing process used to produce dry pet food, where ingredients are cooked, mixed, and shaped under high pressure and temperature. |
| Other Pets | Other pets include birds, fish, rabbits, hamsters, ferrets, and reptiles. |
| Palatability | The taste, texture, and aroma of pet food influence its appeal and acceptance by pets. |
| Complete and Balanced Pet Food | Pet food that provides all essential nutrients in appropriate proportions to meet the nutritional needs of pets without additional supplementation. |
| Preservatives | These are the substances that are added to pet food to extend its shelf life and prevent spoilage. |
| Nutraceuticals | Food products that offer health benefits beyond basic nutrition, often contain bioactive compounds with potential therapeutic effects. |
| Probiotics | Live beneficial bacteria that promote a healthy balance of gut flora, supporting digestive health and immune function in pets. |
| Antioxidants | Compounds that help neutralize harmful free radicals in the body, promoting cellular health and supporting the immune system in pets. |
| Shelf-Life | The duration of which pet food remains safe and nutritionally viable for consumption after its production date. |
| Prescription diet | Specialized pet food formulated to address specific medical conditions under veterinary supervision. |
| Allergen | A substance that can cause allergic reactions in some pets, leading to food allergies or sensitivities. |
| Canned food | Wet pet food that is packed in cans and contains higher moisture content than dry food. |
| Limited ingredient diet (LID) | Pet food formulated with a reduced number of ingredients to minimize potential allergens. |
| Guaranteed Analysis | The minimum or maximum levels of certain nutrients present in pet food. |
| Weight management | Pet food designed to help pets maintain a healthy weight or support weight loss efforts. |
| Other Nutraceuticals | It includes prebiotics, antioxidants, digestive fiber, enzymes, essential oils and herbs. |
| Other Veterinary Diets | It includes weight management diets, skin and coat health, cardiac care, and joint care. |
| Other Treats | It includes rawhides, mineral blocks, lickables, and catnips. |
| Other Dry Foods | It includes cereal flakes, mixers, meal toppers, freeze-dried foods, and air-dried foods. |
| Other Animals | It includes birds, fish, reptiles, and small animals (rabbits, ferrets, hamsters). |
| Other Distribution Channels | It includes veterinary clinics, local unregulated stores, and feed and farm stores. |
| Proteins and Peptides | Proteins are large molecules composed of basic units called amino acids which help in the growth and development of pets. Peptides are the short string of 2 to 50 amino acids. |
| Omega-3 fatty acids | Omega-3 fatty acids are essential polyunsaturated fats that play a crucial role in the overall health and well-being of Pets |
| Vitamins | Vitamins are the essential organic compounds that are essential for vital physiological functioning. |
| Minerals | Minerals are naturally occurring inorganic substances that are essential for various physiological functions in pets. |
| CKD | Chronic Kidney Disease |
| DHA | Docosahexaenoic Acid |
| EPA | Eicosapentaenoic Acid |
| ALA | Alpha-linolenic Acid |
| BHA | Butylated Hydroxyanisol |
| BHT | Butylated Hydroxytoluene |
| FLUTD | Feline Lower Urinary Tract Disease |


Research Methodology
Mordor Intelligence follows a four-step methodology in all our reports.
- Step-1: IDENTIFY KEY VARIABLES: In order to build a robust forecasting methodology, the variables and factors identified in Step-1 are tested against available historical market numbers. Through an iterative process, the variables required for market forecast are set and the model is built on the basis of these variables.
- Step-2: Build a Market Model: Market-size estimations for the forecast years are in nominal terms. Inflation is not a part of the pricing, and the average selling price (ASP) is kept constant throughout the forecast period.
- Step-3: Validate and Finalize: In this important step, all market numbers, variables and analyst calls are validated through an extensive network of primary research experts from the market studied. The respondents are selected across levels and functions to generate a holistic picture of the market studied.
- Step-4: Research Outputs: Syndicated Reports, Custom Consulting Assignments, Databases & Subscription Platforms


