Cat Food Market Size and Share
Market Overview
| Study Period | 2021 - 2031 |
|---|---|
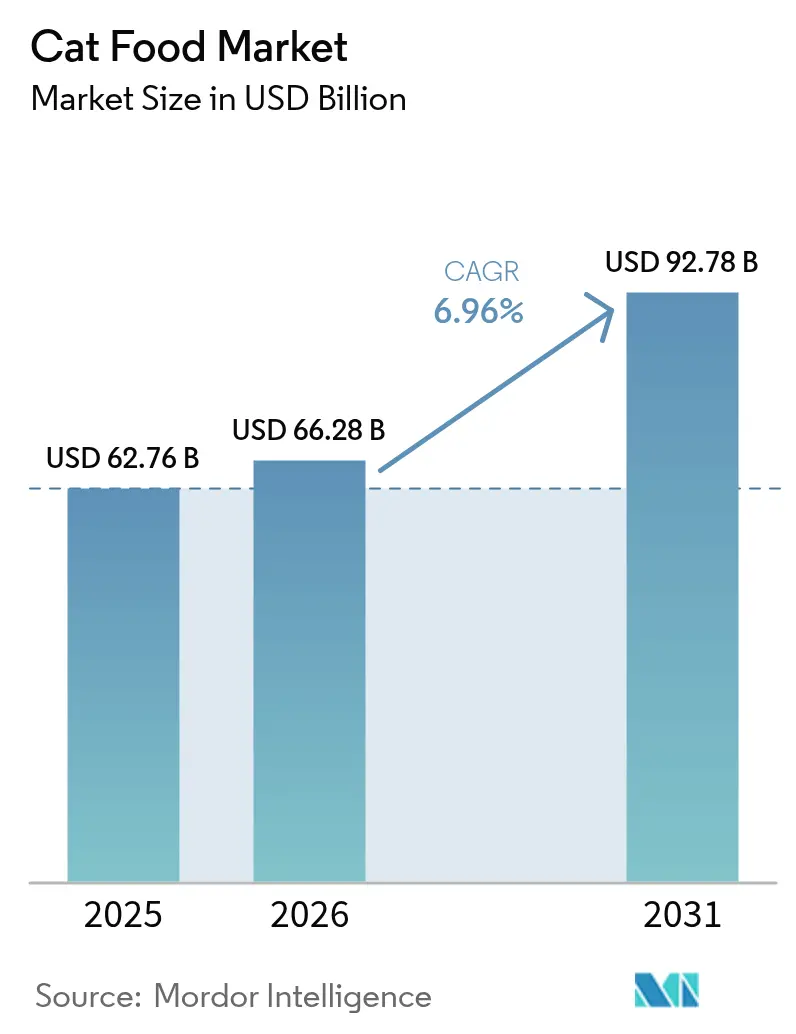
| Market Size (2026) | USD 66.28 Billion |
| Market Size (2031) | USD 92.78 Billion |
| Growth Rate (2026 - 2031) | 6.96% CAGR |
| Fastest Growing Market | South America |
| Largest Market | North America |
| Market Concentration | Medium |
Major Players *Disclaimer: Major Players sorted in no particular order Image © Mordor Intelligence. Reuse requires attribution under CC BY 4.0. | |
Cat Food Market Analysis by Mordor Intelligence
Cat food market size was valued at USD 62.76 billion in 2025 and estimated to grow from USD 66.28 billion in 2026 to reach USD 92.78 billion by 2031, at a CAGR of 6.96% during the forecast period (2026-2031). Structural shifts in pet humanization underpin this expansion as single-person and senior households increasingly view felines as family members deserving premium nutrition. Premiumization of wet and soft-natural recipes has widened price corridors, while supply-chain investments in insect and single-cell proteins temper commodity volatility. North America retained the spending lead, and yet South America is forecast to post the fastest regional climb, as Brazilian and Argentine households migrate online for specialty formats. Competitive concentration remains moderate, with Mars and Nestlé holding a combined significant revenue share, leveraging procurement scale and omnichannel reach to deter mid-tier rivals.
Key Report Takeaways
- By pet food product category, food was the largest segment, accounting for 69.4% of the cat food market share in 2025, and pet nutraceuticals and supplements are the fastest-growing, projected to expand at an 8.9% CAGR to 2031.
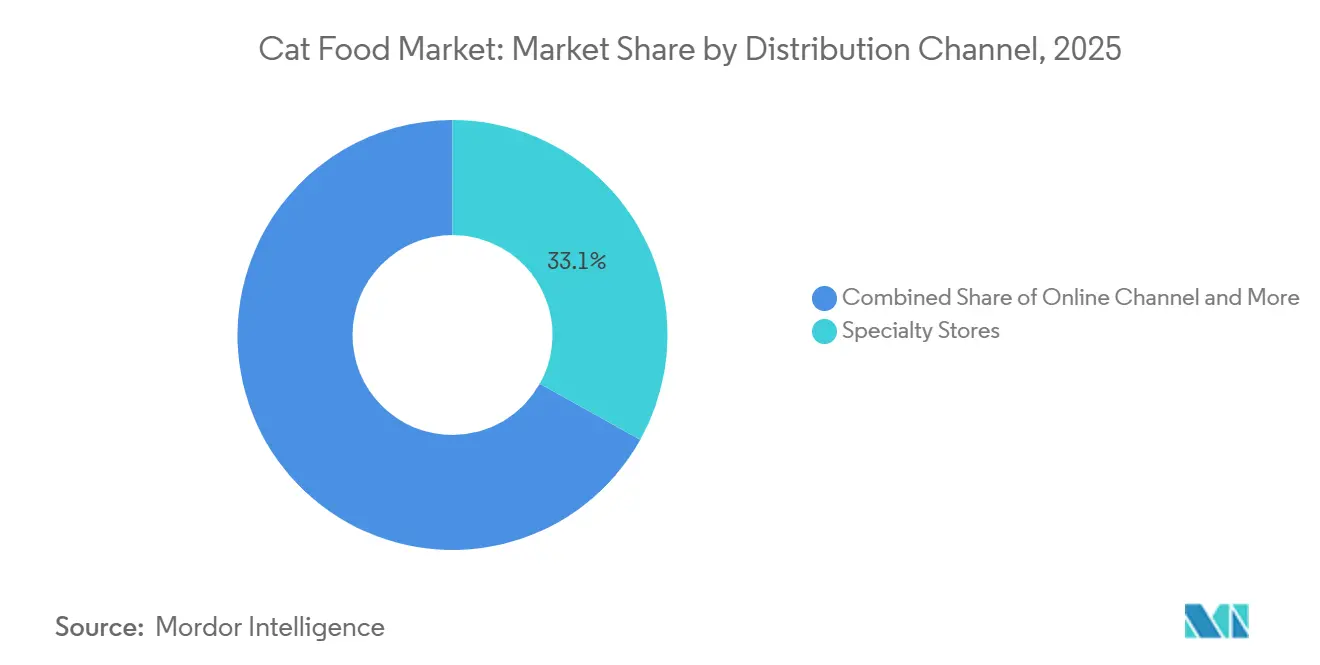
- By distribution channel, specialty stores were the largest segment, accounting for 33.1% of the cat food market size in 2025, while online stores were the fastest-growing, with a projected CAGR of 8.9% through 2031.
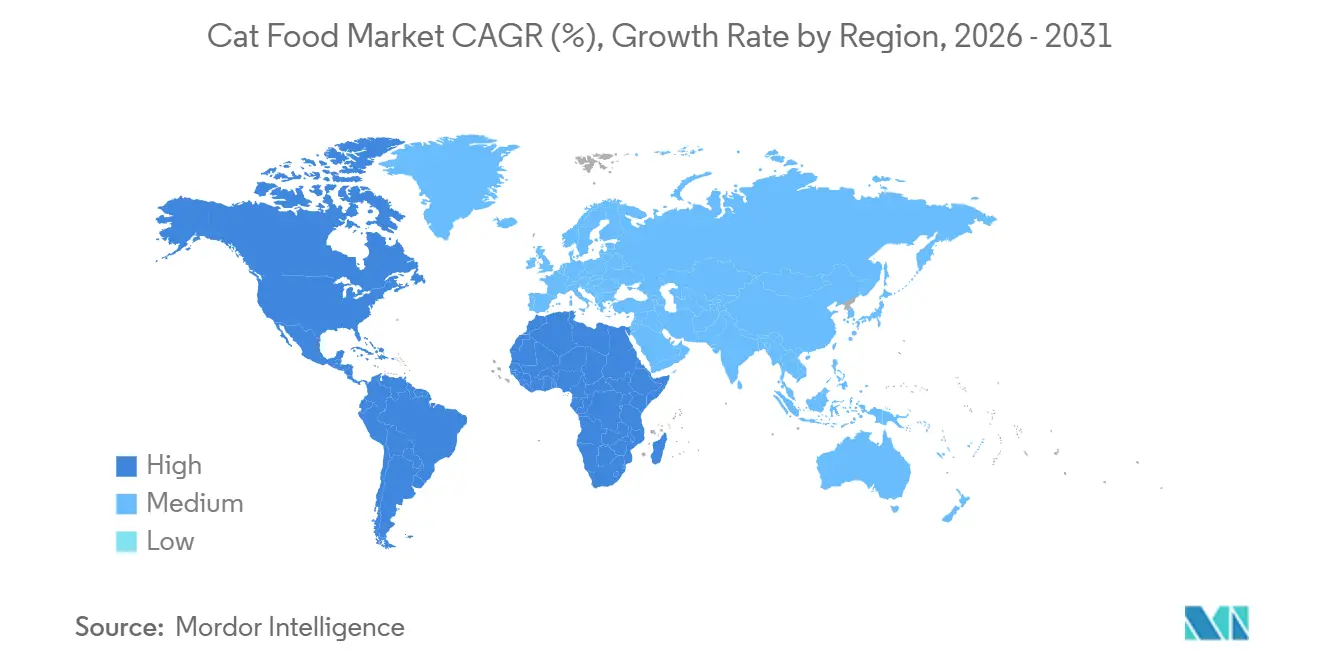
- By geography, North America was the largest region, accounting for 39.7% of the cat food market share in 2025, and South America is the fastest-growing region projected to advance at an 8.6% CAGR through 2031.
Note: Market size and forecast figures in this report are generated using Mordor Intelligence’s proprietary estimation framework, updated with the latest available data and insights as of 2026.
Global Cat Food Market Trends and Insights
Drivers Impact Analysis*
| Driver | (~) % Impact on CAGR Forecast | Geographic Relevance | Impact Timeline |
|---|---|---|---|
| Dry food affordability and long shelf life | +1.2% | Global, with highest impact in South America, Africa, and Southeast Asia | Long term (≥ 4 years) |
| Rising cat ownership among single-person and senior households | +1.5% | North America, Europe, and urban Asia-Pacific | Medium term (2-4 years) |
| Premiumization of wet and soft-natural formats | +1.8% | North America, Western Europe, and affluent Asia-Pacific metros | Medium term (2-4 years) |
| Surge in e-commerce and Direct-to-Consumer (DTC) subscription models | +1.3% | Global, led by North America, Europe, and China | Short term (≤ 2 years) |
| Insect and single-cell protein adoption in recipes | +0.6% | Europe, North America, and select Asia-Pacific markets | Long term (≥ 4 years) |
| AI-driven personalization of feline nutrition plans | +0.5% | North America, Western Europe, and Japan | Long term (≥ 4 years) |
| Source: Mordor Intelligence | |||
Dry Food Affordability and Long Shelf Life
Dry cat food (kibble) continues to serve as the primary volume driver in the global cat food market due to its affordability, storage convenience, and supply chain reliability. Compared to wet food formats, dry food benefits from lower production, transportation, and refrigeration costs, making it more scalable in emerging markets. Its shelf life of 12 to 18 months minimizes spoilage risks for both retailers and households, particularly in areas with limited cold-chain infrastructure. These economic advantages encourage first-time pet food buyers to choose commercial packaged products over homemade feeding, contributing to sustained market growth. In Southeast Asia, increasing urbanization in countries such as Indonesia, Vietnam, and the Philippines has led to greater supermarket penetration. Dry food dominates shelf space in these regions due to its cost-effectiveness and logistical advantages.
Rising Cat Ownership Among Single-Person and Senior Households
Demographic changes, such as the rise in smaller households and aging populations, are positively impacting the cat food market. Cats are often preferred over dogs in urban apartments due to their lower maintenance needs and suitability for smaller living spaces. Single professionals and elderly individuals often choose cats for companionship, as they require less time and effort than dogs. This trend is driving an increase in per-capita pet food demand. According to the American Pet Products Association’s 2025 Dog and Cat Report, cat ownership increased by 23% in 2024, with 49 million United States households owning at least one cat, compared to 40 million in 2023[1]Source: American Pet Products Association, “2025–2026 National Pet Owners Survey: Dog and Cat Ownership Trends,” americanpetproducts.org. Nearly 40% of American households now include a cat, reflecting a significant rise in feline companionship. As household fragmentation continues globally, the adoption of cats remains a key driver of market demand.
Premiumization of Wet and Soft-Natural Formats
Premium wet and soft-natural cat food formats are contributing to value growth in developed markets. Wet food is considered more in line with a cat’s natural carnivorous diet due to its higher moisture and protein content. Soft-natural and limited-ingredient recipes cater to consumer demand for clean labels, higher meat content, and fewer artificial additives. These attributes support higher average selling prices and margin growth. The expansion of grain-free and human-grade wet food brands in the United States and Germany highlights this trend. Urban consumers in China are increasingly purchasing imported premium wet food through cross-border e-commerce, driven by rising disposable incomes and the growing trend of pet humanization. Premiumization is also fostering innovation in packaging formats, such as pouches and single-serve trays, as well as functional claims, including digestive health, urinary support, and hairball control. As consumers shift from mass-market kibble to specialized wet food formats, the category's overall value grows, even if volume growth remains moderate.
Insect and Single-Cell Protein Adoption in Recipes
Sustainability concerns and the need for protein diversification are driving the incorporation of insect protein and microbial single-cell protein into cat food formulations. Insect protein, such as black soldier fly larvae, provides high digestibility, requires less land, and generates lower greenhouse gas emissions compared to traditional livestock-based proteins. This development resonates with environmentally conscious consumers. In 2023, Hill's Pet Nutrition introduced new Marine Stewardship Council (MSC)-certified pollock and insect protein products designed for pets with sensitive stomachs and skin[2]Source: Hill's Pet Nutrition, “Hill's Introduces MSC-Certified Pollock and Insect Protein Formulas for Sensitive Pets,” hillspet.com. These products include vitamins, omega-3 fatty acids, and antioxidants. Single-cell proteins produced through the fermentation of methane or hydrogen emit 90% less greenhouse gas per kilogram compared to beef production. This makes them Environmental, Social, and Governance (ESG)-compliant alternatives, appealing to institutional investors who prioritize climate-focused investment criteria.
Restraints Impact Analysis*
| Restraint | (~) % Impact on CAGR Forecast | Geographic Relevance | Impact Timeline |
|---|---|---|---|
| Volatile meat and ocean fish input costs | -1.4% | Global, with acute impact in Asia-Pacific and Europe | Short term (≤ 2 years) |
| Stringent global labeling and Food Safety Modernization Act (FSMA)-style rules | -0.8% | North America, Europe, and select Asia-Pacific markets | Medium term (2-4 years) |
| Premium price sensitivity during inflationary cycles | -0.9% | Global, concentrated in emerging markets | Short term (≤ 2 years) |
| High carbon footprint scrutiny on beef-based recipes | -0.5% | Europe, North America, and institutional investor markets | Long term (≥ 4 years) |
| Source: Mordor Intelligence | |||
Stringent Global Labeling and Food Safety Modernization Act (FSMA)-Style Rules
Regulatory frameworks, such as the United States Food Safety Modernization Act (FSMA) and European Union feed safety laws, enforce stringent requirements for traceability, safety validation, and labeling. Insect-based ingredients must meet safety equivalence standards, disclose allergens, and comply with approved species regulations before commercialization. In February 2026, the United States Food and Drug Administration announced several measures related to implementing the Food Traceability Rule, a critical component of the Food Safety Modernization Act (FSMA) designed to enhance the tracking and tracing of foods, including pet food, throughout the supply chain[3]Source: U.S. Food and Drug Administration, “FDA Takes Steps to Advance Implementation of the Food Traceability Rule,” fda.gov. European regulations introducing front-of-pack nutrient scoring have extended product development timelines by up to nine months. Such regulatory barriers increase compliance expenses and hinder rapid international expansion, thereby affecting the market.
High Carbon Footprint Scrutiny on Beef-Based Recipes
Beef production generates 27 kg of CO₂-equivalent per kilogram of protein, which is approximately seven times higher than insect protein. This has led to increased scrutiny of Scope 3 emissions for companies in the cat food market. Although insect protein offers sustainability advantages, many insect-based cat foods are marketed alongside reduced-beef formulations because beef has a substantial carbon footprint. Rising Environmental, Social, and Governance (ESG) scrutiny and carbon labeling initiatives are also exerting indirect pressure on the premium protein segment, including alternative-protein blends. Institutional investors are increasingly evaluating Scope 3 emissions in their portfolio companies, influencing decisions on ingredient sourcing. Reformulating products to lower beef content, however, can affect recipe palatability for certain feline populations, requiring extended feeding trials. These trials may delay product launches, increase development costs, and affect market performance.
*Our forecasts treat driver/restraint impacts as directional, not additive. The impact forecasts reflect baseline growth, mix effects, and variable interactions.
Segment Analysis
By Pet Food Product: Nutraceuticals Accelerate Preventive Care
Food was the largest segment, leading with 69.4% of the cat food market share in 2025, yet innovation in dry kibble and wet retort pouches increasingly borrows from human wellness tropes, such as keto or low-glycemic formulations. Dry kibble continues to dominate in terms of scale, while wet food formats achieve higher per-unit spending as consumers prioritize hydration benefits for their pets. Many treats are formulated with active ingredients, enabling pet owners to enhance their cats' diets without transitioning to a new primary food. This approach contributes to increased average order values within the United States cat food market. Freeze-dried formats are notable for their moisture-removal process, which preserves nutrient integrity while providing a crunchy texture that appeals to cats. Dental treats, endorsed by veterinarians for their tartar-reducing properties, often feature certification seals that justify their premium pricing.
Pet nutraceuticals and supplements are fastest-growing, projected to expand at an 8.9% CAGR to 2031, clearly outpacing the broader cat food market. Pet nutraceuticals, though a smaller segment, are growing in importance within the cat food market and are influencing cross-merchandising opportunities with main meal products. Digestive supplements that combine probiotics and omega-3 gels exemplify the merging of therapeutic benefits with consumer-oriented treats, challenging traditional product categories. Treats are also increasingly used as training aids, with freeze-dried poultry dice commanding significantly higher prices per ounce than standard kibble. Despite their premium pricing, these products perform well in specialty aisles focused on natural, high-quality offerings.


By Distribution Channel: Online Channels Lead Growth
Specialty stores accounted for 33.1% of the cat food market size in 2025, maintaining leadership due to knowledgeable staff who effectively upsell premium and veterinary diets. Their advisory-driven sales model strengthens consumer trust and supports higher-margin products. However, intensifying competition from online platforms is pressuring these retailers to match discounts, gradually compressing margins. Supermarkets and hypermarkets continue to serve price-sensitive consumers and impulse buyers, but limited shelf space limits their ability to compete in premium assortments, resulting in gradual share erosion in higher-value categories.
Online channels are the fastest-growing segment, projected to register the highest CAGR of 8.9% through 2031. E-commerce platforms increasingly deploy AI-driven recommendation engines to bundle complementary products such as litter and treats, thereby raising average order values and improving customer retention. The channel shift is reinforcing omnichannel strategies, where consumers purchase bulk or heavy items such as dry kibble online for home delivery while relying on specialty stores for product discovery, sampling, and nutritional consultation. Meanwhile, convenience stores are expanding their relevance in dense urban areas by offering single serve pouches and small pack formats suited to compact living spaces and immediate consumption needs. In Japan, where convenience stores significantly outnumber supermarkets in metropolitan areas, this format continues to capture incremental demand, contributing to steady year over year channel growth.
Geography Analysis
North America was the largest region, accounting for 39.7% of the cat food market share in 2025, driven by therapeutic diets and subscription penetration of online orders. Canada’s bilingual-label rules and stricter disclosure requirements have cultivated consumer trust, enabling organic and natural claims for new products. Mexico’s expanding middle class drove strong sales growth as Mercado Libre bundled pet staples into quick-commerce grocery deliveries. Regulatory oversight from the Food and Drug Administration (FDA) and the Association of American Feed Control Officials (AAFCO) ensures uniform nutrient profiles, though state-level definition quirks complicate nationwide consistency in the United States.
South America is the fastest-growing region, projected to advance at an 8.6% CAGR through 2031, the quickest globally. Brazil represented significant regional revenue, as millennial owners in São Paulo and Rio de Janeiro earmark increased household budgets for pets. Argentina's economic volatility limited the adoption of premium products. However, the volume of dry kibble increased as consumers prioritized affordability and shelf stability amid currency fluctuations. In South America, e-commerce platforms such as MercadoLibre and local alternatives have expanded, offering installment payment options that help reduce upfront cost barriers for premium purchases.
In Europe, sustainability regulations and supermarket private labels play a significant role in shaping the market. The United Kingdom has experienced premium growth in the cat food segment, despite challenges related to post-Brexit labeling requirements. The Asia-Pacific region represents a dynamic and evolving market. In China, urban households are shifting from feeding table scraps to providing complete diets, positioning the country as the largest incremental contributor to the cat food market. Local factories in the region co-pack for global brands, helping to reduce tariff exposure. Meanwhile, Japan and Australia emphasize innovations in single-source protein claims, and India is in the early stages of growth, focusing on entry-level kibble products. These products are initially positioned for value but are gradually targeting premium segments as disposable incomes increase.

Competitive Landscape
The Cat Food Market exhibits moderate concentration, dominated by global multinational corporations with diverse product portfolios. Mars, Incorporated, Nestle (Purina), Colgate-Palmolive Company (Hill's Pet Nutrition, Inc.), General Mills Inc., and The J.M. Smucker Company are major players, accounting for a significant share in 2025. Each leverages multi-brand portfolios that span economy to prescription lines, securing shelf breadth and veterinary trust.
Blue Buffalo, Wellness Pet Company, and Unicharm are challenging established players by promoting limited-ingredient or raw-inspired offerings that align with the trend toward premiumization. Technology is driving the next phase of development. Opportunities are focused on three key areas: therapeutic diets targeting emerging markets with limited veterinary infrastructure, freeze-dried formats offering substantial gross margins, and AI-driven personalization platforms that provide proprietary consumption data unavailable to traditional retailers.
Technology adoption emphasizes supply chain transparency, as demonstrated by Nestlé's blockchain initiatives that allow consumers to trace salmon back to specific Norwegian farms. Additionally, smart packaging with embedded sensors monitors product freshness. Regulatory compliance with Association of American Feed Control Officials (AAFCO) standards creates significant barriers to entry, as clinical validation for therapeutic claims requires multi-year feeding trials at high per-formulation costs.
Cat Food Industry Leaders
Colgate-Palmolive Company (Hill's Pet Nutrition Inc.)
Mars Incorporated
Nestle (Purina)
The J. M. Smucker Company
General Mills Inc.
- *Disclaimer: Major Players sorted in no particular order

Recent Industry Developments
- August 2025: Mars invested USD 2 billion to expand its food segment, including the construction of cat and pet care manufacturing facilities in the United States. The expansion includes a USD 240 million Nature's Bakery facility in Utah and a USD 450 million Royal Canin manufacturing site in Ohio.
- February 2025: Colgate-Palmolive Company acquired Care TopCo Pty Ltd, the owner of Australian pet food brand Prime100. The acquisition aligns with Colgate's strategy to expand its Hill's Pet Nutrition division into the fresh pet food segment, including cat food. This purchase enhances Hill's existing specialty pet food portfolio and expands its market presence in Australia.
- November 2024: General Mills acquired the North American assets of Whitebridge, which includes premium cat food brands Tiki Pets and Cloud Star, for USD 1.45 billion.


Global Cat Food Market Report Scope
Cat food is a specially formulated nutritional product designed for domestic cats, which are obligate carnivores requiring high-protein diets that include meat, fat, and essential nutrients such as taurine.
The report on the Cat Food Market provides a detailed analysis across key product categories such as food, pet nutraceuticals/supplements, pet treats, and pet veterinary diets. It further examines the market by distribution channel, covering convenience stores, online platforms, specialty stores, supermarkets or hypermarkets, and other channels, as well as by geography across Africa, Asia-Pacific, Europe, North America, and South America. Market size estimates and forecasts are presented in terms of value in USD and volume in metric tons.
| Food | By Sub Product | Dry Pet Food | By Sub Dry Pet Food | Kibbles |
| Other Dry Pet Food | ||||
| Wet Pet Food | ||||
| Pet Nutraceuticals/Supplements | By Sub Product | Milk Bioactives | ||
| Omega-3 Fatty Acids | ||||
| Probiotics | ||||
| Proteins and Peptides | ||||
| Vitamins and Minerals | ||||
| Other Nutraceuticals | ||||
| Pet Treats | By Sub Product | Crunchy Treats | ||
| Dental Treats | ||||
| Freeze-dried and Jerky Treats | ||||
| Soft and Chewy Treats | ||||
| Other Treats | ||||
| Pet Veterinary Diets | By Sub Product | Derma Diets | ||
| Diabetes | ||||
| Digestive Sensitivity | ||||
| Obesity Diets | ||||
| Oral Care Diets | ||||
| Renal | ||||
| Urinary tract disease | ||||
| Other Veterinary Diets |
| Convenience Stores |
| Online Channel |
| Specialty Stores |
| Supermarkets/Hypermarkets |
| Other Channels |
| Africa | By Country | South Africa |
| Rest of Africa | ||
| Asia-Pacific | By Country | Australia |
| China | ||
| India | ||
| Indonesia | ||
| Japan | ||
| Malaysia | ||
| Philippines | ||
| Taiwan | ||
| Thailand | ||
| Vietnam | ||
| Rest of Asia-Pacific | ||
| Europe | By Country | France |
| Germany | ||
| Italy | ||
| Netherlands | ||
| Poland | ||
| Russia | ||
| Spain | ||
| United Kingdom | ||
| Rest of Europe | ||
| North America | By Country | Canada |
| Mexico | ||
| United States | ||
| Rest of North America | ||
| South America | By Country | Argentina |
| Brazil | ||
| Rest of South America |
| By Pet Food Product | Food | By Sub Product | Dry Pet Food | By Sub Dry Pet Food | Kibbles |
| Other Dry Pet Food | |||||
| Wet Pet Food | |||||
| Pet Nutraceuticals/Supplements | By Sub Product | Milk Bioactives | |||
| Omega-3 Fatty Acids | |||||
| Probiotics | |||||
| Proteins and Peptides | |||||
| Vitamins and Minerals | |||||
| Other Nutraceuticals | |||||
| Pet Treats | By Sub Product | Crunchy Treats | |||
| Dental Treats | |||||
| Freeze-dried and Jerky Treats | |||||
| Soft and Chewy Treats | |||||
| Other Treats | |||||
| Pet Veterinary Diets | By Sub Product | Derma Diets | |||
| Diabetes | |||||
| Digestive Sensitivity | |||||
| Obesity Diets | |||||
| Oral Care Diets | |||||
| Renal | |||||
| Urinary tract disease | |||||
| Other Veterinary Diets | |||||
| By Distribution Channel | Convenience Stores | ||||
| Online Channel | |||||
| Specialty Stores | |||||
| Supermarkets/Hypermarkets | |||||
| Other Channels | |||||
| By Geography | Africa | By Country | South Africa | ||
| Rest of Africa | |||||
| Asia-Pacific | By Country | Australia | |||
| China | |||||
| India | |||||
| Indonesia | |||||
| Japan | |||||
| Malaysia | |||||
| Philippines | |||||
| Taiwan | |||||
| Thailand | |||||
| Vietnam | |||||
| Rest of Asia-Pacific | |||||
| Europe | By Country | France | |||
| Germany | |||||
| Italy | |||||
| Netherlands | |||||
| Poland | |||||
| Russia | |||||
| Spain | |||||
| United Kingdom | |||||
| Rest of Europe | |||||
| North America | By Country | Canada | |||
| Mexico | |||||
| United States | |||||
| Rest of North America | |||||
| South America | By Country | Argentina | |||
| Brazil | |||||
| Rest of South America | |||||


Market Definition
- FUNCTIONS - Pet foods are usually intended to provide complete and balanced nutrition to the pet but are primarily used as functional products. The scope includes the food and supplements consumed by pets including veterinary diets. Supplements/nutraceuticals that are directly supplied to pets are considered within the scope.
- RESELLERS - Companies engaged in reselling of pet food without value addition have been excluded from the market scope, in order to avoid double counting.
- END CONSUMERS - Pet owners are considered to be the end-consumers in the market studied.
- DISTRIBUTION CHANNELS - Supermarkets/hypermarkets, specialty stores, convenience stores, online channels and other channels are considered within the scope. The stores which are exclusively providing pet related basic and custom products are considered within the scope of specialty stores.
| Keyword | Definition |
|---|---|
| Pet Food | The scope of pet food includes the food that is eatable by pets including food, treats, veterinary diets, and nutraceuticals/supplements. |
| Food | Food is animal feed intended for consumption by pets. It is formulated to provide essential nutrients and meet the dietary needs of various types of pets, including dogs, cats, and other animals. These are generally segmented into dry and wet pet foods. |
| Dry Pet Food | Dry pet foods may be extruded/baked (kibbles) or flaked. They have a lower moisture content, typically around 12-20%. |
| Wet Pet Food | Wet pet food, also known as canned pet food or moist pet food, generally has a higher moisture content compared to dry pet food, often ranging from 70-80%. |
| Kibbles | Kibbles are dry, processed pet food in small, bite-sized pieces or pellets. They are specifically formulated to provide balanced nutrition for various domestic animals, such as dogs, cats, and other animals. |
| Treats | Pet Treats are special food items or rewards given to pets, to show affection, and encourage good behavior. They are especially used during training. Pet treats are made from various combinations of meat or meat-derived materials with other ingredients. |
| Dental Treats | Pet dental treats are specialized treats that are formulated to promote good oral hygiene in pets. |
| Crunchy Treats | It is a type of pet treat that has a firm and crispy texture which can be a good source of nutrition for pets. |
| Soft and chewy treats | Soft and Chewy pet treats are a type of pet food product that is formulated to be easy to chewy and digest. They are usually made from soft and pliable ingredients, such as meat, poultry, or vegetables, that have been blended and formed into bite-sized pieces or strips. |
| Freeze-dried & Jerky Treats | Freeze-dried and jerky treats are snacks given to pets, that are prepared through a special preservation process, without damaging the nutritional content, resulting in long-lasting, nutrient-rich treats. |
| Urinary Tract Disease Diets | These are commercial diets that are specifically formulated to promote urinary health and reduce the risk of urinary tract infections and other urinary problems. |
| Renal Diets | These are specialized pet foods formulated to support the health of pets with kidney disease or renal insufficiency. |
| Digestive Sensitivity Diets | Digestive-sensitive diets are specially formulated to meet the nutritional needs of pets with digestive issues such as food intolerances, allergies, and sensitivities. These diets are designed to be easily digestible and to reduce the symptoms of digestive problems in pets. |
| Oral Care Diets | Oral care diets for pets are specially formulated diets produced to promote oral health and hygiene in pets. |
| Grain-Free Pet Food | Pet food that does not contain common grains like wheat, corn, or soy. Grain-free diets are often preferred by pet owners seeking alternative options or if their pets have specific dietary sensitivities. |
| Premium Pet Food | High-quality pet food formulated with superior ingredients often offers additional nutritional benefits compared to standard pet food. |
| Natural Pet Food | Pet food made from natural ingredients, with minimal processing and without artificial preservatives. |
| Organic Pet Food | Pet food is produced using organic ingredients, free from synthetic pesticides, hormones, and genetically modified organisms (GMOs). |
| Extrusion | A manufacturing process used to produce dry pet food, where ingredients are cooked, mixed, and shaped under high pressure and temperature. |
| Other Pets | Other pets include birds, fish, rabbits, hamsters, ferrets, and reptiles. |
| Palatability | The taste, texture, and aroma of pet food influence its appeal and acceptance by pets. |
| Complete and Balanced Pet Food | Pet food that provides all essential nutrients in appropriate proportions to meet the nutritional needs of pets without additional supplementation. |
| Preservatives | These are the substances that are added to pet food to extend its shelf life and prevent spoilage. |
| Nutraceuticals | Food products that offer health benefits beyond basic nutrition, often contain bioactive compounds with potential therapeutic effects. |
| Probiotics | Live beneficial bacteria that promote a healthy balance of gut flora, supporting digestive health and immune function in pets. |
| Antioxidants | Compounds that help neutralize harmful free radicals in the body, promoting cellular health and supporting the immune system in pets. |
| Shelf-Life | The duration of which pet food remains safe and nutritionally viable for consumption after its production date. |
| Prescription diet | Specialized pet food formulated to address specific medical conditions under veterinary supervision. |
| Allergen | A substance that can cause allergic reactions in some pets, leading to food allergies or sensitivities. |
| Canned food | Wet pet food that is packed in cans and contains higher moisture content than dry food. |
| Limited ingredient diet (LID) | Pet food formulated with a reduced number of ingredients to minimize potential allergens. |
| Guaranteed Analysis | The minimum or maximum levels of certain nutrients present in pet food. |
| Weight management | Pet food designed to help pets maintain a healthy weight or support weight loss efforts. |
| Other Nutraceuticals | It includes prebiotics, antioxidants, digestive fiber, enzymes, essential oils and herbs. |
| Other Veterinary Diets | It includes weight management diets, skin and coat health, cardiac care, and joint care. |
| Other Treats | It includes rawhides, mineral blocks, lickables, and catnips. |
| Other Dry Foods | It includes cereal flakes, mixers, meal toppers, freeze-dried foods, and air-dried foods. |
| Other Animals | It includes birds, fish, reptiles, and small animals (rabbits, ferrets, hamsters). |
| Other Distribution Channels | It includes veterinary clinics, local unregulated stores, and feed and farm stores. |
| Proteins and Peptides | Proteins are large molecules composed of basic units called amino acids which help in the growth and development of pets. Peptides are the short string of 2 to 50 amino acids. |
| Omega-3 fatty acids | Omega-3 fatty acids are essential polyunsaturated fats that play a crucial role in the overall health and well-being of Pets |
| Vitamins | Vitamins are the essential organic compounds that are essential for vital physiological functioning. |
| Minerals | Minerals are naturally occurring inorganic substances that are essential for various physiological functions in pets. |
| CKD | Chronic Kidney Disease |
| DHA | Docosahexaenoic Acid |
| EPA | Eicosapentaenoic Acid |
| ALA | Alpha-linolenic Acid |
| BHA | Butylated Hydroxyanisol |
| BHT | Butylated Hydroxytoluene |
| FLUTD | Feline Lower Urinary Tract Disease |


Research Methodology
Mordor Intelligence follows a four-step methodology in all our reports.
- Step-1: IDENTIFY KEY VARIABLES: In order to build a robust forecasting methodology, the variables and factors identified in Step-1 are tested against available historical market numbers. Through an iterative process, the variables required for market forecast are set and the model is built on the basis of these variables.
- Step-2: Build a Market Model: Market-size estimations for the forecast years are in nominal terms. Inflation is not a part of the pricing, and the average selling price (ASP) is kept constant throughout the forecast period.
- Step-3: Validate and Finalize: In this important step, all market numbers, variables and analyst calls are validated through an extensive network of primary research experts from the market studied. The respondents are selected across levels and functions to generate a holistic picture of the market studied.
- Step-4: Research Outputs: Syndicated Reports, Custom Consulting Assignments, Databases & Subscription Platforms


