Market Overview
| Study Period | 2018 - 2031 |
|---|---|
| Forecast Data Period | 2026 - 2031 |
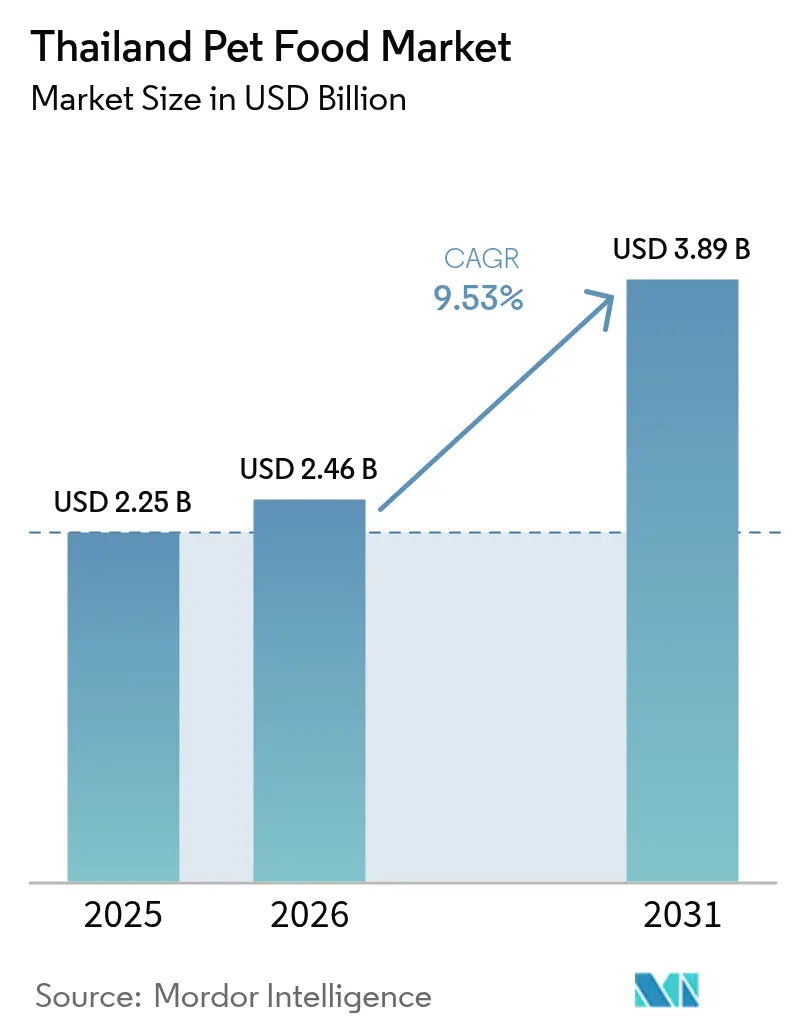
| Base Year Market Size (2025) | USD 2.25 Billion |
| Market Size (2026) | USD 2.46 Billion |
| Market Size (2031) | USD 3.89 Billion |
| Growth Rate (2026 - 2031) | 9.53% CAGR |
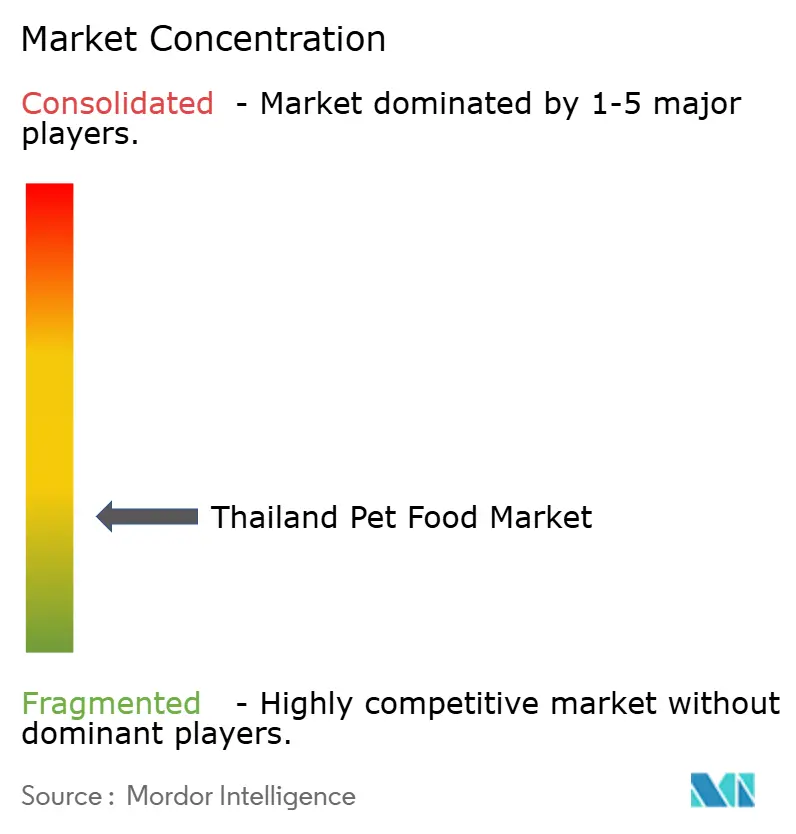
| Market Concentration | Low |
Major Players *Disclaimer: Major Players sorted in no particular order Image © Mordor Intelligence. Reuse requires attribution under CC BY 4.0. | |
Thailand Pet Food Market Analysis by Mordor Intelligence
The Thailand pet food market size in 2026 is estimated at USD 2.46 billion, growing from 2025 value of USD 2.25 billion with 2031 projections showing USD 3.89 billion, growing at 9.53% CAGR over 2026-2031. This growth is based on Thailand’s dual identity as a large domestic consumer market and the world’s second-largest pet food exporter. Robust export earnings highlight sustained overseas demand, while rising urban pet ownership and premiumization nurture local consumption. Large players exploit economies of scale derived from Thailand’s manufacturing hub status, yet smaller firms seize niche opportunities in therapeutic diets and novel proteins. Regulatory shifts, such as updated labeling rules, add compliance costs but also raise the quality bar, supporting long-term market confidence.
Key Report Takeaways
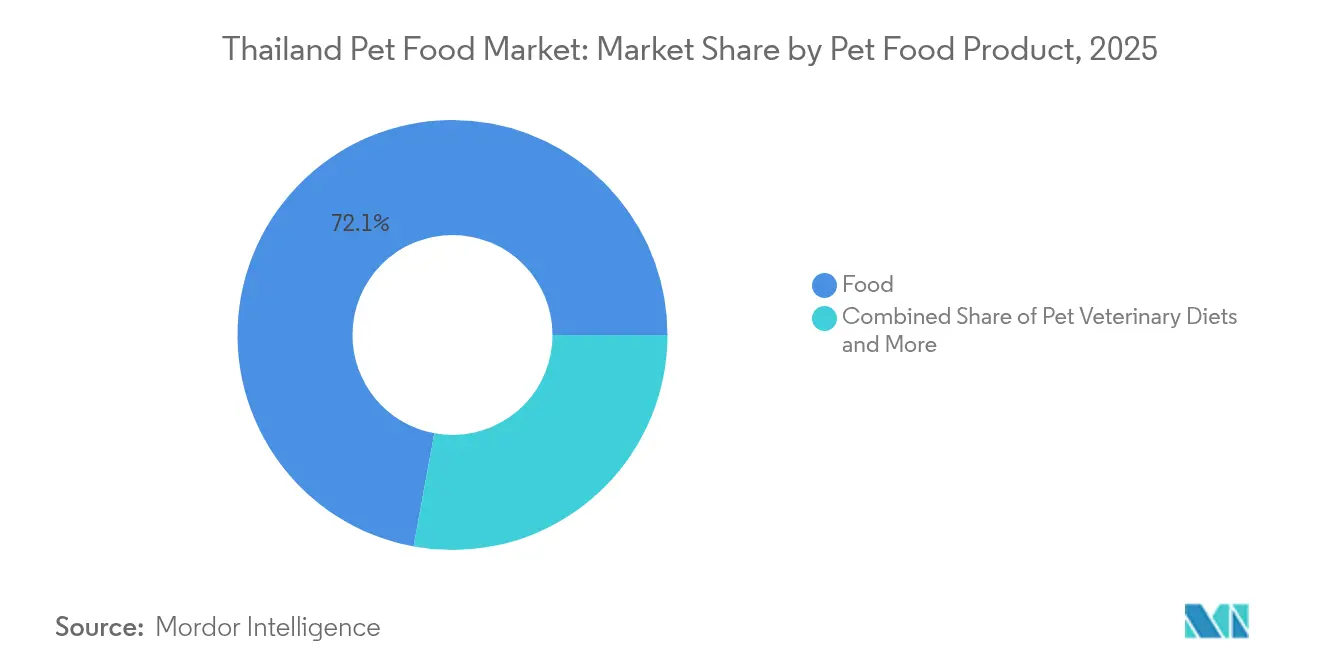
- By product category, food dominated with 72.10% revenue share in 2025; pet veterinary diets are forecast to expand at an 11.55% CAGR through 2031.
- By pet type, dogs led the Thailand pet food market share with a 64.85% share in 2025, and the dog segment is projected to grow at a 10.62% CAGR through 2031.
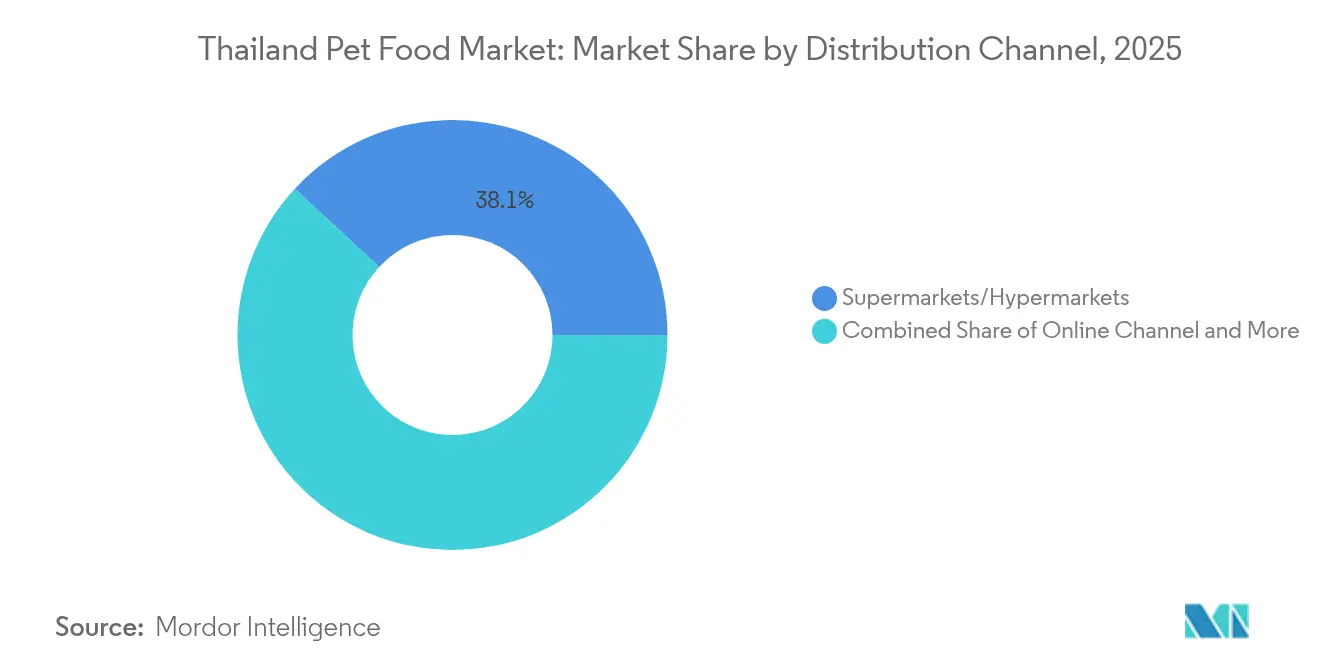
- By distribution channel, supermarkets and hypermarkets accounted for a 38.10% share of the Thailand pet food market size in 2025, and online channels are projected to advance at an 11.12% CAGR through 2031.
Note: Market size and forecast figures in this report are generated using Mordor Intelligence’s proprietary estimation framework, updated with the latest available data and insights as of 2026.
Thailand Pet Food Market Trends and Insights
Drivers Impact Analysis*
| Driver | (~) % Impact on CAGR Forecast | Geographic Relevance | Impact Timeline |
|---|---|---|---|
| Premiumization of dog and cat food formulations | +2.1% | Bangkok and major urban centers, expanding to secondary cities | Medium term (2-4 years) |
| Booming online grocery and quick-commerce platforms | +1.8% | Urban Thailand with spillover to regional markets | Medium term (2-4 years) |
| Expansion of modern trade and pet specialty chains | +1.5% | National rollout from Bangkok to provincial centers | Long term (≥ 4 years) |
| Government incentives for domestic meat and seafood co-products | +2.3% | Bangkok, Chiang Mai, Phuket with rapid expansion | Short term (≤ 2 years) |
| Human-grade functional ingredients in treats | +1.2% | National policy with focus on coastal and agricultural regions | Long term (≥ 4 years) |
| Rise in pet insurance driving demand for therapeutic diets | +0.9% | Urban centers with expanding middle class | Medium term (2-4 years) |
| Source: Mordor Intelligence | |||
Premiumization of Dog and Cat Food Formulations
Premium pet food formulations incorporating human-grade ingredients and functional additives are reshaping Thailand's domestic market as pet owners increasingly view their animals as family members. Premium recipes featuring human-grade meats, probiotics, and condition-specific nutrients now command price premiums of 15-20%. Mars Petcare co-develops Thai-tailored formulas with veterinary researchers, supporting breed-specific and life-stage diets. Thai Union’s Strategy 2030 designates premium pet food as a pillar for tripling pet care revenue to 20% of the company's total corporate sales[1]Source: Bangkok Post Public Company Limited, “Mars unveils the first innovative online portal to promote pet adoption in Thailand,” BANGKOKPOST.COM. Local firms respond with region-sourced proteins, intensifying R&D investment. Consumers value transparent sourcing and functional benefits, sustaining steady trade-up momentum.
Booming Online Grocery and Quick-Commerce Platforms
E-commerce penetration in Thailand's pet food sector is driven by platforms like Lazada and Shopee, as well as emerging quick-commerce services that offer same-day delivery in major urban areas. The online channel's 11.4% CAGR significantly outpaces traditional retail, reflecting the changing consumer behaviors accelerated by digital natives entering the pet ownership market. Live commerce and influencer marketing have become crucial tools for customer acquisition, with pet influencers commanding substantial followings and influencing purchase decisions through product demonstrations and testimonials. Mars unveiled Thailand's first innovative online pet adoption portal.
Expansion of Modern Trade and Pet Specialty Chains
Modern retail formats, including hypermarkets, supermarkets, and dedicated pet specialty stores, are expanding rapidly across Thailand's secondary cities, improving product accessibility and enabling premium brand positioning through enhanced merchandising and customer education. The expansion of modern trade coincides with Thailand's urbanization trends, where rising disposable incomes in provincial centers create demand for convenient, one-stop shopping experiences that include pet care products alongside human consumption goods. Department of Livestock Development regulations require proper storage and handling protocols for pet food retail, creating barriers for informal retail channels while benefiting modern trade operators with established cold-chain and inventory management capabilities.
Government Incentives for Domestic Meat and Seafood Co-Products
Thailand's government actively promotes the utilization of meat and seafood processing by-products for animal feed and pet food manufacturing through tax incentives, research grants, and streamlined regulatory approvals for facilities that demonstrate sustainable waste reduction. The policy framework supports Thailand's goal of achieving economic value in livestock feed while reducing environmental impact from food processing waste streams. Thai Union Group's investment in alternative protein sources, including its fund's backing of Orgafeed's insect protein technology, exemplifies how companies are leveraging government support to develop sustainable ingredient sources that reduce dependence on imported raw materials [2]Source: Somhatai Mosika, “Thailand drafting standards for BSF meal production,” Asian Agribiz, ASIANAGRIBIZ.COM. Draft standards for black soldier fly meal could unlock scalable, lower-cost inputs, benefiting both manufacturers and sustainability targets.
Restraints Impact Analysis*
| Restraint | (~) % Impact on CAGR Forecast | Geographic Relevance | Impact Timeline |
|---|---|---|---|
| Volatile raw-material prices | -1.4% | Global impact with particular sensitivity in import-dependent regions | Short term (≤ 2 years) |
| Limited cold-chain infrastructure for fresh/frozen pet food | -0.8% | National regulatory framework with inconsistent enforcement | Medium term (2-4 years) |
| Low consumer awareness outside Bangkok | -1.1% | Rural and secondary urban markets | Long term (≥ 4 years) |
| Fragmented regulatory oversight on supplements | -0.7% | Provincial areas and rural regions | Medium term (2-4 years) |
| Source: Mordor Intelligence | |||
Volatile Raw-Material Prices
Raw material price volatility significantly impacts Thailand's pet food manufacturers, particularly for imported ingredients such as soybeans, corn, and specialized protein meals, which comprise 60-70% of production costs. The Thai government's 2024 adjustment of soybean meal import policies, which maintains 2% in-quota tariffs but sets high out-of-quota rates, reflects ongoing efforts to balance domestic agricultural protection with feed industry cost management[3]Source: Jackie Linden, “CPF welcomes Thai government’s move on soy imports,” Feed Strategy, FEEDSTRATEGY.COM. Currency depreciation increases input costs but supports export earnings, thereby intensifying margin management complexity, particularly for smaller brands with limited hedging capacity.
Limited Cold-Chain Infrastructure for Fresh/Frozen Pet Food
Thailand's cold-chain infrastructure remains concentrated in Bangkok and major urban centers, which constrains the distribution of fresh, frozen, and refrigerated pet food products to provincial markets. These infrastructure gaps limit product shelf life and increase logistics costs. The limitation particularly affects premium segments, including raw diets, fresh-prepared meals, and frozen treats that require consistent temperature control from manufacturing through retail sale. The Thai government's Eastern Economic Corridor development includes investments in cold-chain infrastructure, but implementation timelines extend beyond the immediate forecast period, meaning geographic market penetration for temperature-sensitive products will remain limited in the near term.
*Our forecasts treat driver/restraint impacts as directional, not additive. The impact forecasts reflect baseline growth, mix effects, and variable interactions.
Segment Analysis
By Pet Food Product: Veterinary Diets Sustain Premium Growth
The Thailand pet food market size for food products dominated the total value with 72.10% share in 2025, reflecting sustained consumer reliance on dry and wet staples. Within this group, veterinary diets are set to post an 11.55% CAGR, underpinned by rising pet insurance coverage and clinician trust. Thailand pet food market share for veterinary diets remains modest but expands rapidly as chronic conditions gain visibility in urban clinics. Manufacturers differentiate through clinical trials, probiotic inclusions, and novel marine proteins. Wet diets face shelf-life hurdles outside core urban areas, yet in Bangkok, these formulations flourish due to high palatability and moisture benefits.
Treats, supplements, and nutraceuticals attract health-conscious owners seeking preventive care. Human-grade dental and jerky snacks carry premium price points and align with bonding occasions. Government incentives for domestic co-products lower animal protein costs, widening gross margins. Companies invest in freeze-dry technology to extend shelf life without artificial preservatives. Continuous R&D on functional ingredients, such as joint-support peptides, bolsters product differentiation and sustains the Thailand pet food market.


By Pets: Dogs Remain Core Revenue Driver
Dogs contributed 64.85% of the 2025 value and will grow at a 10.62% CAGR through 2031, reflecting larger servings and intimate owner bonds. Thailand pet food market size for dogs benefits from increasing adoption of medium and small companion breeds in condominiums, supporting demand for breed-specific and life-stage SKUs. Thailand pet food market share for cats advances steadily as apartment living and low-maintenance appeal support feline ownership. Rural households maintain working breeds that require high-energy kibble, expanding the mid-priced nutrition tier.
Urban consumers prioritize premium and therapeutic dog diets, driving up the average spend per pet. Palatable wet pouches and functional anti-hairball formulas bolster cat segment growth. Other pets, although niche, adopt specialized nutrition products, including fortified bird feed and vitamin-enriched fish flakes. Market players see opportunity in cross-selling supplements across species as owners humanize their pets’ diets.
By Distribution Channel: Digital Acceleration Changes Retail Mix
Supermarkets and hypermarkets held 38.10% of 2025 value, anchored by broad coverage and price competitiveness. Yet online channels will post an 11.12% CAGR, powered by doorstep delivery and data-driven promotions. Thailand pet food market size for e-commerce benefits from rural buyers seeking wider assortment and urban millennials valuing convenience. Thailand pet food market share for specialty stores grows in the premium tier by offering professional advice and live grooming events.
Brick-and-mortar chains revamp layouts to feature experiential zones where owners sample treats and consult veterinarians. Meanwhile, convenience stores capture impulse purchase occasions such as single-serve wet pouches. Platforms bundle subscription services with health tips, reinforcing loyalty and smoothing demand volatility. Retail hybrid models, including click-and-collect, cater to consumers who research online but prefer in-store pickup.
Geography Analysis
Bangkok anchors domestic demand due to high disposable incomes and dense veterinary networks. The capital’s advanced cold-chain and modern trade infrastructure enables premium wet diets and chilled treats. Secondary cities such as Chiang Mai, Phuket, and Pattaya exhibit double-digit growth, buoyed by tourism, expatriate influence, and rapid urbanization. Provincial markets remain price-sensitive, favoring bulk dry kibble distributed through traditional shops.
Export orientation intensifies regional dynamics. Facilities in Pak Chong and Lopburi allocate production based on overseas orders, occasionally constraining local inventory during peak export cycles. The United States absorbed a significant amount of Thai pet food in 2024, followed by Japan, Australia, Italy, and Malaysia. Currency shifts create cyclical advantages for exporters but increase the domestic costs of imported inputs.
Infrastructure investment under the Eastern Economic Corridor program promises improved logistics in the Chonburi and Rayong zones, potentially expanding the reach of chilled products by 2028. Yet the enforcement strength of the Department of Livestock Development rules varies regionally, prompting companies to deploy dedicated compliance teams. Rural pet owners continue traditional feeding practices, but rising agricultural incomes and generational change hint at a gradual shift toward commercial diets.
Competitive Landscape
Market concentration is low. Mars commands a good share through scale and trusted global brands, producing 65 packaging formats in its Pak Chong plant. Charoen Pokphand Group’s Perfect Companion leverages integrated feed-to-retail capabilities to hold a 19-22% stake. Thai Union leverages its marine protein expertise to target the pet care market, aiming to achieve 20% of its revenue by 2030 through the Project Tailwind program. Betagro is investing to expand its Lopburi capacity, sharpening domestic competition.
Strategic focus centers on premiumization, alternative proteins, and omnichannel penetration. Mars integrates social responsibility with e-commerce via the pet adoption portal, while Thai Union funds insect protein start-ups to hedge raw-material volatility. Local mid-tier players emphasize private labels for hypermarkets, carving price-value niches. Technology adoption spans automated extrusion to blockchain-backed supply chain tracking, mitigating reputational risks associated with forced labor flagged by U.S. authorities.
Future rivalry is anticipated to intensify around therapeutic diets, sustainable packaging, and fresh-prepared meals. Early movers who secure cold-chain distribution and clinical validation stand to capture loyal followings. At the same time, smaller firms may consolidate if raw material volatility persists and regulatory costs continue to rise.
Thailand Pet Food Industry Leaders
Colgate-Palmolive Company (Hill's Pet Nutrition Inc.)
Mars Incorporated
Nestle (Purina)
EBOS Group Limited
Thai Union Group PCL
- *Disclaimer: Major Players sorted in no particular order

Recent Industry Developments
- November 2024: Thai Union Group launched Strategy 2030, targeting USD 7 billion revenue by 2030 (from USD 3.9 billion in 2024), with pet care positioned as 20% of total revenue through the Project Tailwind transformation program. The strategy emphasizes both organic growth and M&A activities to triple i-Tail Corporation's revenue to USD 1.5 billion, with USD 50 million annualized operating profit uplift anticipated from 2027.
- July 2023: Hill's Pet Nutrition introduced its new MSC (Marine Stewardship Council) certified pollock and insect protein products for pets with sensitive stomachs and skin lines. They contain vitamins, omega-3 fatty acids, and antioxidants.
- May 2023: Nestle Purina launched new cat treats under the Friskies "Friskies Playfuls - treats" brand. These treats are round in shape and are available in chicken and liver and salmon and shrimp flavors for adult cats.


Thailand Pet Food Market Report Scope
Food, Pet Nutraceuticals/Supplements, Pet Treats, Pet Veterinary Diets are covered as segments by Pet Food Product. Cats, Dogs are covered as segments by Pets. Convenience Stores, Online Channel, Specialty Stores, Supermarkets/Hypermarkets are covered as segments by Distribution Channel.Pet Food Product
| Food | By Sub Product | Dry Pet Food | By Sub Dry Pet Food | Kibbles |
| Other Dry Pet Food | ||||
| Wet Pet Food | ||||
| Pet Nutraceuticals/Supplements | By Sub Product | Milk Bioactives | ||
| Omega-3 Fatty Acids | ||||
| Probiotics | ||||
| Proteins and Peptides | ||||
| Vitamins and Minerals | ||||
| Other Nutraceuticals | ||||
| Pet Treats | By Sub Product | Crunchy Treats | ||
| Dental Treats | ||||
| Freeze-dried and Jerky Treats | ||||
| Soft and Chewy Treats | ||||
| Other Treats | ||||
| Pet Veterinary Diets | By Sub Product | Derma Diets | ||
| Diabetes | ||||
| Digestive Sensitivity | ||||
| Obesity Diets | ||||
| Oral Care Diets | ||||
| Renal | ||||
| Urinary tract disease | ||||
| Other Veterinary Diets |
Pets
| Cats |
| Dogs |
| Other Pets |
Distribution Channel
| Convenience Stores |
| Online Channel |
| Specialty Stores |
| Supermarkets/Hypermarkets |
| Other Channels |
| Pet Food Product | Food | By Sub Product | Dry Pet Food | By Sub Dry Pet Food | Kibbles |
| Other Dry Pet Food | |||||
| Wet Pet Food | |||||
| Pet Nutraceuticals/Supplements | By Sub Product | Milk Bioactives | |||
| Omega-3 Fatty Acids | |||||
| Probiotics | |||||
| Proteins and Peptides | |||||
| Vitamins and Minerals | |||||
| Other Nutraceuticals | |||||
| Pet Treats | By Sub Product | Crunchy Treats | |||
| Dental Treats | |||||
| Freeze-dried and Jerky Treats | |||||
| Soft and Chewy Treats | |||||
| Other Treats | |||||
| Pet Veterinary Diets | By Sub Product | Derma Diets | |||
| Diabetes | |||||
| Digestive Sensitivity | |||||
| Obesity Diets | |||||
| Oral Care Diets | |||||
| Renal | |||||
| Urinary tract disease | |||||
| Other Veterinary Diets | |||||
| Pets | Cats | ||||
| Dogs | |||||
| Other Pets | |||||
| Distribution Channel | Convenience Stores | ||||
| Online Channel | |||||
| Specialty Stores | |||||
| Supermarkets/Hypermarkets | |||||
| Other Channels | |||||


Market Definition
- FUNCTIONS - Pet foods are usually intended to provide complete and balanced nutrition to the pet but are primarily used as functional products. The scope includes the food and supplements consumed by pets including veterinary diets. Supplements/nutraceuticals that are directly supplied to pets are considered within the scope.
- RESELLERS - Companies engaged in reselling of pet food without value addition have been excluded from the market scope, in order to avoid double counting.
- END CONSUMERS - Pet owners are considered to be the end-consumers in the market studied.
- DISTRIBUTION CHANNELS - Supermarkets/hypermarkets, specialty stores, convenience stores, online channels and other channels are considered within the scope. The stores which are exclusively providing pet related basic and custom products are considered within the scope of specialty stores.
| Keyword | Definition |
|---|---|
| Pet Food | The scope of pet food includes the food that is eatable by pets including food, treats, veterinary diets, and nutraceuticals/supplements. |
| Food | Food is animal feed intended for consumption by pets. It is formulated to provide essential nutrients and meet the dietary needs of various types of pets, including dogs, cats, and other animals. These are generally segmented into dry and wet pet foods. |
| Dry Pet Food | Dry pet foods may be extruded/baked (kibbles) or flaked. They have a lower moisture content, typically around 12-20%. |
| Wet Pet Food | Wet pet food, also known as canned pet food or moist pet food, generally has a higher moisture content compared to dry pet food, often ranging from 70-80%. |
| Kibbles | Kibbles are dry, processed pet food in small, bite-sized pieces or pellets. They are specifically formulated to provide balanced nutrition for various domestic animals, such as dogs, cats, and other animals. |
| Treats | Pet Treats are special food items or rewards given to pets, to show affection, and encourage good behavior. They are especially used during training. Pet treats are made from various combinations of meat or meat-derived materials with other ingredients. |
| Dental Treats | Pet dental treats are specialized treats that are formulated to promote good oral hygiene in pets. |
| Crunchy Treats | It is a type of pet treat that has a firm and crispy texture which can be a good source of nutrition for pets. |
| Soft and chewy treats | Soft and Chewy pet treats are a type of pet food product that is formulated to be easy to chewy and digest. They are usually made from soft and pliable ingredients, such as meat, poultry, or vegetables, that have been blended and formed into bite-sized pieces or strips. |
| Freeze-dried & Jerky Treats | Freeze-dried and jerky treats are snacks given to pets, that are prepared through a special preservation process, without damaging the nutritional content, resulting in long-lasting, nutrient-rich treats. |
| Urinary Tract Disease Diets | These are commercial diets that are specifically formulated to promote urinary health and reduce the risk of urinary tract infections and other urinary problems. |
| Renal Diets | These are specialized pet foods formulated to support the health of pets with kidney disease or renal insufficiency. |
| Digestive Sensitivity Diets | Digestive-sensitive diets are specially formulated to meet the nutritional needs of pets with digestive issues such as food intolerances, allergies, and sensitivities. These diets are designed to be easily digestible and to reduce the symptoms of digestive problems in pets. |
| Oral Care Diets | Oral care diets for pets are specially formulated diets produced to promote oral health and hygiene in pets. |
| Grain-Free Pet Food | Pet food that does not contain common grains like wheat, corn, or soy. Grain-free diets are often preferred by pet owners seeking alternative options or if their pets have specific dietary sensitivities. |
| Premium Pet Food | High-quality pet food formulated with superior ingredients often offers additional nutritional benefits compared to standard pet food. |
| Natural Pet Food | Pet food made from natural ingredients, with minimal processing and without artificial preservatives. |
| Organic Pet Food | Pet food is produced using organic ingredients, free from synthetic pesticides, hormones, and genetically modified organisms (GMOs). |
| Extrusion | A manufacturing process used to produce dry pet food, where ingredients are cooked, mixed, and shaped under high pressure and temperature. |
| Other Pets | Other pets include birds, fish, rabbits, hamsters, ferrets, and reptiles. |
| Palatability | The taste, texture, and aroma of pet food influence its appeal and acceptance by pets. |
| Complete and Balanced Pet Food | Pet food that provides all essential nutrients in appropriate proportions to meet the nutritional needs of pets without additional supplementation. |
| Preservatives | These are the substances that are added to pet food to extend its shelf life and prevent spoilage. |
| Nutraceuticals | Food products that offer health benefits beyond basic nutrition, often contain bioactive compounds with potential therapeutic effects. |
| Probiotics | Live beneficial bacteria that promote a healthy balance of gut flora, supporting digestive health and immune function in pets. |
| Antioxidants | Compounds that help neutralize harmful free radicals in the body, promoting cellular health and supporting the immune system in pets. |
| Shelf-Life | The duration of which pet food remains safe and nutritionally viable for consumption after its production date. |
| Prescription diet | Specialized pet food formulated to address specific medical conditions under veterinary supervision. |
| Allergen | A substance that can cause allergic reactions in some pets, leading to food allergies or sensitivities. |
| Canned food | Wet pet food that is packed in cans and contains higher moisture content than dry food. |
| Limited ingredient diet (LID) | Pet food formulated with a reduced number of ingredients to minimize potential allergens. |
| Guaranteed Analysis | The minimum or maximum levels of certain nutrients present in pet food. |
| Weight management | Pet food designed to help pets maintain a healthy weight or support weight loss efforts. |
| Other Nutraceuticals | It includes prebiotics, antioxidants, digestive fiber, enzymes, essential oils and herbs. |
| Other Veterinary Diets | It includes weight management diets, skin and coat health, cardiac care, and joint care. |
| Other Treats | It includes rawhides, mineral blocks, lickables, and catnips. |
| Other Dry Foods | It includes cereal flakes, mixers, meal toppers, freeze-dried foods, and air-dried foods. |
| Other Animals | It includes birds, fish, reptiles, and small animals (rabbits, ferrets, hamsters). |
| Other Distribution Channels | It includes veterinary clinics, local unregulated stores, and feed and farm stores. |
| Proteins and Peptides | Proteins are large molecules composed of basic units called amino acids which help in the growth and development of pets. Peptides are the short string of 2 to 50 amino acids. |
| Omega-3 fatty acids | Omega-3 fatty acids are essential polyunsaturated fats that play a crucial role in the overall health and well-being of Pets |
| Vitamins | Vitamins are the essential organic compounds that are essential for vital physiological functioning. |
| Minerals | Minerals are naturally occurring inorganic substances that are essential for various physiological functions in pets. |
| CKD | Chronic Kidney Disease |
| DHA | Docosahexaenoic Acid |
| EPA | Eicosapentaenoic Acid |
| ALA | Alpha-linolenic Acid |
| BHA | Butylated Hydroxyanisol |
| BHT | Butylated Hydroxytoluene |
| FLUTD | Feline Lower Urinary Tract Disease |


Research Methodology
Mordor Intelligence follows a four-step methodology in all our reports.
- Step-1: IDENTIFY KEY VARIABLES: In order to build a robust forecasting methodology, the variables and factors identified in Step-1 are tested against available historical market numbers. Through an iterative process, the variables required for market forecast are set and the model is built on the basis of these variables.
- Step-2: Build a Market Model: Market-size estimations for the forecast years are in nominal terms. Inflation is not a part of the pricing, and the average selling price (ASP) is kept constant throughout the forecast period.
- Step-3: Validate and Finalize: In this important step, all market numbers, variables and analyst calls are validated through an extensive network of primary research experts from the market studied. The respondents are selected across levels and functions to generate a holistic picture of the market studied.
- Step-4: Research Outputs: Syndicated Reports, Custom Consulting Assignments, Databases & Subscription Platforms


