Market Overview
| Study Period | 2020 - 2031 |
|---|---|
| Forecast Data Period | 2026 - 2031 |
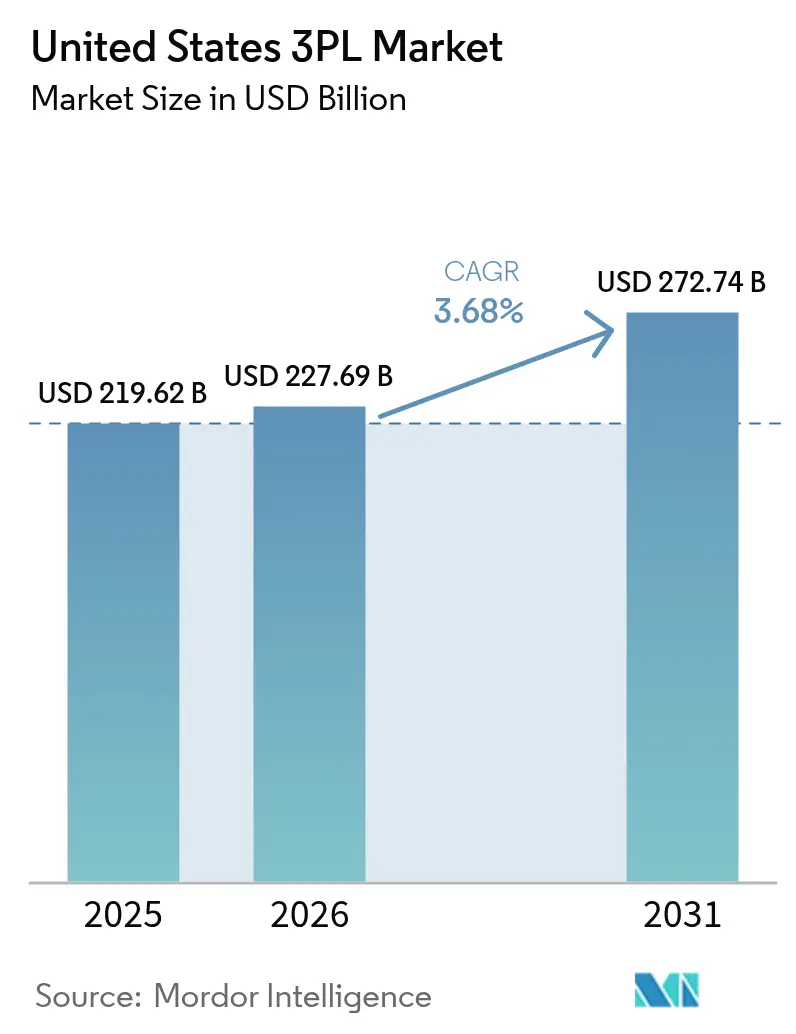
| Base Year Market Size (2025) | USD 219.62 Billion |
| Market Size (2026) | USD 227.69 Billion |
| Market Size (2031) | USD 272.74 Billion |
| Growth Rate (2026 - 2031) | 3.68% CAGR |
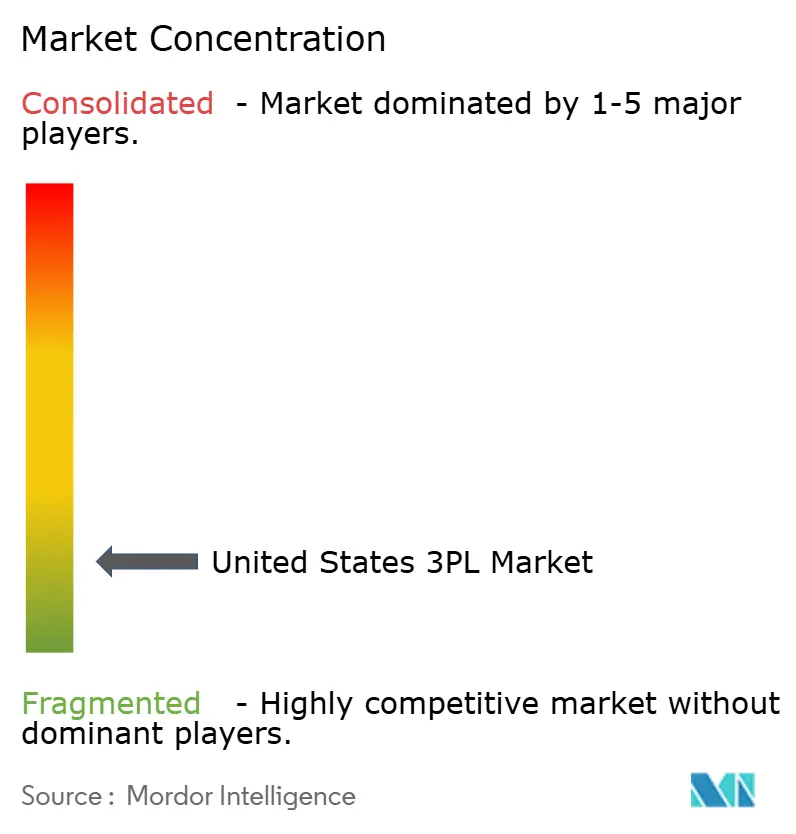
| Market Concentration | Low |
Major Players *Disclaimer: Major Players sorted in no particular order Image © Mordor Intelligence. Reuse requires attribution under CC BY 4.0. | |
United States 3PL Market Analysis by Mordor Intelligence
The United States 3PL Market size is expected to increase from USD 219.62 billion in 2025 to USD 227.69 billion in 2026 and reach USD 272.74 billion by 2031, growing at a CAGR of 3.68% over 2026-2031.
The growth path reflects a maturing cycle after pandemic-era surges as shippers rebalance service portfolios toward providers that join digital brokerage with owned capacity for service assurance during rate volatility. Competition is shifting toward providers that can blend automation with multi-client fulfillment capabilities and cold chain coverage that supports stringent life sciences requirements. Pricing discipline is stabilizing in core lanes as dedicated capacity gains weight in contract negotiations, yet providers with advanced warehouse software and predictive fleet uptime maintain an edge in bid cycles. Nearshoring activity linked to Mexico and Gulf Coast intermodal nodes is also shaping routing design for cross-border flows, which raises demand for integrated drayage, rail interchange, and bonded warehousing solutions.
Key Report Takeaways
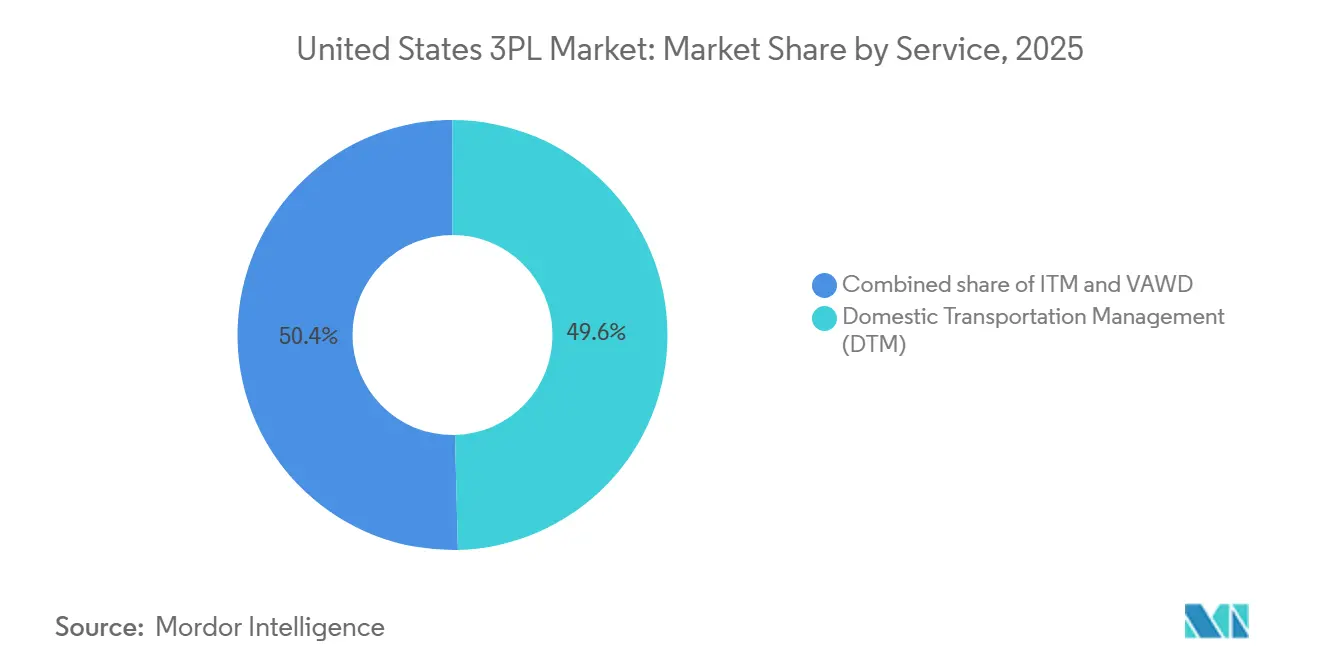
- By service type, Domestic Transportation Management led with 49.55% of the United States 3PL market share in 2025. Value-Added Warehousing and Distribution is forecast to expand at a 5.34% CAGR through 2026-2031.
- By end user, Manufacturing accounted for a 35.45% share of the United States 3PL market size in 2025. Life Sciences and Healthcare are forecast to expand at a 4.56% CAGR through 2026-2031.
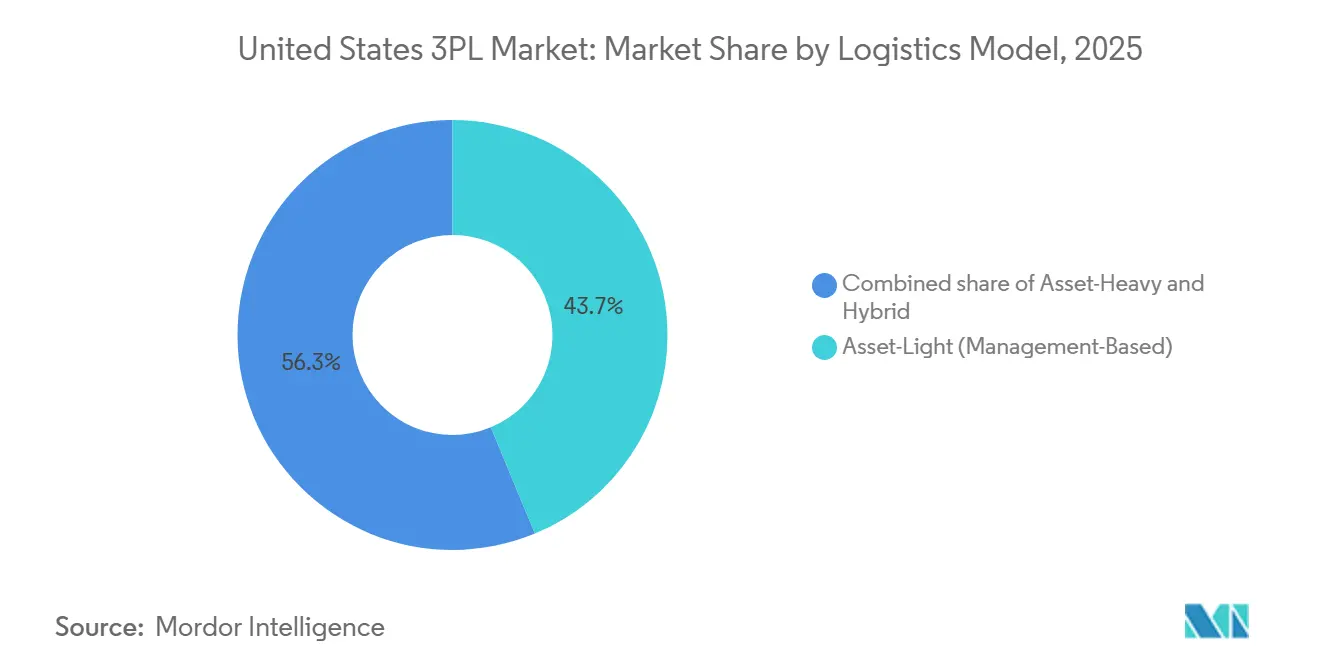
- By logistics model, asset-light operators held 43.7% market share in 2025. Hybrid models are projected to record the highest growth at a 5.12% CAGR to 2031 for the United States 3PL market size.
- By geography, the South captured a 34.23% share of the United States 3PL market size in 2025. The West is projected to expand at a 3.95% CAGR through 2031.
Note: Market size and forecast figures in this report are generated using Mordor Intelligence’s proprietary estimation framework, updated with the latest available data and insights as of 2026.
United States 3PL Market Trends and Insights
Drivers Impact Analysis*
| Driver | (~) % Impact on CAGR Forecast | Geographic Relevance | Impact Timeline |
|---|---|---|---|
| AI-Powered Predictive Logistics and Autonomous Systems | +0.7% | National, with early gains in Phoenix, San Francisco, Los Angeles, Austin, Atlanta | Medium term (2-4 years) |
| Growth of Cold Chain Logistics for Pharma & Perishables | +0.8% | Global, concentrated in Midwest manufacturing corridors, Northeast pharma hubs, South Gulf ports | Long term (≥ 4 years) |
| Adoption of Robotics and Autonomous Mobile Robots | +0.6% | United States e-commerce fulfillment centers and logistics hubs, with spill-over into domestic manufacturing sectors | Medium term (2-4 years) |
| Expansion of Multi-Client Mega Fulfillment Centers | +0.5% | South (Texas, Georgia, Tennessee), West (Inland Empire, Phoenix) | Medium term (2-4 years) |
| Integration of Blockchain for Supply Chain Transparency | +0.3% | National, pilot deployments in high-value supply chains (aerospace, pharma) | Long term (≥ 4 years) |
| Public-Private Investment In Inland Ports And Intermodal Hubs | +0.8% | South (Port of Charleston, Savannah, Houston, Corpus Christi), West (Long Beach, LA), Midwest (Chicago) | Long term (≥ 4 years) |
| Source: Mordor Intelligence | |||
AI-Powered Predictive Logistics and Autonomous Systems
U.S. 3PLs are scaling AI to compress quote-to-cash cycles, reduce manual exceptions, and improve service reliability during volatile freight seasons. AI deployment in transportation planning, dynamic pricing, and ETA accuracy enhances on-time performance for tight delivery windows. Shippers favor providers offering auditable AI-enabled visibility and exception handling within service level agreements, especially for complex moves. Federal focus on digital and multimodal freight planning drives investment in data sharing and interoperability standards, aiding private-sector optimization in routing and capacity alignment.[1]U.S. Department of Transportation, “Guidance on Multimodal State Freight Plans and State Freight Advisory Committees,” Federal Register, federalregister.gov The market benefits from AI integration with warehouse systems and TMS platforms, unifying order orchestration across fulfillment and linehaul operations. Over the medium term, adoption is expected to expand to mid-market specialists as plug-in AI modules become easier to implement.
Growth of Cold Chain Logistics for Pharma & Perishables
Cold chain expansion drives growth as life sciences, biologics, and premium perishables demand validated temperature control, redundancy, and traceability. The United States 3PL market gains revenue from automated cold storage, rail-connected hubs, and multi-client facilities designed for rapid throughput and compliance. Providers are adding greenfield automation and integrating networks to serve anchor customers in food and pharma. Network design shifts to inland rail-linked nodes, reducing time-to-market and offering intermodal options. Sustainability influences procurement as shippers prioritize energy-efficient refrigeration, renewable power, and chain-of-custody reporting. Providers offering GMP-grade environments with value-added services like kitting and relabeling secure longer contracts and premium pricing.[2]DHL Supply Chain, “DHL Supply Chain Expands Life Sciences & Healthcare Capabilities With New Center of Excellence,” DHL Press Room, dhl.com
Adoption of Robotics and Autonomous Mobile Robots
Automation in high-velocity fulfillment is rising as labor tightens and sub-24-hour service levels expand. The United States 3PL market is adopting robotics and automation to stabilize throughput and manage seasonality without increasing permanent headcount. Centralized platforms improve inventory accuracy, dock scheduling, and replenishment. Providers with integrated automation and analytics are preferred for industries requiring documented accuracy and traceability. Scale providers lead deployments, while regional specialists focus on modular solutions with quicker payback periods.
Expansion of Multi-Client Mega Fulfillment Centers
Multi-client fulfillment hubs are scaling to support omnichannel retail and cross-border flows where variability is the norm. The United States 3PL market is consolidating into larger nodes with high clear heights, dense racking, and large door counts that improve turns and dock productivity. Nearshoring activity is a key driver in border markets where trade growth supports expansions with bonded capacity, security features, and customs process optimization. Providers are adding multi-customer space to spread fixed costs, speed onboarding, and expand value-added services that retain customers when volumes shift. Acquisitions continue to add geographically diverse warehouse footprints designed to serve small and midsize shippers that want nationwide coverage without dedicated sites. Over the medium term, the United States 3PL market will favor operators that can combine hyperlocal nodes with regional hubs to balance speed, cost, and inventory risk.
Restraints Impact Analysis*
| Restraint | (~) % Impact on CAGR Forecast | Geographic Relevance | Impact Timeline |
|---|---|---|---|
| Transportation Capacity Constraints During Peak Seasons | -0.5% | National, acute in Northeast corridors (I-95, I-78), Midwest hubs (Chicago, Cincinnati), West Coast (I-5, I-10) | Short term (≤ 2 years) |
| Infrastructure Challenges On Congested Freight Corridors | -0.4% | National, top-100 bottlenecks concentrated in Atlanta, Houston, Chicago, LA basin | Medium term (2-4 years) |
| Rising Fuel And Energy Expenses Affecting Margin Structures | -0.6% | National | Short term (≤ 2 years) |
| Labor Shortages In Skilled Logistics And Warehouse Roles | -0.7% | National, most severe in tight labor markets (Phoenix, Dallas, Atlanta, Indianapolis) | Medium term (2-4 years) |
| Source: Mordor Intelligence | |||
Transportation Capacity Constraints During Peak Seasons
Seasonal surges continue to compress available linehaul and last-mile capacity across national networks. The United States 3PL market experiences recurring peaks tied to back-to-school, holiday promotions, and global holidays that alter outbound schedules, which strains carrier availability. Shippers face extended lead times, higher spot exposure, and warehouse overflow risks when fulfillment backlogs collide with constrained transport. Providers with hybrid models can mitigate exposure by blending dedicated capacity with agile brokerage, which balances service continuity and cost. Top freight bottlenecks also amplify delays during peak volumes, particularly at major interchange points tracked annually by industry research. Proactive planning around known peak periods and modal diversification remains essential for reliable flows in the United States 3PL market.
Rising Fuel and Energy Expenses Affecting Margin Structures
Fuel costs remain a volatile input that directly affects margin structures for carriers and 3PLs. The United States 3PL market reflects frequent adjustments through fuel surcharge tables indexed to weekly benchmarks, which shift risk to shippers during price spikes. Analytics and optimization can lower consumption and stabilize costs when paired with better route planning and mode choices. Intermodal and rail options are receiving renewed attention as companies seek more energy-efficient pathways for medium and long-haul freight. Strategic procurement and contract design are evolving to balance cost transparency with service guarantees in longer bid cycles. Advisory content from logistics technology providers underscores planning discipline and data-driven fuel management as key to protecting margins in the United States 3PL market.
*Our forecasts treat driver/restraint impacts as directional, not additive. The impact forecasts reflect baseline growth, mix effects, and variable interactions.
Segment Analysis
By Service Type: Fulfillment Velocity Shifts Favor High-Touch Warehousing
Domestic Transportation Management accounted for the largest 2025 share, while Value-Added Warehousing and Distribution is projected to post the highest growth rate through 2031. The United States 3PL market relies on DTM for flexibility as shippers adjust networks for nearshoring and e-commerce. Road dominates last-mile control, while rail supports dense, non-urgent corridors. Air handles time-critical, high-value shipments, and ocean serves bulk cargo where cost per ton-mile is key. VAWD growth is driven by hyperlocal inventory positioning, favoring cross-dock and kitting services. Multi-client facilities enhance offerings with returns processing and refurbishment, aiding omnichannel retailers.
Value-Added Warehousing and Distribution is expanding as retailers and healthcare companies demand compliant, high-speed fulfillment. The United States 3PL market benefits from reverse logistics and serialized inventory management. Combined workflows for pick, pack, and customization support speed without dedicated contracts. Advanced WMS and labor tools stabilize service levels during surges. Integrations between warehouse and transportation systems improve handoffs and visibility. Providers investing in automation and analytics within multi-client sites will capture more premium fulfillment opportunities.


By End User: Manufacturing Scale Meets Healthcare Margin Expansion
Manufacturing led the 2025 share as providers managed inbound materials, line-side replenishment, outbound distribution, and warranty returns. The United States 3PL market supports manufacturers by balancing plant flows with fluctuating dealer and retail demand. Automotive and industrial segments are optimizing inventory strategies while maintaining high on-time standards. Technology and electronics shipments rely on white-glove delivery, serial tracking, and secure handling. The market consolidates specialized capabilities to streamline handoffs between suppliers, assembly plants, and aftermarket networks, reducing exceptions critical for parts availability and regulatory checks.
Life Sciences and Healthcare are expected to grow faster through 2031, driven by temperature control, GMP-grade environments, and chain-of-custody integrity. The United States 3PL market is expanding in premium healthcare lanes for biologics and device distribution, where error tolerance is minimal. E-commerce and omnichannel retail drive growth as split-ship and store-fulfillment require robust orchestration. Consumer goods and FMCG contracts emphasize cross-dock agility and surge handling, prioritizing responsiveness over static storage. Food and beverage flows intersect with cold chain demands, favoring providers with compliant systems and trained teams. Across sectors, performance metrics now focus on responsiveness, traceability, and proactive exception handling.
By Logistics Model: Hybrid Configurations Outpace Asset Purity
Asset-light operators captured a notable 2025 share, reflecting the growing role of digital brokerage for flexible coverage. The United States 3PL market increasingly favors hybrid models that combine dedicated assets with dynamic brokerage to handle peaks. Asset-heavy operators excel in verticals requiring compliance, chain-of-custody, and guaranteed capacity. Hybrid models suit shippers needing stability for core lanes and agility for promotions and seasonality. Contract structures now pair committed volume with flex bands and clear accessorial terms, aligning with evolving market demands.
Hybrid models are expected to grow fastest as shippers prioritize resilience against rate and capacity volatility. The United States 3PL industry focuses on visibility, real-time performance tracking, and rapid exception recovery across asset types. Providers integrate planning, procurement, and execution into unified platforms for consistent KPIs across modes. In regulated verticals, asset-backed credentials reduce risk, while brokerage adds reach. The United States 3PL market benefits from bid designs rewarding metrics like on-time delivery and fulfillment speed. Operators demonstrating consistent performance across asset classes are poised to gain market share.
Geography Analysis
The South held the largest 2025 regional share, driven by Gulf Coast gateways and cross-border trade routes linking manufacturing clusters and consumption zones. The United States 3PL market benefits from Class I rail connections, balancing drayage and intermodal flows. Texas logistics corridors are expanding with new cross-border capacity and scalable warehouse space for multi-client operations. Providers are leveraging Mexico's nearshoring gains while managing customs slowdowns. Cold chain and e-commerce fulfillment reinforce the South's market size, reaching large population centers within two-day windows. Coastal gateways paired with inland hubs stabilize lead times and throughput.
The West is projected to grow the fastest through 2031, supported by port modernization, inland hubs, and technology sector logistics. The United States 3PL market is mobilizing capacity around the Inland Empire and Phoenix corridors to relieve coastal congestion while maintaining Pacific trade lane access. Investments address special handling for sensitive electronics and cloud infrastructure requiring secure transport. Cross-border solutions and inland rail connectivity improve flow from coastal entry to interior distribution. Regulatory requirements drive demand for experienced providers navigating emissions rules and facility standards. Modernization projects will further optimize routing for time and cost advantages.
The Midwest remains a critical interchange region connecting western imports with eastern consumption through dense rail and highway nodes. The United States 3PL market uses intermodal strategies to bypass coastal congestion and reduce costs for sensitive freight. Cold chain networks are adding capacity and automation to serve consumer goods and healthcare distribution within short service windows. Selected inland hubs achieve broad two-day coverage while balancing transportation spend and emissions. Expanded bonded capacity in border markets supports cross-border manufacturing flows and time-definite deliveries into interior U.S. nodes.
Competitive Landscape
Scale incumbents and specialized regional operators are leveraging technology as a key differentiator. The United States 3PL market prioritizes AI-enabled planning, warehouse automation, and connected visibility across modes. National providers focus on compressing cycle times and raising fill rates, while specialists excel in niches like cold chain, last mile, and cross-border drayage. Corporate investments in automation and analytics are reshaping networks and execution. Coverage breadth, system maturity, and continuous improvement are critical selection criteria in the United States 3PL market.
Strategic expansions are adding multi-client capacity for small and midsize shippers. Providers are increasing warehouse space to support omnichannel growth, scalable returns, and cross-border flows. Life sciences investments are enhancing GMP-ready environments and temperature-controlled zones for premium services.[3]DHL Group, “DHL Group 2025 Business Profile,” DHL Group, group.dhl.com The United States 3PL market is also focusing on integrated intermodal strategies combining drayage, rail, and inland warehousing for cost stability.
M&A activity and portfolio adjustments remain active as providers refine their focus. Cold storage networks are expanding through acquisitions and greenfield projects to meet food and pharma demand. Investor reports highlight operational priorities, cost management, and alignment with trends like nearshoring and automation. In the United States 3PL market, operators aligning capacity, compliance, and customer-centric orchestration are consolidating share. Execution quality and system investments distinguish consistent contract winners from less integrated rivals.
United States 3PL Industry Leaders
C.H. Robinson Worldwide Inc.
XPO Logistics
United Parcel Service, Inc.
DHL Group
DSV
- *Disclaimer: Major Players sorted in no particular order

Recent Industry Developments
- February 2026: Expeditors International reported fourth-quarter 2025 diluted EPS of USD 1.49, down 11% year-over-year, with airfreight tonnage up 6% and ocean container volume down 6%, announcing a new USD 3 billion share repurchase program effective upon expiration of the current program, reflecting confidence in long-term cash generation despite soft ocean rates expected to persist in 2026.
- January 2026: DHL Supply Chain announced a new one-million-square-foot Life Sciences & Healthcare Center of Excellence in Annville, Pennsylvania, scheduled to open in 2026, operating as a Foreign Trade Zone with FDA and GMP-compliant infrastructure, advanced temperature-controlled environments, and pre-certification capabilities to address demand for tariff mitigation and expedited customs processing.
- November 2025: Kuehne+Nagel expanded its facility in El Paso, Texas, adding a 20,252-square-meter bonded warehouse with 53 dock doors and 65 trailer spaces, increasing overall capacity by 60% to meet growing demand for cross-border logistics between the U.S. and Mexico driven by sustained nearshoring trends.
- August 2025: Americold opened a 335,000-square-foot import-export hub in Kansas City, Missouri, in partnership with Canadian Pacific Kansas City (CPKC), marking the first Americold facility on the CPKC rail network and serving as a key hub for the Mexico Midwest Express (MMX), North America's only single-line rail service for refrigerated goods between the U.S. and Mexico.


United States 3PL Market Report Scope
The United States 3PL market is segmented by services (Domestic Transportation Management, International Transportation Management, and Value-added Warehousing and Distribution) and End User (Aerospace, Automotive, Consumer and Retail, Energy, Healthcare, Manufacturing, Technology, and Other End Users). The report offers market size and forecasts for the United States market in value (USD Billion) for all the above segments.
By Service
| Domestic Transportation Management (DTM) | Roadways |
| Railways | |
| Airways | |
| Waterways | |
| International Transportation Management (ITM) | Roadways |
| Railways | |
| Airways | |
| Waterways | |
| Value-Added Warehousing & Distribution (VAWD) |
By End User
| Automotive |
| Energy & Utilities |
| Manufacturing |
| Life Sciences & Healthcare |
| Technology & Electronics |
| E-commerce |
| Consumer Goods & FMCG |
| Food & Beverages |
| Others |
By Logistics Model
| Asset-Light (Management-Based) |
| Asset-Heavy (Own Fleet & Warehouses) |
| Hybrid |
By U.S. Region
| Northeast |
| Midwest |
| South |
| West |
| By Service | Domestic Transportation Management (DTM) | Roadways |
| Railways | ||
| Airways | ||
| Waterways | ||
| International Transportation Management (ITM) | Roadways | |
| Railways | ||
| Airways | ||
| Waterways | ||
| Value-Added Warehousing & Distribution (VAWD) | ||
| By End User | Automotive | |
| Energy & Utilities | ||
| Manufacturing | ||
| Life Sciences & Healthcare | ||
| Technology & Electronics | ||
| E-commerce | ||
| Consumer Goods & FMCG | ||
| Food & Beverages | ||
| Others | ||
| By Logistics Model | Asset-Light (Management-Based) | |
| Asset-Heavy (Own Fleet & Warehouses) | ||
| Hybrid | ||
| By U.S. Region | Northeast | |
| Midwest | ||
| South | ||
| West | ||


Key Questions Answered in the Report
What is the current size and growth outlook of the United States 3PL market?
The United States 3PL market size was USD 219.62 billion in 2025, is projected at USD 227.69 billion in 2026, and is forecast to reach USD 272.74 billion by 2031 at a 3.68% CAGR.
Which service type is growing fastest within the United States 3PL market?
Value-Added Warehousing and Distribution is the fastest-growing service type, projected at a 5.34% CAGR through 2031 as shippers prioritize high-touch fulfillment, returns, and compliant cold chain handling.
Which end-user vertical shows the strongest growth momentum?
Life Sciences and Healthcare shows the strongest momentum, with a 4.56% CAGR through 2031 supported by validated temperature control, GMP-grade environments, and chain-of-custody requirements that command premium pricing.
Which region leads and which grows fastest in the United States 3PL market?
The South led by share at 34.23% in 2025, while the West is the fastest-growing region with a projected 3.95% CAGR through 2031, supported by port modernization and inland hub expansion.
What logistics model is seeing the highest growth among U.S. providers?
Hybrid configurations that combine dedicated assets with digital brokerage for surge capacity are growing fastest at a 5.12% CAGR through 2031, reflecting shipper preferences for resilience and agility.
Which capabilities most influence contract awards in the United States 3PL market today?
AI-enabled planning, warehouse automation, cold chain compliance, and integrated intermodal design are decisive, with providers that unify visibility and exception handling across modes often outperforming in competitive bids.
Page last updated on:


