Market Overview
| Study Period | 2020 - 2031 |
|---|---|
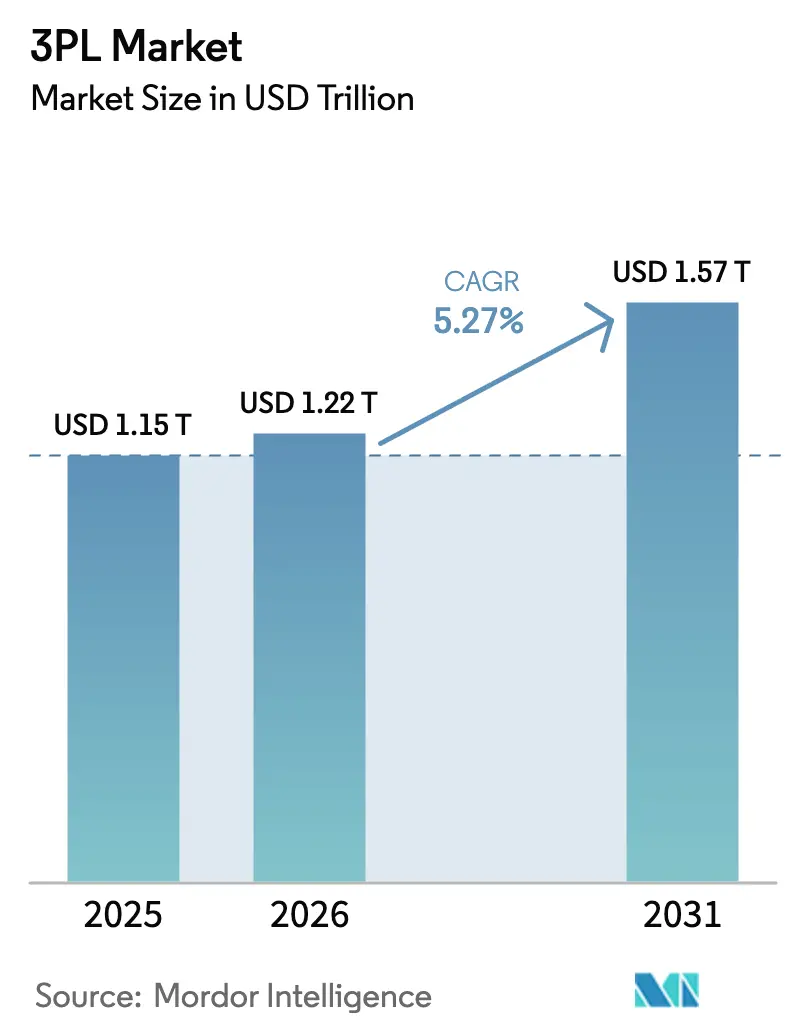
| Market Size (2026) | USD 1.22 Trillion |
| Market Size (2031) | USD 1.57 Trillion |
| Growth Rate (2026 - 2031) | 5.27% CAGR |
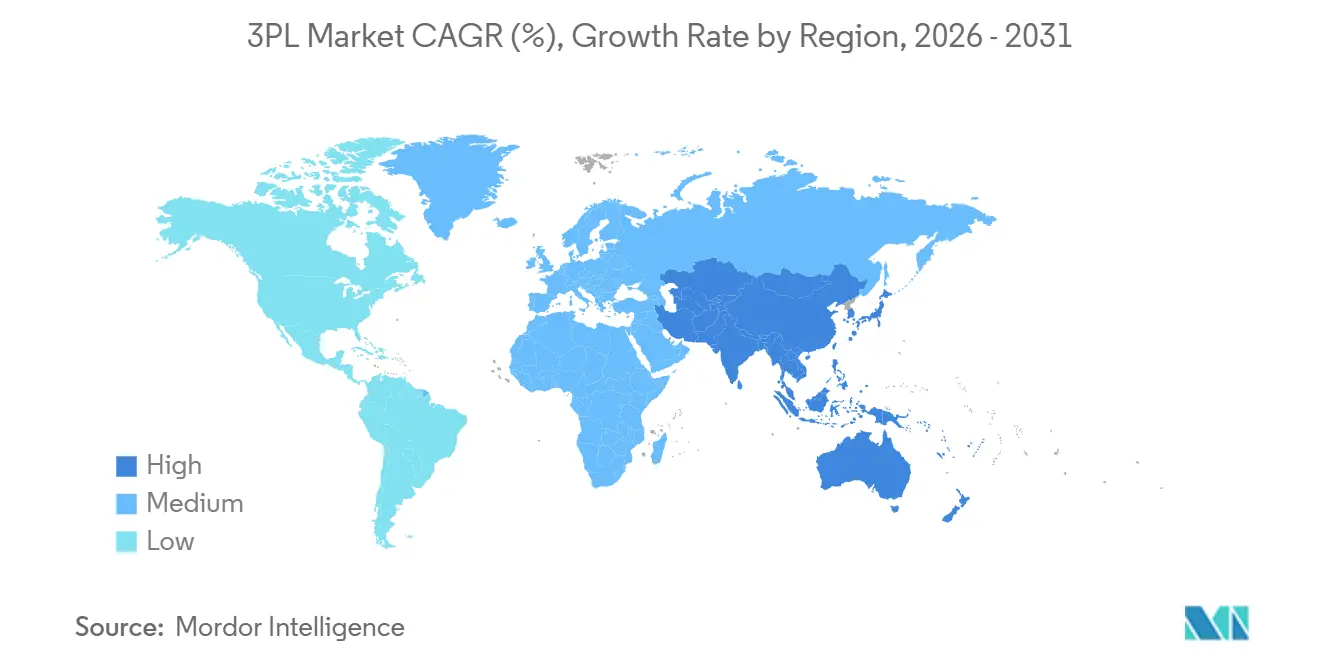
| Fastest Growing Market | Asia Pacific |
| Largest Market | Asia Pacific |
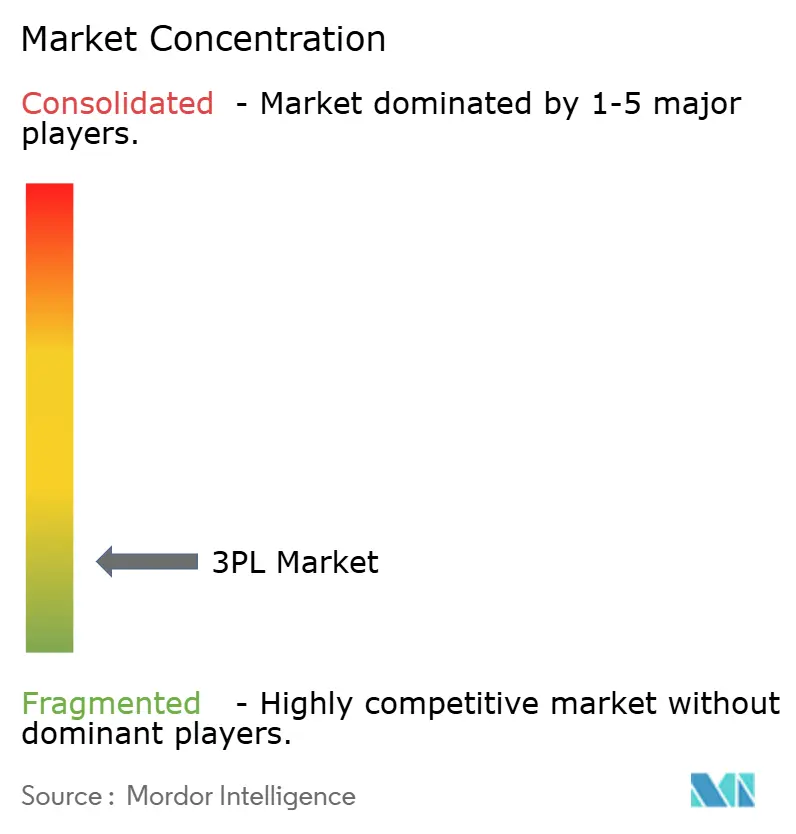
| Market Concentration | Low |
Major Players *Disclaimer: Major Players sorted in no particular order Image © Mordor Intelligence. Reuse requires attribution under CC BY 4.0. | |
Third-Party Logistics (3PL) Market Analysis by Mordor Intelligence
The Third-Party Logistics (3PL) Market size is estimated at USD 1.22 trillion in 2026, and is expected to reach USD 1.57 trillion by 2031, at a CAGR of 5.27% during the forecast period (2026-2031).
Shippers are favoring variable-cost logistics partnerships that free capital for digital transformation and customer-experience investments. Asia-Pacific anchors volume growth on the back of manufacturing diversification and e-commerce intensity, while North America and Europe rely on nearshoring, automation, and data-driven control towers to offset wage inflation. Digital freight platforms, AI-enabled visibility suites, and hybrid logistics models are blurring the line between asset-light orchestration and selective asset ownership. At the same time, the Third-Party Logistics (3PL) Market faces exposure to fuel-price swings, warehouse-labor scarcity, and cybersecurity threats that demand both strategic hedging and technology hardening.
Key Report Takeaways
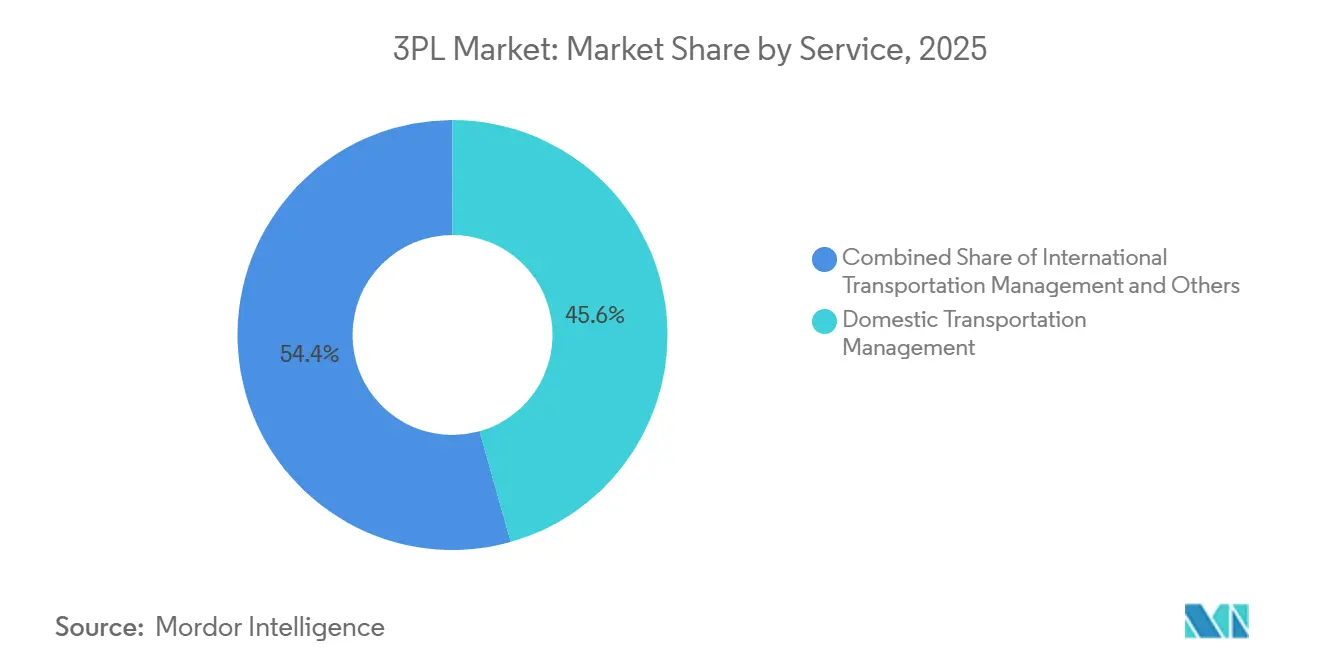
- By service type, domestic transportation management captured 45.64% of the Third-Party Logistics (3PL) Market share in 2025 and is expanding at a 5.91% CAGR to 2031.
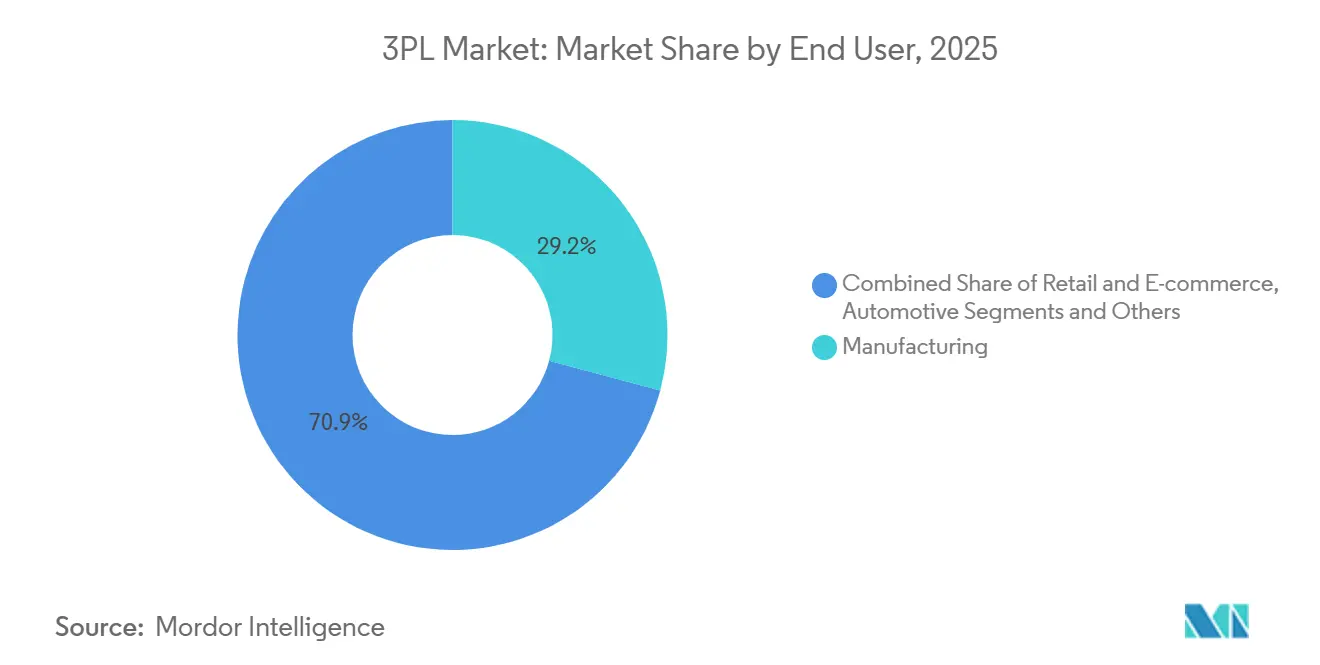
- By end user, manufacturing captured 29.15% of the Third-Party Logistics (3PL) Market size in 2025; life sciences and healthcare grow fastest at a 7.62% CAGR to 2031.
- By logistics model, Asset-light providers commanded 55.13% of global sales in 2025, yet the hybrid logistics model is pacing the field with a 6.54% CAGR through 2031.
- By region, Asia-Pacific contributed 41.02% to global revenue in 2025 and is forecast to post a 6.36% CAGR, the fastest among all regions in the Third-Party Logistics (3PL) Market .
Note: Market size and forecast figures in this report are generated using Mordor Intelligence’s proprietary estimation framework, updated with the latest available data and insights as of January 2026.
Global Third-Party Logistics (3PL) Market Trends and Insights
Drivers Impact Analysis*
| Driver | (~) % Impact on CAGR Forecast | Geographic Relevance | Impact Timeline |
|---|---|---|---|
| Explosive e-commerce & omni-channel fulfillment | +1.3% | Global, urban centers | Short term (≤ 2 years) |
| Globalization & cross-border trade rebound | +0.9% | Global, APAC, North America | Medium term (2-4 years) |
| Outsourcing for cost-efficiency & asset-light focus | +0.8% | Global, OECD economies | Medium term (2-4 years) |
| AI-enabled control-tower logistics adoption | +0.7% | North America, Europe, advanced APAC | Medium term (2-4 years) |
| Near-/friend-shoring redefining trade corridors | +0.6% | North America, Southeast Asia, Eastern Europe | Long term (≥ 4 years) |
| ESG-driven “green logistics” premium services | +0.5% | EU core, spillover to North America and APAC | Long term (≥ 4 years) |
| Source: Mordor Intelligence | |||
Outsourcing for Cost-Efficiency & Asset-Light Focus
Enterprises deepened outsourcing to convert fixed logistics costs into variable terms and redirect cash toward innovation. Asset-light models already make up 55.13% of the Third-Party Logistics (3PL) Market , a reflection of board-level mandates for balance-sheet agility. Variable capacity cushions demand shocks, and specialized skills ranging from hazardous materials handling to ultra-cold chain arrive wrapped in a single invoice rather than multiyear capex. Lead-logistics and 4PL frameworks consolidate vendor rosters, granting shippers unified performance dashboards and streamlined governance while providers unlock scale by orchestrating partner networks.
AI-Enabled Control-Tower Logistics Adoption
Machine-learning engines embedded in control-tower platforms now predict disruptions, suggest cost-to-serve-optimized routes, and initiate automated recovery steps. FedEx’s 2024 purchase of ShipMatrix injected predictive analytics that sharpened ETA accuracy and reduced manual exception labor[1]FedEx, “FedEx Acquires ShipMatrix,” fedex.com. Similar moves across the Third-Party Logistics (3PL) Market are recasting technology from back-office tool to strategic moat as on-time-in-full metrics become table stakes. Integration of telematics, IoT sensors, and carrier APIs feeds data lakes that continually refine algorithms, driving measurable savings in fuel, detention, and inventory days of supply.
Near-/Friend-Shoring Redefining Trade Corridors
Manufacturing relocation toward Mexico, Southeast Asia, and Eastern Europe is rewriting freight flows. US imports from Mexico hit USD 510 billion in 2025, cementing the corridor’s strategic primacy. The shift fuels warehouse construction in border states and spawns demand for drayage, cross-dock, and customs-clearance expertise that nimble Third-Party Logistics (3PL) Market players monetize. In Asia, Vietnam and Indonesia lure electronics and apparel producers, drawing investment in cold chain, bonded facilities, and value-added kitting to delay final assembly until closer to consumption nodes.
ESG-Driven “Green Logistics” Premium Services
Regulators and investors are tightening carbon disclosure rules, propelling shippers to seek lower-emission transport. The EU’s Carbon Border Adjustment Mechanism goes live in 2026, penalizing carbon-intensive imports and amplifying appetite for green Third-Party Logistics (3PL) Market offerings. DHL’s pledge to deploy EUR 7 billion (USD 8.15 billion) into electric fleets and sustainable aviation fuel shows how large providers monetize sustainability leadership[2]DHL Group, “Sustainable Aviation Fuel Investment,” group.dhl.com . Carbon dashboards that translate shipment legs into Scope 3 metrics are emerging as procurement prerequisites, turning environmental performance into a tender-winning criterion alongside price and transit time.
Restraints Impact Analysis*
| Restraint | (~) % Impact on CAGR Forecast | Geographic Relevance | Impact Timeline |
|---|---|---|---|
| Volatile fuel & freight-rate environment | −0.7% | Global, ocean & air freight | Short term (≤ 2 years) |
| High capex for warehouse automation & tech | −0.6% | OECD economies, advanced APAC | Medium term (2-4 years) |
| Warehouse-labor scarcity & wage inflation | −0.5% | OECD economies, urban centers | Medium term (2-4 years) |
| Cybersecurity exposure from multi-tenant platforms | −0.4% | Global, cloud-based operations | Long term (≥ 4 years) |
| Source: Mordor Intelligence | |||
Warehouse-Labor Scarcity & Wage Inflation
The United States logged a 400,000-worker shortfall in transportation and warehousing roles during 2025[3]U.S. Bureau of Labor Statistics, “Job Openings and Labor Turnover Survey,” bls.gov. Pay climbed 8-12% annually, squeezing margins already thinned by fuel surcharges. Turnover exceeding 50% burns recruitment budgets and imperils service accuracy, especially for temperature-controlled and hazardous-materials niches requiring certified staff. While automation offers relief, capital hurdles slow adoption, leaving many Third-Party Logistics (3PL) Market players caught between rising payrolls and customer rate resistance.
Cybersecurity Exposure from Multi-Tenant Platforms
Logistics cloud stacks have become high-value targets, with ransomware locks halting shipment visibility and customs filings across thousands of consignments. The EU’s NIS2 Directive widens mandatory breach-reporting and fines, hiking compliance costs. Multi-tenant architectures amplify blast radius, making governance, encryption, and zero-trust postures critical buying criteria. Providers unable to certify robust defenses risk attrition as risk-averse shippers gravitate toward cyber-hardened alternatives in the Third-Party Logistics (3PL) Market .
*Our forecasts treat driver/restraint impacts as directional, not additive. The impact forecasts reflect baseline growth, mix effects, and variable interactions.
Segment Analysis
By Service Type: Domestic Transportation Captures Scale and Momentum
Domestic transportation management held a 45.64% share of the Third-Party Logistics (3PL) Market size in 2025 and is forecast to log a 5.91% CAGR to 2031. Parcel outflows tied to same-day and next-day promises continue to swell, compelling providers to densify last-mile networks and deploy AI route engines that compress delivery costs. Road freight accounts for nearly 70% of domestic revenue thanks to door-to-door flexibility, while intermodal solutions gain favor on long hauls where rail economics beat pure truckload. Demand for white-glove and oversized-item handling is adding complexity that rewards operators with specialized equipment and trained crews.
Beyond 2026, same-day expectations will likely reach suburban and secondary-city consumers, further swelling parcel density. As regional fulfillment replaces national hubs, Third-Party Logistics (3PL) Market participants invest in smaller cross-docks integrated with predictive inventory positioning. Driver shortages and ELD-related utilization dips are nudging providers toward autonomous-truck pilots and electric delivery vans that tackle urban emission regulations. Technology-first entrants wield API-native TMS platforms that court DTC brands, forcing incumbents to refresh visibility offerings or risk share erosion.


By End-Use Industry: Manufacturing Anchors While Healthcare Accelerates
Manufacturing retained 29.15% of the Third-Party Logistics (3PL) Market share in 2025 as complex inbound material flows, just-in-sequence delivery, and near-shoring projects raise orchestration intensity. Automotive OEMs adopt vendor-managed inventory hubs near assembly lines, while electronics producers demand bonded facilities that defer duty until final configuration. Providers with engineering change-order mastery and plant-line sequencing know-how defend sticky contracts that often span multiyear model cycles.
Life sciences & healthcare, however, is the sprint leader with a 7.62% CAGR through 2031. Cell-and-gene therapy pipelines require cryogenic chain-of-custody, GDP-certified nodes, and real-time temperature telemetry. Third-Party Logistics (3PL) Market contenders are adding validated -80 °C freezers, redundant power systems, and chain-of-identity tracking to win biotech contracts. Beyond pharmaceuticals, medical-device OEMs outsource kitting, sterilization, and recall handling, sewing long-run revenue streams into integrated healthcare campuses that demand near-patient inventory positioning.
By Logistics Model: Asset-Light Dominates, Hybrid Gains Traction
Asset-light operators commanded 55.13% of revenue in 2025, mirroring shipper appetite for flexible contracts and digitized engagement. These providers scale through partner fleets, win business with self-service portals, and sidestep heavy depreciation. Their margin levers hinge on data science, spot-rate aggregation, and quick market entries powered by franchise or agency arrangements.
The hybrid model, logging a 6.54% CAGR, blends targeted asset ownership (chilled warehouses and dedicated fleets in high-volume corridors) with outsourced legs elsewhere. This structure secures capacity where service-level failure carries financial penalties yet preserves capital efficiency. As the Third-Party Logistics (3PL) Market shippers chase resilience, hybrids that own trailers in power-tight lanes, or operate GDP-certified hubs near pharma clusters, are gathering share. Pure asset-heavy enterprises remain relevant in bulk chemicals, project cargo, and niche geographies where specialized rigs or port concessions create high barriers and defensible margins.
Geography Analysis
Asia-Pacific generated 41.02% of global revenue in 2025 and is on track for a 6.36% CAGR through 2031. China drives scale in parcel density and omnichannel sophistication, yet manufacturing risk diversification steers fresh investment to Vietnam, Indonesia, and India. Inland provinces benefit from cold-chain rollouts that support premium food and vaccine distribution. Meanwhile, Japan and South Korea showcase robotics-dense fulfillment and premium service expectations, rewarding Third-Party Logistics (3PL) Market participants that offer automation and value-added assembly.
North America retains advanced infrastructure and high digital adoption. The United States sees cross-border volume surging as Mexico overtakes China among import partners, amplifying demand for drayage yards and near-border sequencing centers. Canada’s Pacific Gateway funnels Asian imports to Midwest consumers, while Mexico’s automotive clusters spur just-in-sequence parts flows. Labor scarcity pushes automation spend, fostering pilot deployments of autonomous trucks on repetitive lanes between Texas and California.
South America, the Middle East, and Africa trail in share yet offer asymmetric upside. Brazil’s e-commerce surge strains port and road capacity but invites investment in multimodal corridors linking Santos to interior states. The Middle East channels petro-dollar diversification into free-trade zones and air-cargo super hubs, positioning Dubai and Riyadh as cross-continental transshipment pivots. Africa’s AfCFTA aims to unify a patchwork of customs regimes, and early movers in the Third-Party Logistics (3PL) Market who establish pan-regional control towers and last-mile networks stand to capture first-mover premiums as consumer spending rises.

Competitive Landscape
The Third-Party Logistics (3PL) Market remains moderately fragmented; the ten largest operators captured under 20% of 2025 revenue. Consolidation momentum persists, exemplified by Kuehne + Nagel’s USD 1.8 billion purchase of Apex Logistics that opened aerospace and high-tech verticals. Scale seekers pursue horizontal mergers for geographic reach and vertical additions[4]Kuehne + Nagel, “Annual Report 2024,” kuehne-nagel.com , such as customs brokerage, to broaden wallet share.
Digital freight marketplaces and 4PL orchestrators pressure incumbents on pricing transparency and API connectivity. Incumbents respond by buying tech startups, building in-house data teams, or launching venture arms. Niche specialists flourish in pharmaceutical cold chain, hazardous goods, and circular-economy reverse logistics, where certification hurdles deter new entrants. Sustainability is another battleground: CEVA’s USD 300 million sustainable aviation fuel pledge and DHL’s AMR rollout showcase how ESG commitments translate into commercial award criteria.
Wage inflation and automation gaps widen capability differences. Global integrators deploy robot fleets that lift throughput 30%, while mid-tier rivals lean on customer intimacy and regional insight. Cybersecurity maturity increasingly decides tender outcomes, with ISO 27001 certifications like Kerry Logistics’ 2025 award becoming check-box prerequisites. Overall, the Third-Party Logistics (3PL) Market rewards scale, sector specialization, and digital-first customer engagement while penalizing providers slow to modernize.
Third-Party Logistics (3PL) Industry Leaders
DHL Supply Chain & Global Forwarding
Kuehne + Nagel International AG
C.H. Robinson Worldwide Inc.
DSV A/S
CEVA Logistics
- *Disclaimer: Major Players sorted in no particular order

Recent Industry Developments
- January 2026: DHL Supply Chain committed EUR 2 billion to deploy autonomous mobile robots across 500 warehouses, targeting 30% productivity gains.
- January 2026: Kuehne + Nagel finalized the USD 1.8 billion Apex Logistics acquisition, adding 50 North American facilities and aerospace expertise.
- December 2025: DSV realized EUR 1.2 billion in annual synergies from the Schenker integration through network optimization and tech consolidation.
- October 2024: GXO Logistics secured a 10-year, USD 500 million inbound-sequencing contract for EV plants in the U.S. and Mexico.


Research Methodology Framework and Report Scope
Market Definitions and Key Coverage
Our study treats the third-party logistics (3PL) market as the total gross revenue earned worldwide by specialist providers that plan, execute, and monitor freight forwarding, contract warehousing, domestic and international transportation management, and related value-added services on behalf of shippers. All service revenues are recorded at the point the 3PL bills its customer; re-billed carrier charges are included as part of that revenue pool.
Scope exclusion: Courier express packages below 70 lbs handled by dedicated parcel networks are not counted.
Segmentation Overview
- By Service
- Domestic Transportation Management (DTM)
- Roadways
- Railways
- Airways
- Waterways
- International Transportation Management (ITM)
- Roadways
- Railways
- Airways
- Waterways
- Value-Added Warehousing and Distribution (VAWD)
- Domestic Transportation Management (DTM)
- By End User
- Automotive
- Energy and Utilities
- Manufacturing
- Life Sciences and Healthcare
- Technology and Electronics
- Retail and E-commerce
- Consumer Goods and FMCG
- Food and Beverages
- Others
- By Logistics Model
- Asset-Light (Management-Based)
- Asset-Heavy (Own Fleet and Warehouses)
- Hybrid
- By Region
- North America
- United States
- Canada
- Mexico
- South America
- Brazil
- Argentina
- Chile
- Rest of South America
- Europe
- Germany
- United Kingdom
- France
- Spain
- Italy
- Netherlands
- Russia
- Rest of Europe
- Asia-Pacific
- China
- India
- Japan
- South Korea
- Singapore
- Vietnam
- Indonesia
- Australia
- Rest of Asia-Pacific
- Middle East and Africa
- United Arab Emirates
- Saudi Arabia
- South Africa
- Nigeria
- Rest of Middle East and Africa
- North America
Detailed Research Methodology and Data Validation
Primary Research
Mordor analysts interviewed senior managers from freight forwarders, contract logistics firms, e-commerce retailers, and procurement heads across North America, Europe, Asia-Pacific, the Gulf, and Latin America. Discussions validated average selling price progressions, contract mix shifts, and capacity utilization assumptions, and they helped us reconcile regional anomalies spotted during secondary screening.
Desk Research
We built the foundational view by pulling ten-year time series from non-paywalled tier-1 sources such as UNCTAD merchandise trade tables, World Bank Logistics Performance Index, International Air Transport Association air-cargo statistics, OECD road freight ton-kilometers, and customs shipment records published by the U.S. Census Bureau. Company filings, investor decks, and leading trade bodies (for example, CSCMP) sharpen trend inflections, while D&B Hoovers and Dow Jones Factiva supply audited 3PL financials and event intelligence. Many additional open datasets and regulatory notices were reviewed to cross-check definitions and units; the list above is illustrative, not exhaustive.
Market-Sizing & Forecasting
A top-down model converts historical transport spend, industrial output, and cross-border trade values into a 3PL addressable pool, which is then tested with selective bottom-up estimates from sampled operator revenues and lane-level rate × volume checks. Key variables include e-commerce parcel volume, container freight rate index, global PMI, diesel price index, regulatory outsourcing thresholds, and warehouse vacancy ratios. Multivariate regression combined with ARIMA extensions projects each driver to 2030; scenario analysis adjusts for fuel or tariff shocks. Data gaps in smaller regions are bridged by applying validated penetration ratios against their freight bill totals.
Data Validation & Update Cycle
Outputs pass successive analyst reviews where variance limits, currency conversions, and year-on-year deltas are flagged. When fresh annual reports, trade statistics, or material M&A events emerge, we reopen the model before the scheduled yearly refresh so clients always see our latest view.
Why Mordor Intelligence's 3PL Baseline Commands Reliability
Published numbers often diverge because firms choose different service buckets, apply unlike ASP escalators, or freeze exchange rates at outdated levels. We declare our scope upfront, refresh drivers yearly, and update FX at the average fiscal rate, creating a level playing field for planners.
Key gap drivers include whether courier parcels are rolled in, how aggressively e-commerce surcharges inflate ASPs, and if analyst teams adjust for double-counted carrier pass-throughs. Some publishers also extend forecasts a decade without recalibrating interim macro indicators.
Benchmark comparison
| Market Size | Anonymized source | Primary gap driver |
|---|---|---|
| USD 1.15 trn (2025) | Mordor Intelligence | - |
| USD 1.17 trn (2024) | Global Consultancy A | Excludes value-added warehousing; uses fixed 2023 FX rates |
| USD 1.14 trn (2024) | Industry Association B | Bundles small-parcel revenues; limited regional primary checks |
The comparison shows how scope trims or additions shift totals by tens of billions. By aligning variables with transparent assumptions and a documented update cadence, Mordor delivers a balanced, decision-ready baseline managers can replicate and audit.


Key Questions Answered in the Report
What is the current valuation of the global Third-Party Logistics (3PL) Market ?
The Third-Party Logistics (3PL) Market size is USD 1.22 trillion in 2026 and is set to climb to USD 1.57 trillion by 2031.
Which region contributes the most revenue to 3PL services?
Asia-Pacific leads with 41.02% of global turnover in 2025 and is also the fastest-growing region.
Which service type is expanding the quickest?
Domestic transportation management is advancing at a 5.91% CAGR, driven by last-mile and same-day delivery demand.
Why is healthcare logistics growing so fast?
Biologics, cell-and-gene therapies, and stricter temperature-control mandates are pushing life sciences & healthcare to a 7.62% CAGR.
How are 3PL firms addressing labor shortages?
Providers are investing in autonomous mobile robots, predictive scheduling tools, and retention programs to cut dependence on scarce labor.
What role does sustainability play in logistics outsourcing decisions?
ESG mandates and carbon-pricing mechanisms such as the EU’s CBAM are prompting shippers to favor 3PL partners with electric fleets and carbon-tracking dashboards.
Page last updated on:


