Market Overview
| Study Period | 2021 - 2031 |
|---|---|
| Forecast Data Period | 2026 - 2031 |
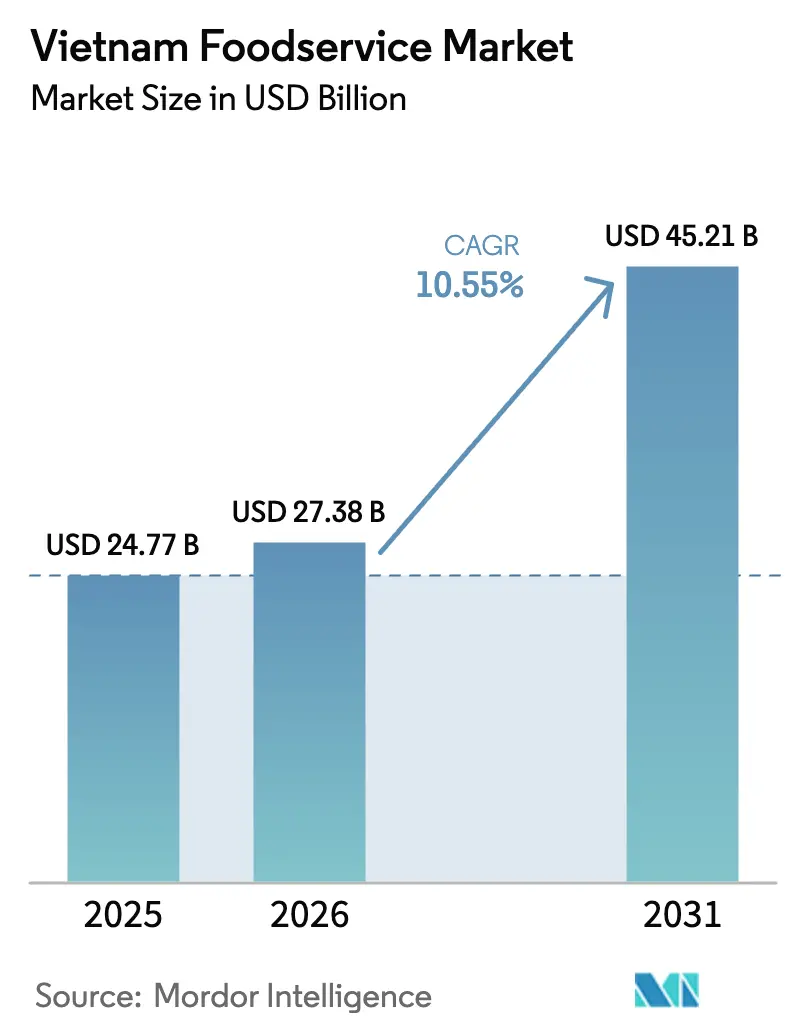
| Base Year Market Size (2025) | USD 24.77 Billion |
| Market Size (2026) | USD 27.38 Billion |
| Market Size (2031) | USD 45.21 Billion |
| Growth Rate (2026 - 2031) | 10.55% CAGR |
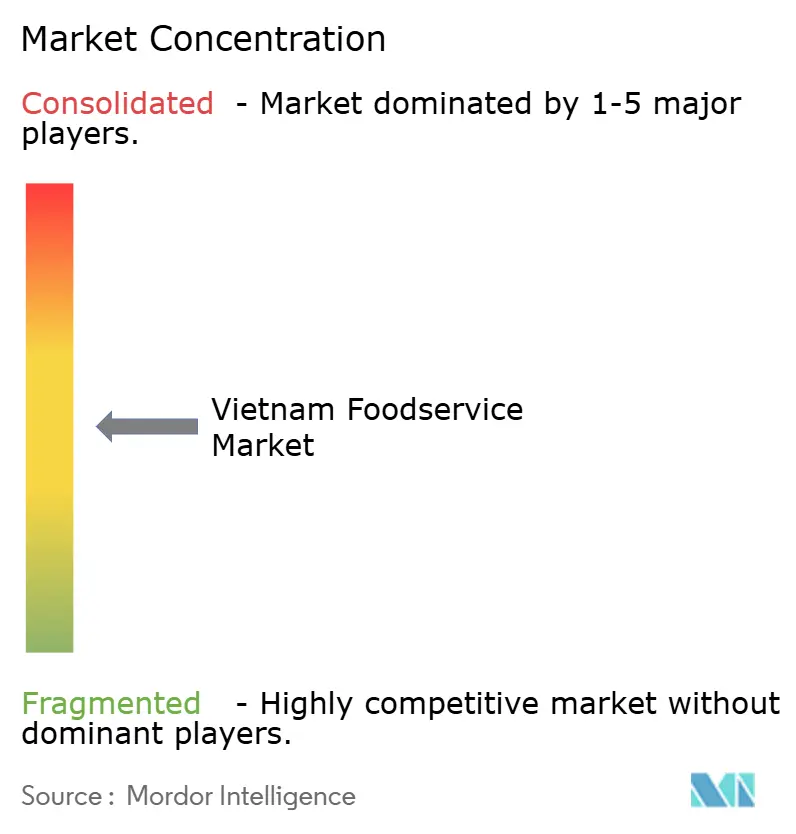
| Market Concentration | Medium |
Major Players
*Disclaimer: Major Players sorted in no particular order Image © Mordor Intelligence. Reuse requires attribution under CC BY 4.0. |
|
Vietnam Foodservice Market Analysis by Mordor Intelligence
The Vietnam foodservice market size was valued at USD 24.77 billion in 2025 and estimated to grow from USD 27.38 billion in 2026 to reach USD 45.21 billion by 2031, at a CAGR of 10.55% during the forecast period (2026-2031). The market is experiencing substantial growth as Vietnamese consumers benefit from higher disposable incomes and increased urbanization, while the resurgence in tourism activities drives renewed spending across restaurants, cafés, and food delivery platforms. The digital transformation of the industry has emerged as a significant growth driver, evidenced by cashless payments expanding 26 times faster than the national GDP, while QR code payment systems have become a standard feature across urban establishments. The government's strategic implementation of VAT reductions through Decree 180/2024 and Decree 72/2024 has provided essential financial relief to foodservice operators grappling with increased input costs. Additionally, the robust recovery in tourism, marked by 17.6 million international arrivals in 2024, has reinvigorated revenue streams for foodservice businesses operating within the hospitality sector.
Key Report Takeaways
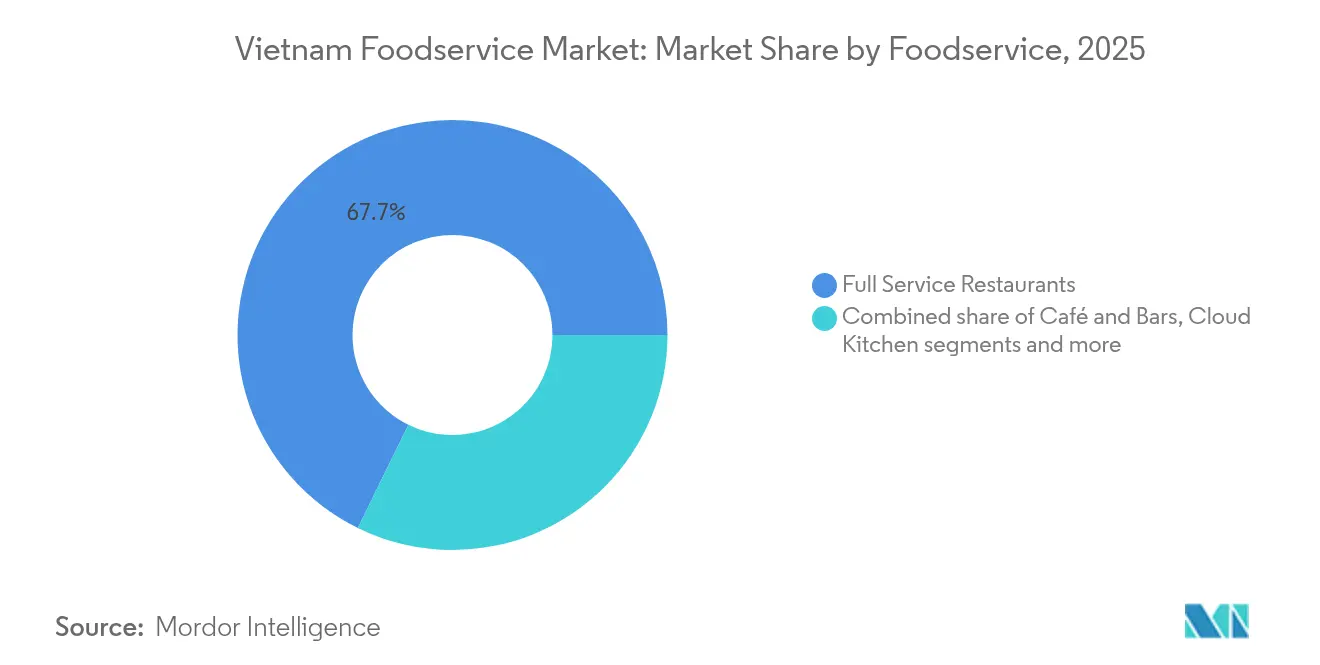
- By foodservice type, full service restaurants held 67.74% of Vietnam foodservice market share in 2025, whereas cloud kitchens are projected to grow at a 18.73% CAGR through 2031.
- By outlet format, independent venues accounted for 77.45% of Vietnam foodservice market size in 2025, while chained outlets are set to expand at an 11.12% CAGR to 2031.
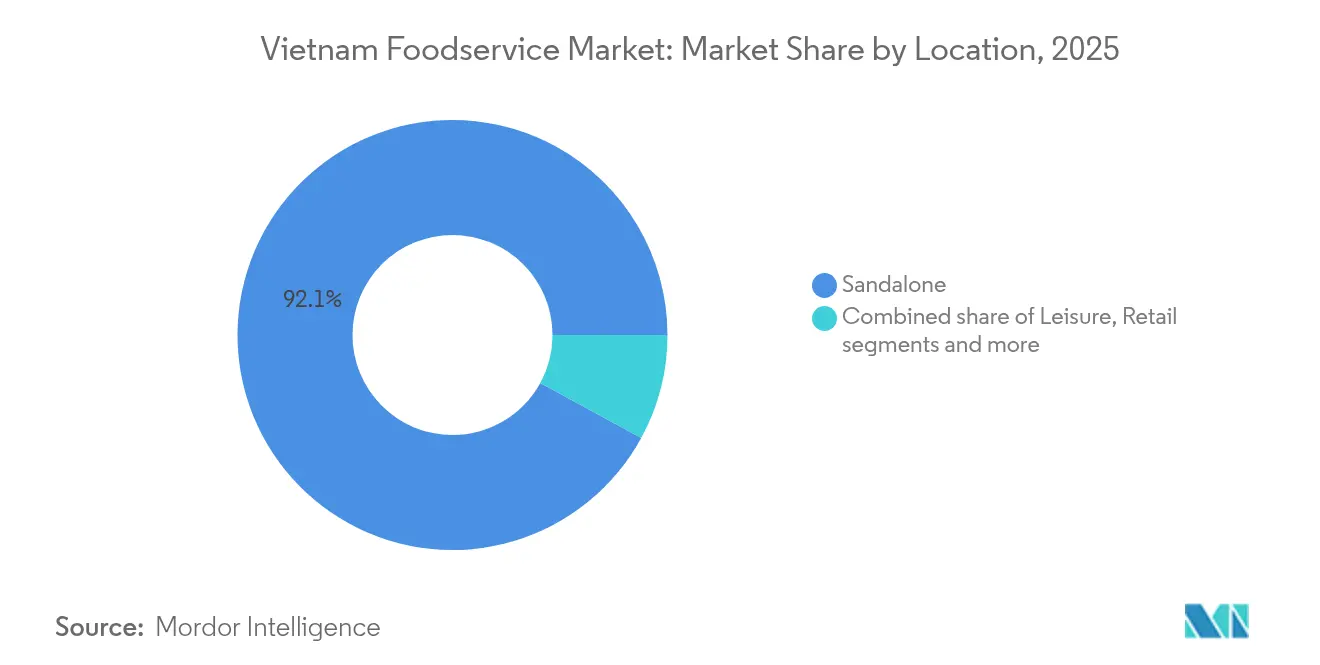
- By location, standalone sites generated 92.05% of sector revenue in 2025, yet travel-related venues are forecast to post a 12.62% CAGR between 2026 and 2031.
- By service, dine-in experiences commanded 75.22% of 2025 sales, and delivery services are expected to advance at a 12.88% CAGR over the outlook period.
Note: Market size and forecast figures in this report are generated using Mordor Intelligence’s proprietary estimation framework, updated with the latest available data and insights as of 2026.
Vietnam Foodservice Market Trends and Insights
Drivers Impact Analysis*
| Driver | (~) % Impact on CAGR Forecast | Geographic Relevance | Impact Timeline |
|---|---|---|---|
| Expansion and modernization of urban infrastructure | +2.1% | National, with early gains in Ho Chi Minh City, Hanoi, Da Nang | Medium term (2-4 years) |
| Rapid digitization and mobile app adoption for ordering | +1.8% | Urban centers, spill-over to secondary cities | Short term (≤ 2 years) |
| Rise of cloud kitchens and virtual-only brands | +1.4% | APAC core, concentrated in major Vietnamese cities | Medium term (2-4 years) |
| Increasing consumer preference for convenience and ready-to-eat food | +1.6% | National, stronger in urban areas | Long term (≥ 4 years) |
| Strong coffee and café culture | +0.9% | National, with regional variations North vs South | Long term (≥ 4 years) |
| Expansion of quick-service and fast-casual restaurant chains | +1.3% | National, franchise-driven expansion | Medium term (2-4 years) |
| Source: Mordor Intelligence | |||


Expansion and Modernization of Urban Infrastructure
Vietnam's rapid urbanization is transforming the foodservice landscape by significantly improving market accessibility through enhanced transportation networks and strategic commercial real estate development. The government's substantial infrastructure investments, particularly the ongoing metro system projects in Ho Chi Minh City and Hanoi, are systematically reducing delivery times and operational costs while opening untapped markets in previously underserved regions. Urban development initiatives are thoughtfully incorporating mixed-use spaces to establish vibrant food courts and dining districts, naturally concentrating consumer foot traffic and enabling restaurants to optimize their marketing investments. The infrastructure modernization has proven especially valuable for delivery-focused operations, as the expanded road networks and strategically positioned logistics centers enable cloud kitchens to efficiently extend their reach across broader service areas. The ongoing transition toward smart city frameworks, complete with seamless payment systems and robust digital infrastructure, is creating a more conducive operating environment for technology-driven foodservice businesses [1]Source: World Bank Group, “Vietnam : Food Smart Country Diagnostic,” worldbank.org.
Rapid Digitization and Mobile App Adoption for Ordering
In Vietnam, digital ordering platforms are transforming the foodservice value chain. Users increasingly depend on app-based recommendations for meal selections. This transition has intensified competition, emphasizing algorithm optimization and customer data analysis. The implementation of QR code payments and integrated point of sale (POS) systems has simplified transactions while providing valuable consumer behavior insights. These insights help businesses develop targeted marketing strategies and optimize their menus. Local companies, such as beFood, use AI-powered recommendation engines to compete with international platforms. Similarly, AhaMove demonstrates local innovation by integrating virtual assistants into restaurant Facebook pages. The digital transformation impacts ordering processes, inventory management, supply chain efficiency, and predictive analytics, creating advantages for early technology adopters. The growth in cashless transactions indicates that digital-first operations will likely perform better than traditional cash-based establishments. According to the International Trade Administration, Vietnam's digital economy market is projected to reach USD 45 billion by 2025, with estimates ranging from USD 90 billion to USD 200 billion by 2030 [2]Source: International Trade Administration, “Vietnam Country Commercial Guide,” trade.gov.
Rise of Cloud Kitchens and Virtual-Only Brands
Cloud kitchens represent the fastest-growing segment in the market, driven by their ability to optimize real estate costs while serving multiple delivery platforms. This business model allows restaurant operators to test new concepts with minimal capital investment compared to traditional establishments, enabling rapid adjustments based on consumer preferences and market dynamics. International brands benefit significantly from this format, as demonstrated by Yi He Tang's container store model in April 2025, which reduces initial investment costs while maintaining operational flexibility. Cloud kitchens facilitate market expansion through strategically placed fulfillment centers, eliminating the complexities associated with site selection and lease negotiations. The format's use of data analytics for menu planning and demand forecasting improves operational efficiency, particularly in inventory management and staff scheduling, providing advantages that traditional restaurants find challenging to replicate.
Increasing Consumer Preference for Convenience and Ready-to-Eat Food
Vietnamese consumers prioritize convenience while maintaining quality expectations in their food choices, with many choosing to dine out during weekends. This consumer behavior has led to menu adaptations focusing on grab-and-go options, meal kits, and ready-to-heat meals that maintain authentic flavors while offering reduced preparation time. Quick-service restaurants and convenience stores have formed foodservice partnerships to meet consumer demands for consistent quality across multiple locations. Price remains a crucial consideration, with consumers showing preference for beverages priced below VND 35,000. The market has expanded beyond traditional dining and takeaway services to include subscription-based meal services and corporate catering contracts. Agriculture and Agri-Food Canada reports that Vietnamese consumers are increasingly purchasing ready-to-eat and instant packaged foods for home consumption, with demand for frozen meals, noodles, and dried products experiencing significant growth following the pandemic [3]Source: Government of Canada, "Sector Trend Analysis – Packaged food trends in Vietnam," agriculture.canada.ca.
Restraints Impact Analysis*
| Restraint | (~) % Impact on CAGR Forecast | Geographic Relevance | Impact Timeline |
|---|---|---|---|
| Supply chain fragility and ingredient sourcing challenges | -1.7% | National, with higher impact in import-dependent segments | Short term (≤ 2 years) |
| Pressure from multinational and domestic chains on smaller operators | -1.2% | Urban centers, franchise corridor expansion | Medium term (2-4 years) |
| Quality consistency issues and lack of standardized operating procedures among independents | -0.8% | National, concentrated in independent operator segments | Medium term (2-4 years) |
| Frequent policy/tax changes on food and beverage products | -0.6% | National, regulatory compliance impact | Short term (≤ 2 years) |
| Source: Mordor Intelligence | |||
Supply Chain Fragility and Ingredient Sourcing Challenges
Vietnam's foodservice sector grapples with persistent supply chain vulnerabilities, as escalating raw material costs continue to erode profit margins across the entire spectrum of food service operators. The unpredictable nature of agricultural prices, compounded by weather pattern changes and worldwide commodity market fluctuations, forces businesses to regularly adjust their menu prices. These constant price revisions strain relationships with regular customers and complicate long-term business planning. International cuisine establishments face additional challenges due to their reliance on imported ingredients, making them susceptible to exchange rate fluctuations and supply chain disruptions. This vulnerability particularly affects high-end restaurants and premium dining venues. The inadequate cold storage infrastructure in smaller cities creates significant obstacles for maintaining fresh ingredient quality, leading to increased food wastage and limiting business growth opportunities for establishments focused on quality dining experiences. The burden of maintaining food safety standards under Hazard Analysis Critical Control Point (HACCP) protocols adds another layer of operational challenges, particularly impacting independent restaurant owners who struggle to distribute compliance-related costs across their operations.
Pressure from Multinational and Domestic Chains on Smaller Operators
The expansion of international franchises and domestic chains creates competitive pressure on independent operators, who face challenges matching the marketing capabilities, operational efficiency, and pricing advantages of larger competitors. Chinese chains, such as Mixue with its significant store presence in Vietnam, demonstrate how rapid expansion strategies can capture market share through standardized operations and competitive pricing. Independent operators encounter difficulties securing prime locations, as property owners prefer established chains with proven performance and financial stability. The technological disparity between chains and independents continues to grow, as larger operators implement advanced point of sale (POS) systems, customer relationship management, and supply chain optimization tools that smaller businesses cannot implement. The competition for workers increases as chains provide structured career advancement and benefits, making it challenging for independents to retain qualified staff amid rising minimum wages.
*Our forecasts treat driver/restraint impacts as directional, not additive. The impact forecasts reflect baseline growth, mix effects, and variable interactions.
Segment Analysis
By Foodservice Type: Full Service Restaurants Lead Despite Cloud Kitchen Surge
Full-service restaurants dominate the Vietnamese foodservice market with a 67.74% share in 2025, as diners consistently choose establishments that offer complete dining experiences. These restaurants successfully combine high-quality food offerings with opportunities for social gatherings and pleasant environments. Quick-service restaurants continue to expand through franchising and menu adaptation to local tastes, while cafes and bars thrive within Vietnam's well-established coffee culture
Cloud kitchens are experiencing rapid expansion with a 18.73% CAGR from 2026-2031, as their business model requires lower capital investment and meets the growing demand for food delivery services. The market demonstrates two clear patterns: traditional full-service establishments maintain market leadership by offering distinctive dining experiences, while cloud kitchens gain ground through efficient operations. Within each segment, diverse cuisine options create specialized markets, with Korean and Japanese restaurants showing strong performance in urban locations, while Vietnamese regional dishes remain successful across all restaurant types.


By Outlet: Independent Operators Dominate Amid Chain Consolidation
The Vietnamese foodservice market shows a strong preference for independent businesses, which currently control 77.45% of the market share in 2025. This reflects the country's entrepreneurial spirit and consumers' natural inclination toward authentic, local dining experiences. However, chain establishments are gaining momentum, showing an 11.12% CAGR during 2026-2031, as they leverage their advantages in standardized operations, centralized purchasing, and brand recognition.
The franchise business model is becoming increasingly attractive in Vietnam, as it combines the benefits of rapid expansion while preserving local ownership. Local brands like Trung Nguyen E-Coffee have set ambitious targets of 3,000 stores, while international players such as Minor Food Group aim to double their footprint to exceed 200 outlets by 2026. Independent business owners are experiencing mounting challenges, particularly from labor cost increases, with minimum wages set to rise by 6.92% in 2025, alongside regulatory requirements that favor businesses with dedicated administrative teams. The current regulatory environment, governed by Decree 35/2006 and its subsequent modifications, creates favorable conditions for master franchise agreements, enabling local entrepreneurs to access proven business systems while maintaining operational independence.
By Locations: Standalone Dominance Faces Travel Segment Revival
Standalone locations command a dominant 92.05% market share in 2025, underscoring Vietnam's deeply embedded street-food heritage and cultural identity. These neighborhood-based dining establishments serve as vital pillars of local communities, offering authentic culinary experiences that resonate with both residents and visitors. The prevalence of these standalone operations reflects a time-honored tradition of food service, where recipes and cooking techniques have been carefully preserved and transmitted across generations, maintaining the authentic character of Vietnamese cuisine.
The Travel segment exhibits remarkable growth potential, with projections indicating a robust CAGR of 12.62% during 2026-2031. This growth trajectory is primarily fueled by the substantial recovery in tourism and strategic infrastructure investments that enhance accessibility to previously remote destinations. The Retail segment demonstrates steady expansion through methodical shopping center development and sophisticated food court integration, while the Lodging segment capitalizes on an extensive hotel development pipeline and the progressive revival of business travel. The spatial distribution of these establishments closely aligns with Vietnam's evolving urbanization patterns, characterized by standalone operations maintaining their stronghold in residential districts, while travel-oriented establishments strategically cluster around major tourist attractions and transportation nodes to maximize customer engagement and operational efficiency.
By Service Type: Dine-in Leadership Challenged by Delivery Growth
Dine-in service maintains a dominant position with a 75.22% market share in 2025, demonstrating the deep-rooted cultural significance of communal dining experiences in Vietnam. Vietnamese consumers continue to value social interactions during meals, making restaurants and dining establishments the primary choice for both casual and formal dining occasions. This preference for dine-in experiences remains strong despite the emergence of alternative service models, highlighting the importance of traditional dining customs in Vietnamese society.
The delivery service segment exhibits substantial growth potential, with a projected CAGR of 12.88% from 2026 to 2031, as consumers increasingly embrace digital solutions for their dining needs. This growth is supported by the widespread adoption of food delivery platforms and changing consumer preferences toward convenience-oriented solutions. Takeaway services continue to serve as an essential intermediate option, particularly appealing to the growing urban workforce who face time constraints during their workday. The market landscape is shaped by major digital platforms such as GrabFood and ShopeeFood, while domestic players like beFood differentiate themselves through personalized customer experiences. This service diversification responds directly to the evolving lifestyle patterns driven by urbanization and increasingly demanding work schedules in Vietnam's major cities.
Competitive Landscape
Vietnam's foodservice market exhibits distinct regional characteristics that reflect economic development patterns, cultural preferences, and infrastructure capabilities across the country. The South, led by Ho Chi Minh City, generates a significant portion of national GDP despite housing a smaller percentage of the population, creating higher disposable incomes that drive premium dining and international cuisine adoption. Southern consumers allocate larger portions of household budgets to out-of-home dining and demonstrate greater willingness to try new concepts, making this region the primary testing ground for international brands and innovative formats. The North, centered on Hanoi, shows stronger preference for local brands and traditional formats, maintaining significant market size due to higher population density and government sector spending.
Urban-rural dynamics create additional complexity, with urban centers driving technology adoption and delivery service growth while rural areas maintain traditional dining patterns focused on family-style establishments and local specialties. Internet usage patterns favor urban and South Rural areas, creating geographic advantages for digital marketing and online ordering platforms that influence competitive positioning. The tourism recovery, with South Korea leading international arrivals and Chinese visitors returning, particularly benefits coastal and heritage destinations where foodservice operators can capture both domestic and international demand streams.
Regional infrastructure development varies significantly, with metro systems and improved transportation networks in major cities enabling delivery expansion and reducing operational costs for multi-location operators. The government's smart city initiatives and digital infrastructure investments create geographic advantages for tech-enabled foodservice formats, while traditional operators maintain strength in areas with limited digital penetration. Supply chain efficiency differs by region, with the South benefiting from port access and established distribution networks, while northern and central regions face higher logistics costs that influence menu pricing and format selection strategies.
Vietnam Foodservice Industry Leaders
-
Golden Gate Group JSC
-
Imex Pan Pacific Group
-
Jollibee Foods Corporation
-
Lotte GRS Co. Ltd.
-
Mesa Group
- *Disclaimer: Major Players sorted in no particular order

Recent Industry Developments
- April 2025: Sojitz and Royal Holdings launched THE ROYAL restaurant in Ho Chi Minh, marking their entry into Vietnam’s foodservice industry and expanding joint restaurant operations beyond Japanese and Western cuisines to reinforce the retail value chain in the region.
- February 2025: Golden Gate Group acquired The Coffee House and plans to revitalize the premium coffee chain following its store closures. The company aims to utilize its extensive food and beverage expertise to strengthen The Coffee House's competitive position in Vietnam's growing coffee shop market.
- February 2024: Golden Gate Group opened its second food manufacturing facility in Thach That, Hanoi. The factory incorporates modern production lines with an annual capacity of 15,000 tons to supply restaurants and fast-moving consumer goods (FMCG) partners throughout Vietnam's distribution network.


Vietnam Foodservice Market Report Scope
By Foodservice Type
| Café and Bars | By Cuisine | Bars and Pubs |
| Café | ||
| Juice/Smoothie/Desserts Bars | ||
| Specialist Coffee and Tea Shops | ||
| Cloud Kitchen | ||
| Full Service Restaurants | By Cuisine | Asian |
| European | ||
| Latin American | ||
| Middle Eastern | ||
| North American | ||
| Other FSR Cuisines | ||
| Quick Service Restaurants | By Cuisine | Bakeries |
| Burger | ||
| Ice Cream | ||
| Meat-based Cuisines | ||
| Pizza | ||
| Other QSR Cuisines |
By Outlet
| Chained Outlets |
| Independent Outlets |
By Locations
| Leisure |
| Lodging |
| Retail |
| Sandalone |
| Travel |
By Service Type
| Dine-in |
| Takeaway |
| Delivery |
| By Foodservice Type | Café and Bars | By Cuisine | Bars and Pubs |
| Café | |||
| Juice/Smoothie/Desserts Bars | |||
| Specialist Coffee and Tea Shops | |||
| Cloud Kitchen | |||
| Full Service Restaurants | By Cuisine | Asian | |
| European | |||
| Latin American | |||
| Middle Eastern | |||
| North American | |||
| Other FSR Cuisines | |||
| Quick Service Restaurants | By Cuisine | Bakeries | |
| Burger | |||
| Ice Cream | |||
| Meat-based Cuisines | |||
| Pizza | |||
| Other QSR Cuisines | |||
| By Outlet | Chained Outlets | ||
| Independent Outlets | |||
| By Locations | Leisure | ||
| Lodging | |||
| Retail | |||
| Sandalone | |||
| Travel | |||
| By Service Type | Dine-in | ||
| Takeaway | |||
| Delivery | |||


Market Definition
- FULL-SERVICE RESTAURANTS - A foodservice establishment where customers are seated at a table, give their order to a server and are served food at a table.
- QUICK SERVICE RESTAURANTS - A foodservice establishment that provides customers convenience, speed, and food offerings at lower prices. Customers usually help themselves and carry their own food to their tables.
- CAFES & BARS - A type of foodservice business that include bars and pubs that are licensed to serve alcoholic drinks for consumption, cafes that serve refreshments and light food items, as well as specialty tea and coffee shops, dessert bars, smoothie bars, and juice bars.
- CLOUD KITCHEN - A foodservice business that utilizes a commercial kitchen for the purpose of preparing food for delivery or takeout only, with no dine-in customers.
| Keyword | Definition |
|---|---|
| Albacore Tuna | It is one of the smallest species of tuna found in the six distinct stocks known globally in the Atlantic, Pacific, and Indian oceans, as well as the Mediterranean Sea. |
| Angus beef | It is beef derived from a specific breed of cattle indigenous to Scotland. It requires certification from the American Angus Association to receive the "Certified Angus Beef" quality mark. |
| Asian cuisine | It includes full-service offerings in restaurants that serve cuisines from cultures such as Chinese, Indian, Korean, Japanese, Bengali, Southeast Asian, etc. |
| Average Order Value | It is the average value of all orders made by the customers at a foodservice establishment. |
| Bacon | It is salted or smoked meat that comes from the back or sides of a pig. |
| Bars & Pubs | It is a drinking establishment that is licensed to serve alcoholic drinks for consumption on the premises. |
| Black Angus | It is beef derived from a black-hided breed of cows that don't have horns. |
| BRC | British Retail Consortium |
| Burger | It is a sandwich consisting of one or more cooked beef patties, placed inside a sliced bread roll or bun roll. |
| Café | It is a foodservice establishment serving various refreshments (mainly coffee) and light meals. |
| Cafes & Bars | It is a type of foodservice business that include bars and pubs that are licensed to serve alcoholic drinks for consumption, cafes that serve refreshments and light food items, as well as specialty tea and coffee shops, dessert bars, smoothie bars, and juice bars. |
| Cappuccino | It is an Italian coffee drink that is traditionally prepared with equal parts double espresso, steamed milk, and steamed milk foam. |
| CFIA | Canadian Food Inspection Agency |
| Chained Outlet | It refers to a foodservice establishment that shares brands, operates in several locations, has central management, and standardized business practices. |
| Chicken Tender | It refers to chicken meat prepared from the pectoralis minor muscles of a chicken bird. |
| Cloud Kitchen | It is a foodservice business that utilizes a commercial kitchen for the purpose of preparing food for delivery or takeout only, with no dine-in customers. |
| Cocktail | It is an alcoholic mixed drink made with either a single spirit or a combination of spirits, mixed with other ingredients such as juices, flavored syrups, tonic water, shrubs, and bitters. |
| Edamame | It is a Japanese dish prepared with soybeans (harvested before they ripen or harden) and cooked in its pod. |
| EFSA | European Food Safety Authority |
| ERS | Economic Research Service of the USDA |
| Espresso | It is a concentrated form of coffee, served in shots. |
| European cuisine | It includes full-service offerings in restaurants that serve cuisines from cultures such as Italian, French, German, English, Dutch, Danish, etc. |
| FDA | Food and Drug Administration |
| Fillet Mignon | It is a cut of meat taken from the smaller end of the tenderloin. |
| Flank Steak | It is a cut of beef steak taken from the flank, which lies forward of the rear quarter of a cow. |
| Foodservice | It refers to the part of the food industry which includes businesses, institutions, and companies which prepare meals outside the home. It includes restaurants, school and hospital cafeterias, catering operations, and many other formats. |
| Franks | Also known as frankfurter or Würstchen, it is a type of highly seasoned smoked sausage popular in Austria and Germany. |
| FSANZ | Food Standards Australia New Zealand |
| FSIS | Food Safety and Inspection Service |
| FSSAI | Food Safety and Standards Authority of India |
| Full service restaurant | It refers to a foodservice establishment where customers are seated at a table, give their order to a server, and are served food at a table. |
| Ghost Kitchen | It refers to a cloud kitchen. |
| GLA | Gross Leasable Area |
| Gluten | It is a family of proteins found in grains, including wheat, rye, spelt, and barley. |
| Grain-fed beef | It is beef derived from cattle that have been fed a diet supplemented with soy and corn and other additives. Grain-fed cows can also be given antibiotics and growth hormones to fatten them up more quickly. |
| Grass-fed beef | It is beef derived from cattle that have only been fed grass as feed. |
| Ham | It refers to the pork meat taken from the leg of a pig. |
| HoReCa | Hotels, Restaurants and Cafes |
| Independent Outlet | It refers to a foodservice establishment that operates with a single outlet or is structured as a small chain with no more than three locations. |
| Juice | It is a drink made from the extraction or pressing of the natural liquid contained in fruit and vegetables. |
| Latin American | It includes full-service offerings in restaurants that serve cuisines from cultures such as Mexican, Brazilian, Argentinian, Colombian, etc. |
| Latte | It is a milk-based coffee that is made up of one or two shots of espresso, steamed milk, and a thin layer of frothed milk. |
| Leisure | It refers to foodservice offered as a part of a recreation business, such as sports arenas, zoos, movie theaters, and museums. |
| Lodging | It refers to foodservice offerings at hotels, motels, guesthouses, holiday homes, etc. |
| Macchiato | It is an espresso coffee drink with a small amount of milk, usually foamed. |
| Meat-based cuisines | This inlcudes food items like fried chicken, steak, ribs, etc. where meat is the primary ingredient for the dish. |
| Middle Eastern cuisine | It includes full-service offerings in restaurants that serve cuisines from cultures such as Arabic, Lebanese, Iranian, Israeli, etc. |
| Mocktail | It is an non-alcoholic mixed drink. |
| Mortadella | It is a large Italian sausage or luncheon meat made of finely hashed or ground heat-cured pork, which incorporates at least 15% small cubes of pork fat. |
| North American | It includes full-service offerings in restaurants that serve cuisines from cultures such as American, Canadian, Caribbean, etc. |
| Pastrami | It refers to a highly seasoned smoked beef, typically served in thin slices. |
| PDO | Protected Designation of Origin: It is the name of a geographical region or specific area that is recognized by official rules to produce certain foods with special characteristics related to location. |
| Pepperoni | It is an American variety of spicy salami made from cured meat. |
| Pizza | It is a dish made typically of flattened bread dough spread with a savory mixture usually including tomatoes and cheese and often other toppings and baked. |
| Primal cuts | It refers to the major sections of the carcass. |
| Quick service restaurant | It refers to a foodservice establishment that provides customers convenience, speed, and food offerings at lower prices. Customers usually help themselves and carry their own food to their tables. |
| Retail | It refers to a foodservice outlet inside a mall. shopping complex or a commercial real estate building, where there are other businesses operating as well. |
| Salami | It is a cured sausage consisting of fermented and air-dried meat. |
| Saturated fat | It is a type of fat in which the fatty acid chains have all single bonds. It is generally considered unhealthy. |
| Sausage | It is a meat product made of finely chopped and seasoned meat, which may be fresh, smoked, or pickled and which is then usually stuffed into a casing. |
| Scallop | It is an edible shellfish that is a mollusk with a ribbed shell in two parts. |
| Seitan | It is a plant-based meat substitute made out of wheat gluten. |
| Self-service kiosk | It refers to a self-order point-of-sale (POS) system through which customers place and pay for their own orders at kiosks, enabling totally contactless and frictionless service. |
| Smoothie | It is a beverage made by placing all the ingredients in a container and processing them together, without removing the pulp. |
| Specialty coffee & tea shops | It refers to a foodservice establishment that serves only various types of tea or coffee. |
| Standalone | It refers to a restaurants that have an independent infrastructure setup and not connected to any other business. |
| Sushi | It is a Japanese dish of prepared vinegared rice, usually with some sugar and salt, accompanied by a variety of ingredients, such as seafood—often raw—and vegetables. |
| Travel | It refers to foodservice offerings such as airplane food, dining on long-distance trains, and foodservice on cruise ships. |
| Virtual Kitchen | It refers to a cloud kitchen. |
| Wagyu Beef | It is beef derived from any of four strains of a breed of black or red Japanese cattle that are valued for their highly marbled meat. |


Research Methodology
Mordor Intelligence follows a four-step methodology in all our reports.
- Step-1: Identify Key Variables: In order to build a robust forecasting methodology, the variables and factors identified in Step 1 are tested against available historical market numbers. Through an iterative process, the variables required for the market forecast are set, and the model is built on the basis of these variables.
- Step-2: Build a Market Model: Market size estimations for the forecast years are in nominal terms. Inflation is considered for average order value, and it is forecasted as per predicted inflation rates in the countries.
- Step-3: Validate and Finalize: In this important step, all market numbers, variables, and analyst calls are validated through an extensive network of primary research experts from the market studied. The respondents are selected across levels and functions to generate a holistic picture of the market studied.
- Step-4: Research Outputs: Syndicated Reports, Custom Consulting Assignments, Databases & Subscription Platforms


