Pet Care Market Size and Share
Market Overview
| Study Period | 2021 - 2031 |
|---|---|
| Market Size (2026) | USD 260.10 Billion |
| Market Size (2031) | USD 361.20 Billion |
| Growth Rate (2026 - 2031) | 6.80% CAGR |
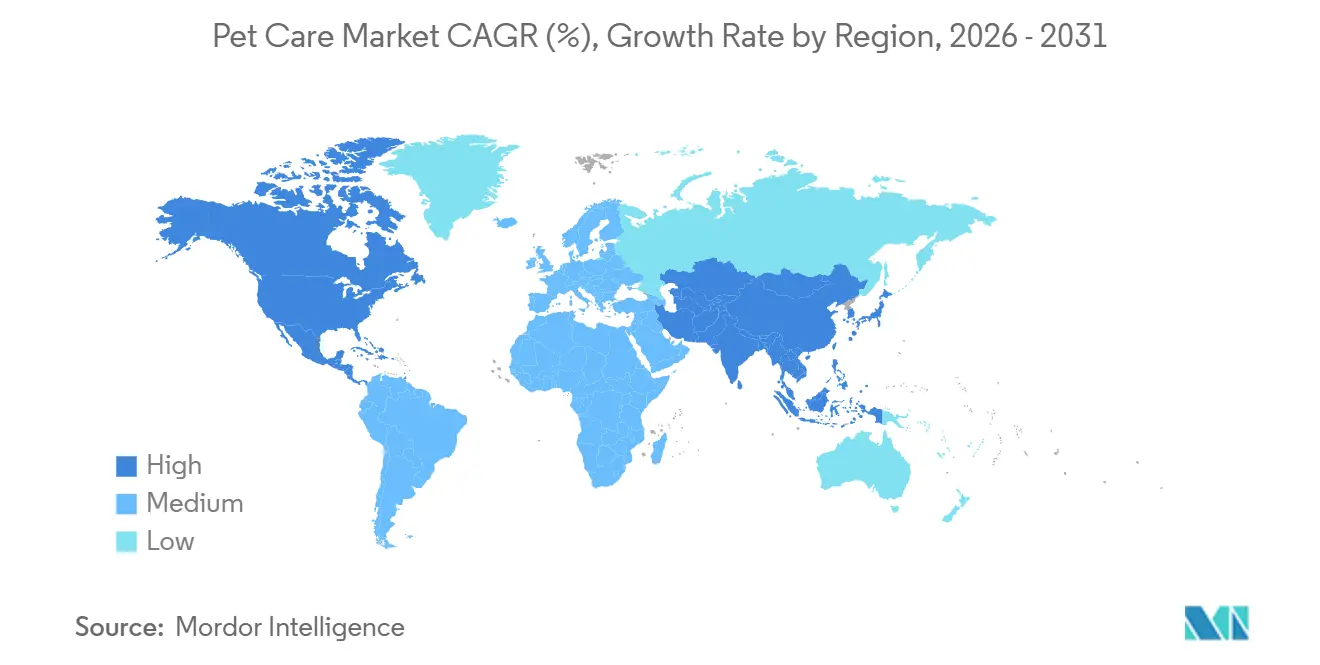
| Fastest Growing Market | Asia-Pacific |
| Largest Market | North America |
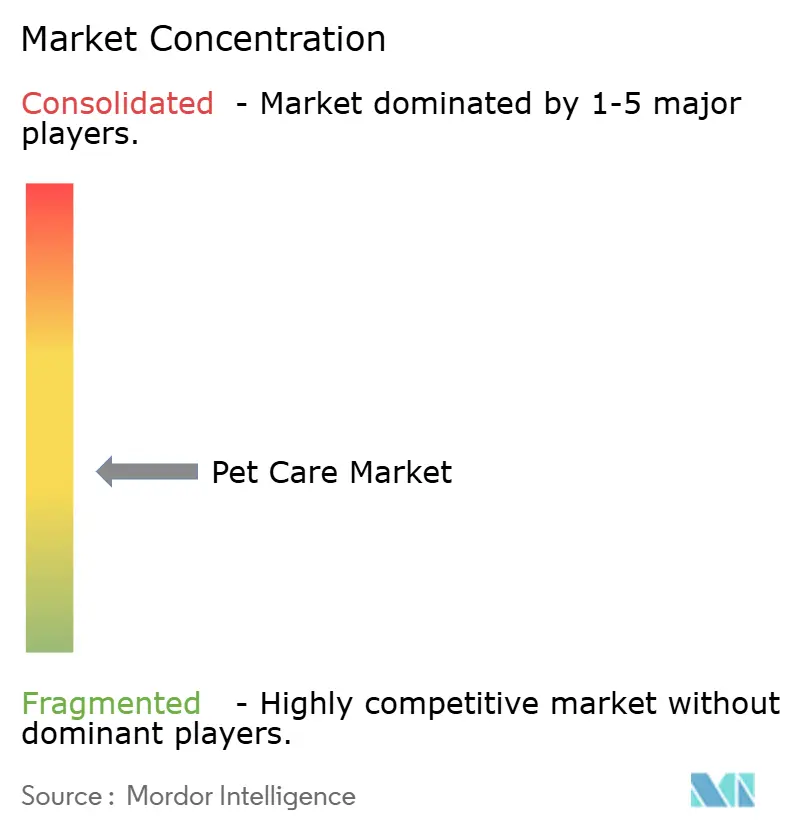
| Market Concentration | Medium |
Major Players *Disclaimer: Major Players sorted in no particular order Image © Mordor Intelligence. Reuse requires attribution under CC BY 4.0. | |
Pet Care Market Analysis by Mordor Intelligence
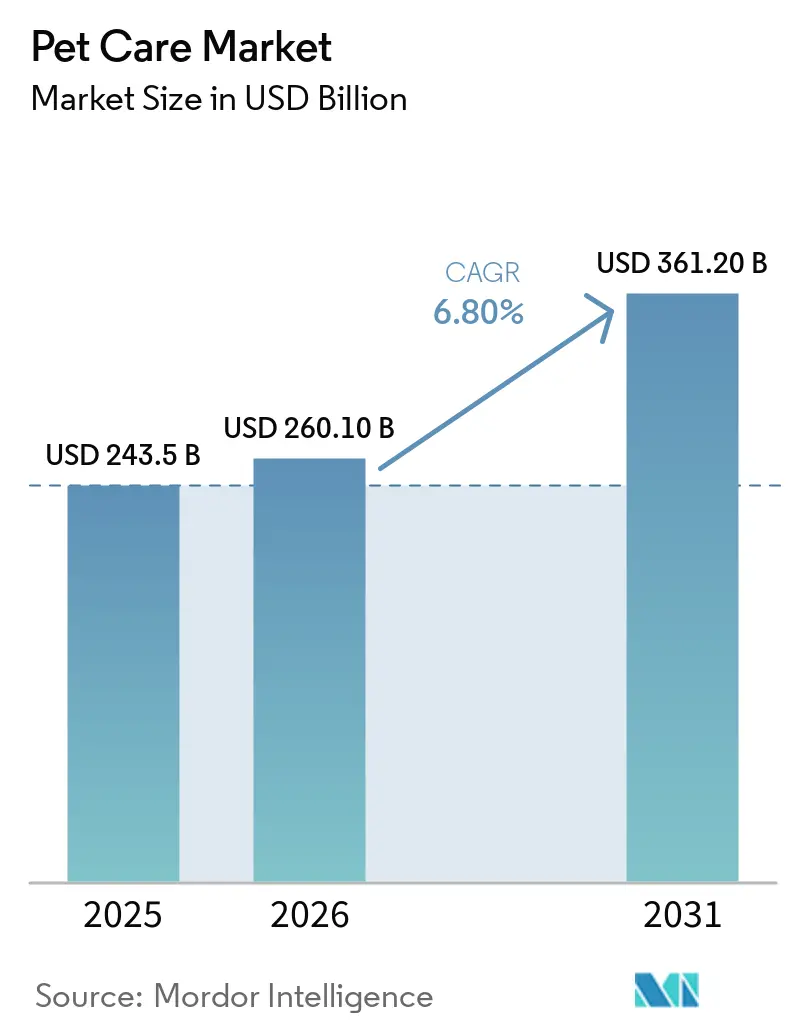
The pet care market size was valued at USD 243.50 billion in 2025 and is projected to grow from USD 260.10 billion in 2026 to USD 361.20 billion by 2031, registering a CAGR of 6.80% from 2026 to 2031. The market remains resilient despite broader consumer pressures, as spending on pets increasingly shifts toward being considered a semi-essential household category rather than a discretionary expense. Pet owners are adopting human-grade standards for nutrition, preventive care, grooming, and service quality, driving higher average spending across the pet care market. Trends such as premiumization, digital commerce, and the medicalization of companion animal care are simultaneously reinforcing each other, expanding revenue opportunities for established brands and service providers. Large companies are responding by integrating food, diagnostics, pharmacy, and veterinary care, while newer entrants aim to capture market share through ingredient innovation and digital-first strategies.
Key Report Takeaways
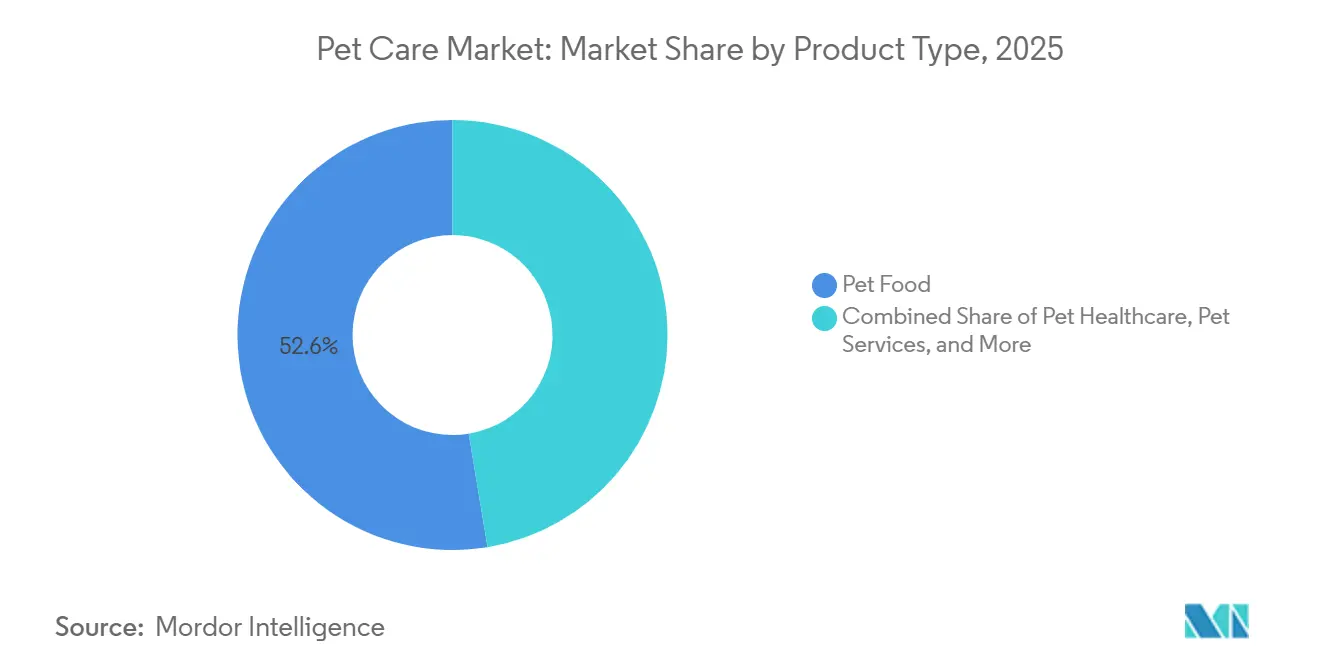
- By product type, the pet care market share for pet food held the largest 52.6% in 2025, while the pet care market size for the pet services segment is forecast to grow at the fastest 10.0% CAGR from 2026 to 2031.
- By animal type, the pet care market share for dogs accounted for the largest 48.0% in 2025, while the pet care market size for cats is projected to grow at the fastest 8.4% CAGR from 2026 to 2031.
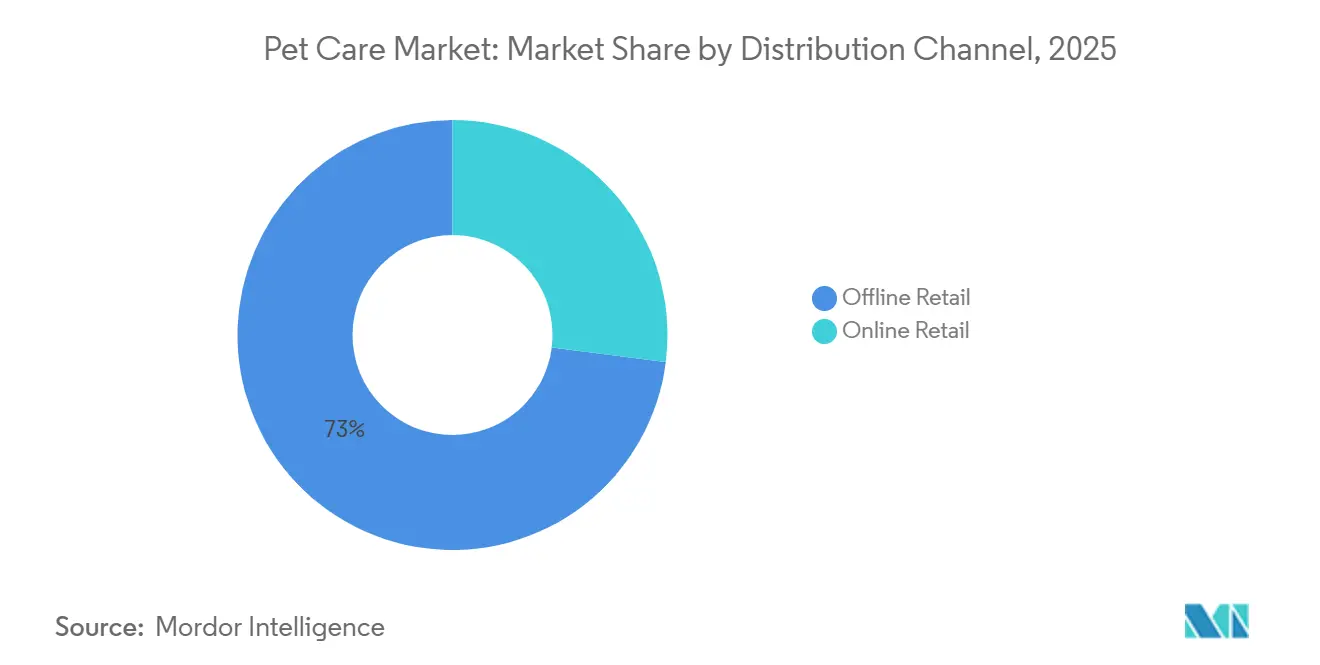
- By distribution channel, the pet care market share for the offline retail segment held the largest 73.0% in 2025, while the pet care market size for the online retail segment is projected to grow at the fastest 11.8% CAGR from 2026 to 2031.
- By geography, the pet care market share for North America accounted for the largest 33.5% of in 2025, while the Asia-Pacific market size is projected to grow at the fastest CAGR at 9.6% from 2026 to 2031.
Note: Market size and forecast figures in this report are generated using Mordor Intelligence’s proprietary estimation framework, updated with the latest available data and insights as of January 2026.
Global Pet Care Market Trends and Insights
Drivers Impact Analysis*
| Driver | (~) % Impact on CAGR Forecast | Geographic Relevance | Impact Timeline |
|---|---|---|---|
| Pet humanization and premiumization | +2.1% | Global, strongest in North America, Europe, and East Asia | Long term (≥ 4 years) |
| Rising millennial and Generation Z pet ownership | +1.5% | Global, strongest in North America, Asia-Pacific, and South America | Long term (≥ 4 years) |
| Online retail and autoship expansion | +1.2% | North America and Europe, with Asia-Pacific converging quickly | Medium term (2-4 years) |
| Preventive care and insurance adoption | +0.8% | North America and Europe, with early growth in Asia-Pacific | Medium term (2-4 years) |
| Veterinary clinic corporatization and care-plan cross-sell | +0.6% | North America and United Kingdom, with early activity in Australia and Western Europe | Short term (≤ 2 years) |
| Novel proteins and functional ingredient approvals | +0.5% | North America and European Union, with spillover into Asia-Pacific | Long term (≥ 4 years) |
| Source: Mordor Intelligence | |||
Pet Humanization and Premiumization
Pet humanization and premiumization are driving long-term growth in the pet care market, as consumers increasingly view companion animals as family members and allocate more spending toward wellness-focused products and services. According to the American Pet Products Association, dog ownership reached 53% of United States households in 2025, up from 51% the previous year, highlighting the growing demand for premium nutrition, preventive healthcare, diagnostics, grooming, and enrichment-related pet care products[1]Source: American Pet Products Association, “2026 State of the Industry Report,” americanpetproducts.org. Additionally, the rising emotional attachment to pets is fostering increased expenditure on chronic care management, specialty treatments, and age-related healthcare services, contributing to sustained value growth in the pet care market.
Preventive Care and Insurance Adoption
Preventive care and the adoption of pet insurance are driving growth in the pet care market, as insurance coverage promotes increased spending on diagnostics, treatments, and routine veterinary services. According to the North American Pet Health Insurance Association (NAPHIA), the total written premium in North America reached USD 5.2 billion in 2024, up from USD 4.2 billion in 2023[2]Source: North American Pet Health Insurance Association, “State of the Industry Report 2025,” naphia.org. The rising adoption of pet insurance is enhancing access to preventive healthcare, chronic disease management, and advanced veterinary procedures. It also motivates pet owners to seek higher-value clinical care and wellness services for their companion animals.
Veterinary Clinic Corporatization and Care-Plan Cross-Sell
Veterinary clinic corporatization and the integration of care plans are driving growth in the pet care market, as larger veterinary networks enhance access to diagnostics, preventive care, pharmacy services, and recurring wellness programs. In April 2026, Chewy, Inc. announced the acquisition of Modern Animal, increasing the number of Chewy Vet Care locations from 18 to 47 clinics across the United States. This acquisition enhances the delivery of integrated veterinary services by linking in-clinic care, digital health services, diagnostics, and pharmacy fulfillment within a comprehensive companion animal healthcare ecosystem.
Novel Proteins and Functional Ingredient Approvals
Approvals for novel proteins and functional ingredients are driving innovation in the pet care market, as manufacturers explore sustainable and high-performance alternatives to traditional animal proteins. In May 2026, Bond Pet Foods and Hill’s Pet Nutrition, Inc. received a Letter of No Objection from the United States Food and Drug Administration Center for Veterinary Medicine for Lamb Protein Yeast. This marks the first precision fermentation-derived animal protein approved for use in dog food through the Generally Recognized as Safe (GRAS) pathway. This approval supports the development of premium, sustainable, and functional pet nutrition products within the companion animal healthcare and nutrition industry.
Restraints Impact Analysis*
| Restraint | (~) % Impact on CAGR Forecast | Geographic Relevance | Impact Timeline |
|---|---|---|---|
| Raw material and packaging cost volatility | -0.8% | Global, most acute in North America, Europe, and South America | Short term (≤ 2 years) |
| Labeling and claims compliance tightening | -0.5% | North America and European Union, with Asia-Pacific regulators following | Medium term (2-4 years) |
| Veterinary labor shortages | -0.6% | North America, United Kingdom, and Australia | Long term (≥ 4 years) |
| Cold-chain and last-mile economics for fresh diets | -0.4% | North America and Europe, with growing pressure in core Asia-Pacific markets | Medium term (2-4 years) |
| Source: Mordor Intelligence | |||
Raw Material and Packaging Cost Volatility
Volatility in raw material and packaging costs continues to be a significant restraint on the pet care market. Fluctuations in the prices of protein ingredients, packaging materials, freight, and energy directly impact manufacturing expenses and consumer pricing. According to Zoetis Inc.'s 2025 Annual Report, macroeconomic pressures and reduced household spending have influenced veterinary visit trends and purchasing behavior across companion animal healthcare categories. Increasing cost sensitivity among pet owners is prompting companies to enhance supply chain management, optimize sourcing strategies, and prioritize operational efficiency to sustain margins within the pet care industry.
Veterinary Labor Shortages
Veterinary labor shortages are hindering growth in the pet care market by limiting clinic capacity, increasing appointment wait times, and restricting access to veterinary services in various regions. The American Association of Veterinary Medical Colleges estimates that the total demand for veterinarians in the United States will reach 70,092 positions by 2032, while only 52,926 veterinary graduates are projected during this period, leading to a projected shortfall of 17,166 veterinarians[3]Source: American Association of Veterinary Medical Colleges, “Demand for and Supply of Veterinarians in the United States to 2032,” aavmc.org. This shortage is driving the adoption of telemedicine, workflow automation, and enhanced utilization of support staff within the companion animal healthcare industry.
*Our forecasts treat driver/restraint impacts as directional, not additive. The impact forecasts reflect baseline growth, mix effects, and variable interactions.
Segment Analysis
By Product Type: Pet Food Anchors Revenue, Pet Services Set to Outpace
The pet care market share for the pet food segment accounted for the largest 52.6% in 2025. Pet food remains the dominant category due to its recurring purchase frequency, wide product availability, and increasing consumer preference for premium and functional nutrition products. Demand is shifting toward fresh, refrigerated, grain-free, and veterinary-recommended formulations that address digestive health, weight management, and age-specific nutrition needs. Manufacturers are expanding premium offerings by incorporating sustainable ingredients and personalized feeding solutions. Strong retail penetration across supermarkets, pet specialty stores, veterinary clinics, and e-commerce platforms continues to support stable consumer spending in both developed and emerging companion animal care markets globally.
The pet care market size for the pet services segment is projected to grow at the fastest 10.0% CAGR from 2026 to 2031. This growth is driven by increasing expenditure on veterinary care, grooming, daycare, boarding, insurance, and preventive healthcare services. Consumers increasingly consider pet wellness and routine medical care as essential household expenses rather than discretionary spending. Subscription-based veterinary plans, telehealth consultations, diagnostics, and behavioral support services are also expanding rapidly in urban markets. Additionally, the aging pet population and rising awareness of preventive treatments continue to drive long-term demand for recurring clinical and wellness-focused pet service offerings within the companion animal healthcare ecosystem.


By Animal Type: Dog Ownership Leads, Cat Segment Accelerates Structurally
The pet care market share for dogs held the largest 48.0% in 2025. Dogs generate the highest spending across categories such as nutrition, veterinary care, grooming, wellness products, preventive treatments, and accessories due to higher ownership levels and broader care requirements. Additionally, dog owners spend more frequently on training services, mobility products, and outdoor-oriented healthcare solutions compared to owners of other companion animals. The adoption of premium food and increased frequency of veterinary visits continue to drive demand in this segment. Product manufacturers and veterinary providers focus on dog-specific portfolios due to stronger cross-selling opportunities across nutrition, pharmaceuticals, diagnostics, grooming, and wellness service ecosystems.
The pet care market size for cats is forecast to grow at the fastest 8.4% CAGR from 2026 to 2031. Rising urbanization and increasing adoption among younger households are driving stronger demand for feline nutrition, litter, grooming, and healthcare products. Cat owners are increasingly investing in indoor enrichment, preventive healthcare, calming products, and premium feeding solutions tailored to smaller living environments. Veterinary providers and manufacturers are expanding cat-focused healthcare services and specialized dietary formulations. Growth in e-commerce and subscription-based delivery models is further enhancing accessibility to premium feline products and recurring wellness-related purchases in metropolitan and digitally connected consumer markets worldwide.
By Distribution Channel: Offline Retail Holds Volume, Online Retail Competes on Loyalty
The pet care market share for the offline retail segment accounted for the largest 73.0% in 2025. Supermarkets, hypermarkets, pet specialty retailers, and veterinary clinics continue to dominate sales due to consumer preferences for immediate product access, in-person consultations, and the ability to physically evaluate products such as food, medicines, and care supplies. Veterinary clinics remain key distribution points for prescription diets, preventive treatments, and wellness products. Premium pet food brands are enhancing their shelf presence through retail partnerships and exclusive in-store product offerings. The established retail infrastructure and extensive geographic reach support strong consumer purchasing activity across both developed and emerging companion animal care markets globally.
The pet care market size for the online retail segment is forecast to grow at the fastest 11.8% CAGR from 2026 to 2031. E-commerce growth is driven by factors such as autoship subscriptions, home delivery convenience, digital product comparisons, and the expansion of direct-to-consumer pet care brands. Consumers are increasingly purchasing recurring supplies, including food, supplements, grooming products, and preventive healthcare items, through online platforms due to convenience and pricing flexibility. Retailers are leveraging artificial intelligence-driven recommendations and loyalty programs to enhance customer retention and increase basket sizes. The expansion of digital commerce continues to strengthen omnichannel purchasing behavior across premium nutrition, wellness, pharmacy, and companion animal care categories.
Geography Analysis
The pet care market share for North America held the largest 33.5% in 2025. This leading position is attributed to high pet ownership rates, advanced veterinary infrastructure, widespread adoption of preventive healthcare services, and substantial consumer spending on premium pet nutrition and wellness products. The region benefits from the expansion of veterinary clinic networks, growing demand for diagnostics and chronic disease management, and increased use of subscription-based pet healthcare services. Additionally, the rising adoption of companion animal insurance and a stronger emphasis on preventive care are driving spending across veterinary services, pharmaceuticals, nutrition, and wellness categories in the United States and Canada.
The Asia-Pacific market size is projected to grow at the fastest CAGR at 9.6% from 2026 to 2031. Urbanization, smaller household sizes, delayed parenthood, and rising disposable incomes are contributing to increased pet ownership in countries such as China, India, Japan, South Korea, and across Southeast Asia. Consumers are allocating more resources to premium nutrition, preventive healthcare, grooming, diagnostics, and wellness services for their pets. Additionally, digital commerce and app-based pet care platforms are enhancing access to products and veterinary consultation services in metropolitan areas. Both domestic and international companies are investing in premium product portfolios and omnichannel distribution strategies to strengthen their presence in the rapidly developing regional pet care markets.
Europe remains a key regional market because of established pet ownership trends, advanced veterinary services, and strong emphasis on preventive care and wellness spending. According to the Association of British Insurers, pet insurance coverage in the United Kingdom reached 4.6 million policies in 2024, compared with 4.4 million policies in 2023, reflecting rising adoption of insurance-backed veterinary care and preventive healthcare services. The region also continues benefiting from strong demand for premium pet nutrition, diagnostics, pharmaceuticals, and wellness products. Subscription-based veterinary services and omnichannel retail expansion are further supporting recurring companion animal healthcare spending across major European markets.
Note: Segment share of all individual segments available upon report purchase

Competitive Landscape
The competitive landscape is moderately consolidated, with key players including Nestlé Purina PetCare Company (Nestlé S.A.), Mars, Incorporated, PetSmart LLC (BC Partners), Zoetis Inc., and Hill’s Pet Nutrition, Inc. (Colgate-Palmolive Company). Companies are increasingly focusing on integrated service models that combine pet food, diagnostics, pharmacy services, insurance, and veterinary care into unified consumer platforms. Key innovation areas include personalized nutrition, artificial intelligence-enabled diagnostics, telehealth services, and preventive healthcare solutions. Additionally, digital engagement and subscription-based purchasing models are emerging as significant competitive differentiators. Strong manufacturing capabilities, robust distribution networks, and veterinary partnerships continue to support the competitive positioning of leading global companion animal care companies.
Technology integration and advancements in preventive healthcare are reshaping the competitive dynamics within the companion animal nutrition and veterinary care industries. Companies are increasingly investing in digital health monitoring, diagnostics, artificial intelligence-driven wellness tools, and personalized feeding solutions to enhance long-term customer engagement. Manufacturers are strengthening their premium nutrition portfolios by incorporating functional ingredients, therapeutic diets, and sustainability-focused product innovations. Veterinary providers are expanding integrated service ecosystems that include diagnostics, pharmacy fulfillment, telemedicine, and subscription care models. Competition is increasingly driven by data capabilities, clinical partnerships, omnichannel distribution reach, and recurring consumer engagement, rather than relying solely on traditional product volume across global pet healthcare markets.
Veterinary clinic expansion and integrated care delivery are emerging as significant competitive factors as companies increasingly link diagnostics, pharmacy services, preventive care, and digital health platforms within companion animal healthcare ecosystems. According to Mars, Incorporated, the company opened a new USD 450 million Royal Canin manufacturing facility in Lewisburg, Ohio, in 2025, with an annual production capacity sufficient to feed approximately 4 million pets. This investment aims to enhance vertically integrated nutrition and healthcare capabilities while improving supply chain efficiency and product availability across North America. Large-scale infrastructure expansion continues to support competitive advantages in manufacturing, distribution, and recurring pet wellness engagement.
Pet Care Industry Leaders
Nestlé Purina PetCare Company (Nestlé S.A.)
Mars, Incorporated
PetSmart LLC (BC partners)
Zoetis Inc.
Hill’s Pet Nutrition, Inc. (Colgate-Palmolive Company)
- *Disclaimer: Major Players sorted in no particular order

Recent Industry Developments
- May 2026: Hill’s Pet Nutrition, Inc. and Bond Pet Foods have received a Letter of No Objection from the United States Food and Drug Administration Center for Veterinary Medicine for Lamb Protein Yeast. This marks the first precision fermentation-derived animal protein to attain Generally Recognized as Safe (GRAS) status for use in dog food.
- April 2026: Chewy, Inc. announced the acquisition of Modern Animal to enhance its integrated pet healthcare ecosystem. This acquisition increased Chewy Vet Care’s network from 18 to 47 clinic locations across the United States and introduced technology-enabled veterinary and virtual care services.
- April 2026: Elanco Animal Health Incorporated introduced the Advantage Collar for Dogs, an over-the-counter product offering four months of continuous protection against fleas, ticks, and mosquitoes.


Research Methodology Framework and Report Scope
Market Definitions and Key Coverage
Our study views the pet care market as all revenue generated from products and services that keep companion animals fed, healthy, groomed, entertained, and insured. This includes packaged food, treats, veterinary medicines, routine veterinary services, grooming and hygiene products, training and boarding services, smart accessories, and pet insurance sold across physical and digital channels worldwide.
Scope Exclusions: livestock feed, equine sports nutrition, and laboratory-animal supplies remain outside this boundary.
Segmentation Overview
- By Product Type
- Pet Food
- Pet Healthcare
- Pet Grooming Products
- Pet Accessories
- Pet Services
- By Animal Type
- Dogs
- Cats
- Others
- By Distribution Channel
- Offline Retail
- Supermarkets and Hypermarkets
- Pet Specialty Stores
- Veterinary Clinics
- Online Retail
- Offline Retail
- By Geography
- North America
- United States
- Canada
- Mexico
- Rest of North America
- South America
- Brazil
- Argentina
- Chile
- Rest of South America
- Europe
- Germany
- United Kingdom
- France
- Italy
- Spain
- Russia
- Rest of Europe
- Asia-Pacific
- China
- Japan
- India
- Australia
- South Korea
- Rest of Asia-Pacific
- Middle East
- Saudi Arabia
- United Arab Emirates
- Turkey
- Rest of Middle East
- Africa
- South Africa
- Egypt
- Rest of Africa
- North America
Detailed Research Methodology and Data Validation
Primary Research
Mordor analysts interviewed veterinarians, specialty retailers, online subscription platforms, and regional distributors across North America, Europe, Asia-Pacific, and Latin America. The conversations tested adoption curves for premium food, tele-health uptake, and average service tickets, which helped us validate secondary numbers and fine-tune model assumptions.
Desk Research
We first gathered baseline figures from public sources such as the American Pet Products Association expenditure survey, USDA animal ownership files, FEDIAF pet population dashboards, Eurostat household spend data, and Japan Pet Food Association statistics, complemented by news archives in Dow Jones Factiva and company 10-K filings. These provided pet population counts, spend per pet, channel splits, and cost indices that anchor the demand pool. D&B Hoovers supplied revenue breakouts that guided price tiers and category shares. The sources listed illustrate our approach and are not exhaustive; many additional datasets were reviewed to confirm trends and fill gaps.
Market-Sizing & Forecasting
A top-down construct converts country pet populations into spend pools through average outlay per dog, cat, fish, or small mammal, which are then reconciled with supplier roll-ups and sampled online ASP × volume checks before finalizing totals. Key variables include pet adoption rates, disposable income per capita, inflation-adjusted product prices, veterinary cost index, and e-commerce share of specialty pet goods. Five-year forecasts rely on exponential smoothing supported by multivariate regression for price and population drivers that our expert panel endorsed. Where channel data were incomplete, sampled retailer panels bridged the gap.
Data Validation & Update Cycle
Outputs move through variance scans against historical spend curves, peer benchmarks, and currency checks, followed by senior analyst review. We refresh every twelve months and trigger interim reruns when mergers, disease outbreaks, or regulatory shifts materially alter demand.
Why Mordor's Pet Care Baseline Earns Trust
Published figures differ because firms pick varied product mixes, channels, and update cadences.
Our disciplined scope, iterative cross-checks, and annual refresh give decision-makers a stable yet timely anchor.
Benchmark comparison
| Market Size | Anonymized source | Primary gap driver |
|---|---|---|
| USD 380 B (2025) | Mordor Intelligence | - |
| USD 273.42 B (2025) | Global Consultancy A | Omits grooming devices and most insurance lines and applies slower premiumization growth |
| USD 200 B (2024) | Trade Journal B | Captures only retail food and accessories, excludes veterinary and services revenue |
| USD 159.1 B (2022) | Industry Association C | Early base year and limited country set with no online channel inflation adjustment |
These contrasts show that when scope narrows or price updates lag, totals swing widely. By capturing the full commercial chain and re-validating every year, Mordor Intelligence delivers a balanced, transparent baseline that planners can replicate and defend.


Key Questions Answered in the Report
How large is the pet care market in 2026 and where is it headed by 2031?
The pet care market stands at USD 260.10 billion in 2026 and is projected to reach USD 361.20 billion by 2031.
Which product area generates the most revenue in pet care?
Pet Food is the largest product category, with a 52.6% market share in 2025.
What is the fastest-growing part of pet care by product type?
Pet Services is the fastest-growing product segment, with a projected 10.0% CAGR from 2026 to 2031.
Which region offers the strongest growth outlook through 2031?
Asia-Pacific has the fastest regional outlook, with a 9.6% CAGR from 2026 to 2031.
Page last updated on:


