Market Overview
| Study Period | 2020 - 2031 |
|---|---|
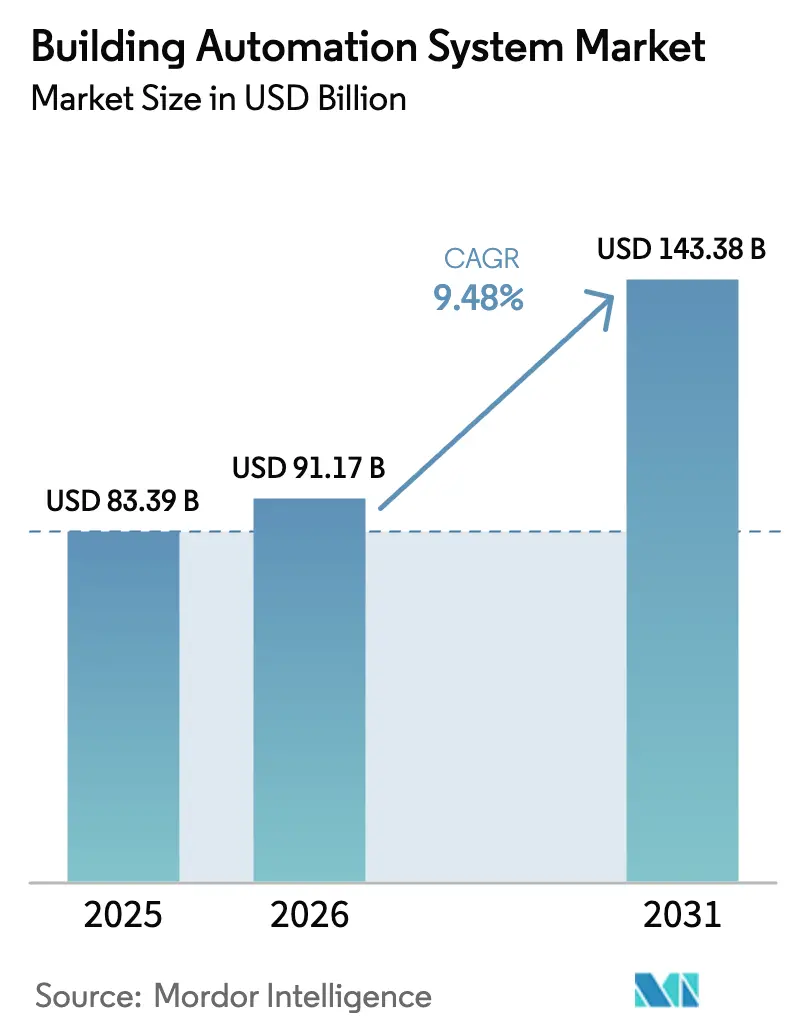
| Market Size (2026) | USD 91.17 Billion |
| Market Size (2031) | USD 143.38 Billion |
| Growth Rate (2026 - 2031) | 9.48% CAGR |
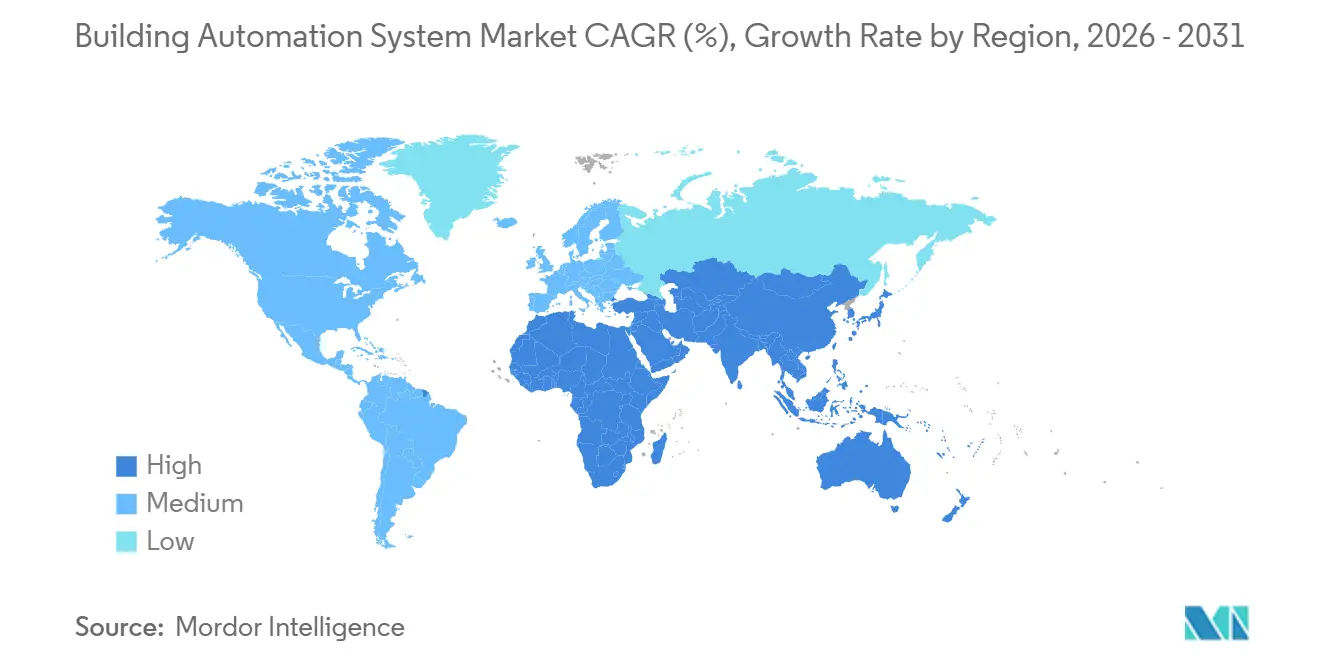
| Fastest Growing Market | Asia Pacific |
| Largest Market | North America |
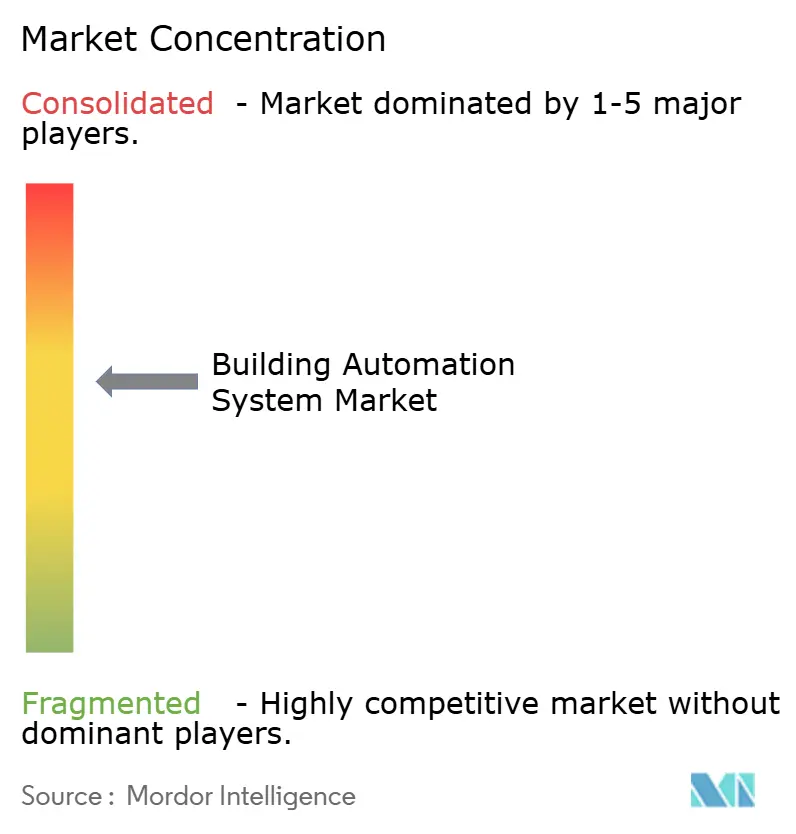
| Market Concentration | Medium |
Major Players *Disclaimer: Major Players sorted in no particular order Image © Mordor Intelligence. Reuse requires attribution under CC BY 4.0. | |
Building Automation System Market Analysis by Mordor Intelligence
The Building automation system market size is projected to expand from USD 83.39 billion in 2025 and USD 91.17 billion in 2026 to USD 143.38 billion by 2031, registering a 9.48% CAGR between 2026 and 2031. Rising regulatory pressure, falling sensor prices, and maturing cloud analytics are turning building controls from isolated HVAC timers into enterprise-wide, data-rich platforms. Facility owners are accelerating retrofits to comply with tighter energy codes, while subscription software models lower the entry barrier for small portfolios. Vendors are bundling predictive analytics that cut service calls and monetize operational data, and utilities are sweetening demand-response programs with higher rebates. The shift from proprietary hardware toward open, secure protocols is setting the stage for broader adoption across commercial, institutional, and even single-family housing stock.
Key Report Takeaways
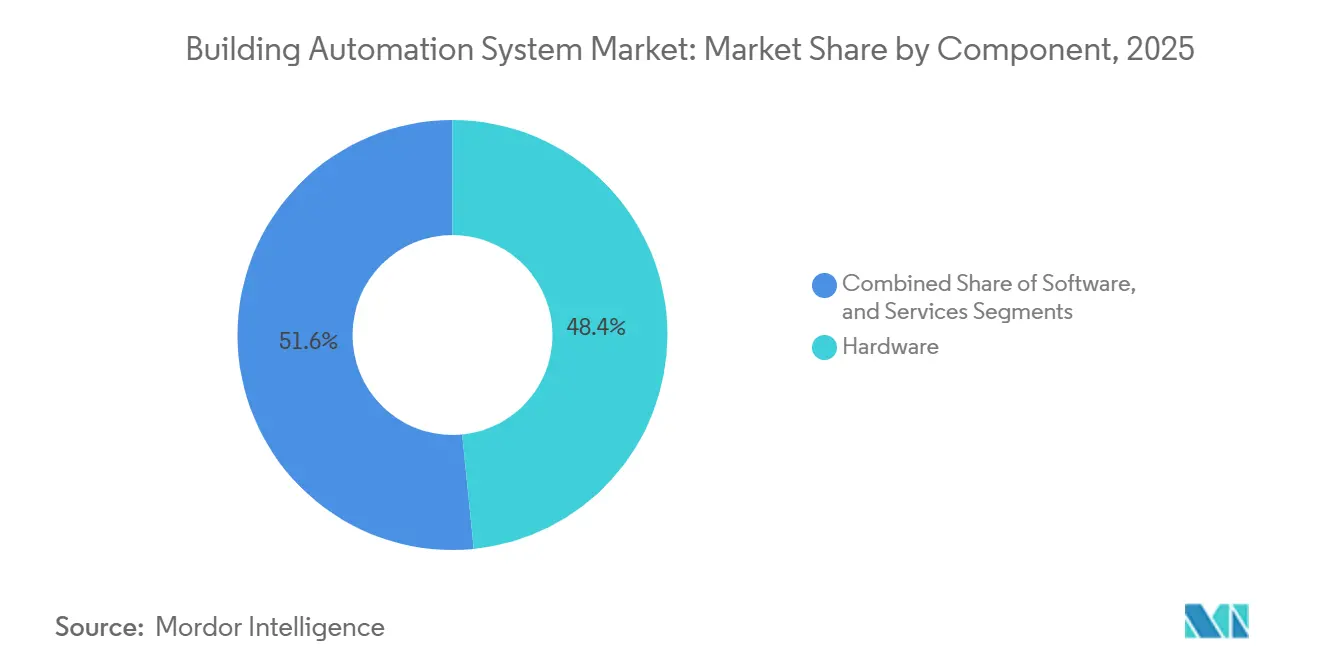
- By component, hardware led with 48.43% revenue share in 2025, while software is advancing at a 10.07% CAGR to 2031.
- By system type, HVAC controls held 38.51% of 2025 revenue; energy management systems are forecast to grow at 10.17% CAGR through 2031.
- By communication technology, wired architectures retained 63.67% of 2025 revenue, yet wireless solutions are registering a 10.11% CAGR.
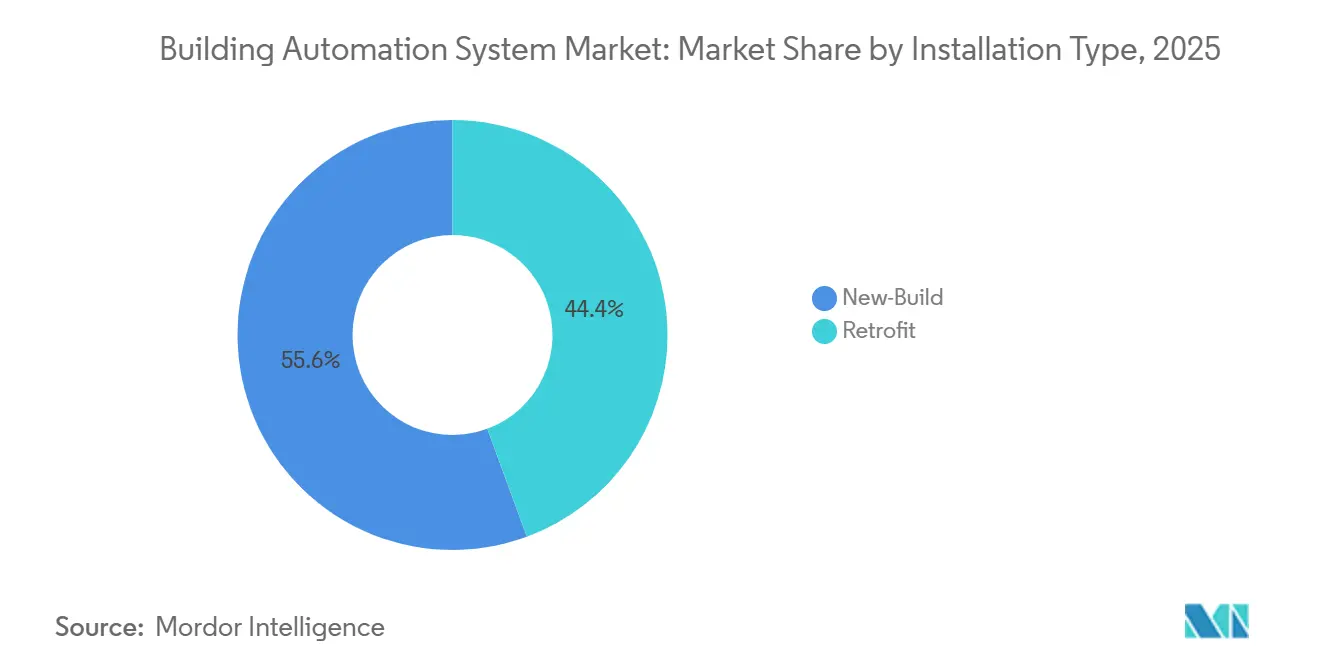
- By installation type, new-build projects commanded 55.63% of 2025 spending, while retrofit deployments are expanding at a 9.88% CAGR.
- By geography, North America captured 34.33% of 2025 revenue, whereas Asia Pacific is the fastest-growing region at a 9.86% CAGR.
Note: Market size and forecast figures in this report are generated using Mordor Intelligence’s proprietary estimation framework, updated with the latest available data and insights as of January 2026.
Global Building Automation System Market Trends and Insights
Drivers Impact Analysis*
| Driver | (~) % Impact on CAGR Forecast | Geographic Relevance | Impact Timeline |
|---|---|---|---|
| Stringent Energy Efficiency Regulations and Green Building Codes | +1.8% | Global, with strongest enforcement in EU, North America, and select APAC markets (Japan, South Korea) | Medium term (2-4 years) |
| Growing Adoption of IoT and Smart Connected Devices | +1.5% | Global, with accelerated uptake in North America, EU, and urban APAC hubs | Short term (≤ 2 years) |
| Demand for Energy Cost Savings and Sustainability Targets | +1.3% | Global, particularly acute in regions with high electricity tariffs (EU, Japan, California) | Long term (≥ 4 years) |
| Proliferation of Smart City Initiatives and Government Incentives | +1.2% | APAC core (China, India), Middle East (UAE, Saudi Arabia), spill-over to Latin America | Medium term (2-4 years) |
| Integration of Digital Twin Technology for Predictive Building Operations | +0.9% | North America and EU early adopters, expanding to APAC commercial real estate | Long term (≥ 4 years) |
| Hybrid Work Models Driving Occupancy-Based Space Optimization | +0.7% | North America and EU commercial office markets, with selective adoption in APAC financial districts | Short term (≤ 2 years) |
| Source: Mordor Intelligence | |||
Stringent Energy Efficiency Regulations And Green Building Codes
Fresh codes are turning energy reduction from a choice into a mandate. The 2024 International Energy Conservation Code tightened HVAC setback and ventilation rules, while Germany’s 2024 Gebäudeenergiegesetz requires automation in non-residential buildings above 1,000 m².[1]International Code Council, “2024 International Energy Conservation Code,” iccsafe.org Buildings that exceed a 70-point Smart Readiness Indicator in early Austrian pilots enjoy 4-7% rental premiums. California’s Title 24 update obliges data centers and retailers to drop 15% of peak load within ten minutes of a grid signal. As certifications such as ISO 52120 gain momentum, insurers and lenders are using automation depth to price green finance, effectively putting a hard dollar value on compliance.
Growing Adoption of IoT And Smart Connected Devices
Low-cost silicon and open APIs are dissolving the premium once attached to sophisticated controls. Matter 1.4 enabled interoperability across 800-plus certified devices, letting managers mix thermostats, lighting, and access badges from multiple brands without middleware.[2]Connectivity Standards Alliance, “Matter 1.4 Release Notes,” csa-iot.org Thread’s mesh network stretches wireless range to 100 m in dense towers, shaving conduit labor by 40% in Singapore pilots. Honeywell’s Azure-enabled Forge platform now predicts failures up to two weeks ahead, cutting unplanned downtime by 25%. Converged Wi-Fi 6E access points with embedded BACnet gateways simplify wiring and make real-time occupancy maps part of corporate IT dashboards.
Demand for Energy Cost Savings And Sustainability Targets
Energy lines swallow 20-30% of an office property’s operating budget, so CFOs are chasing hard savings. A 60-building retrofit in the UAE trimmed consumption 27% and delivered a 3.2-year payback. Digital twins at Dubai World Trade Centre uncovered 8% wastage from simultaneous heating and cooling, saving USD 136,000 a year. Time-of-use tariffs in 18 U.S. states encourage automated load shedding, and rebate streams now offset up to 25% of install costs. Platforms such as Johnson Controls’ OpenBlue routinely drop peak demand 18%, shrinking costly capacity charges.
Proliferation of Smart City Initiatives And Government Incentives
Governments are underwriting risk for first movers. Saudi Arabia’s Diriyah Gate is channeling USD 63.2 billion into BACnet Secure Connect-ready homes and hotels. Japan’s METI is funding pilots that aim for 20% energy cuts via occupancy-based HVAC in three tier-one cities. Horizon Europe awarded EUR 45 million (USD 52.33 million) to BuildON, a 12-site demo that links AI analytics with utility incentives across Spain, Poland, and Greece. Dubai’s AED 7 billion (USD 1.91 billion) smart grid forces buildings over 10,000 m² to enroll in demand response, assuring vendors of a steady retrofit pipeline. China’s latest five-year plan earmarks USD 69 billion for smart-city spending, 12% of which is headed for automation hardware and software.
Restraints Impact Analysis*
| Restraint | (~) % Impact on CAGR Forecast | Geographic Relevance | Impact Timeline |
|---|---|---|---|
| High Upfront Capital Expenditure and Long Payback Periods | -0.8% | Global, with acute impact in cost-sensitive markets (Latin America, Southeast Asia, Africa) | Short term (≤ 2 years) |
| Lack of Interoperable Standards Across Legacy Systems | -0.6% | North America and EU markets with aging building stock; emerging in APAC retrofit projects | Medium term (2-4 years) |
| Escalating Cybersecurity and Data Privacy Concerns Delaying Projects | -0.5% | Global, with heightened scrutiny in regulated sectors (healthcare, government, finance) | Short term (≤ 2 years) |
| Shortage of Skilled BAS Commissioning Professionals | -0.4% | North America and EU labor markets; emerging constraint in APAC as adoption scales | Medium term (2-4 years) |
| Source: Mordor Intelligence | |||
High Upfront Capital Expenditure And Long Payback Periods
Comprehensive retrofits can cost USD 8-15 per ft², pushing a 100,000-ft² office into a USD 1 million outlay that many landlords struggle to finance.[3]U.S. Department of Energy, “Commercial Building Integration,” energy.gov European studies show EUR 10 per m² spend with four-year paybacks in subsidized-electricity zones such as Poland. Smaller owners lack access to green loans, and ROI calculations wobble with changing tariffs and weather. Pay-for-performance contracts shift capex to vendors but add legal complexity that cautious managers resist.
Lack Of Interoperable Standards Across Legacy Systems
Building stock riddled with pneumatic dampers and proprietary protocols inflates commissioning hours. BACnet rules 77% of new installs but older BACnet/IP devices lack encryption, so integrators bolt on gateways costing USD 5,000-15,000 per site. Matter remains largely residential, and Modbus, KNX, and LonWorks still anchor many European campuses. Bridging old and new exposes control networks to ransomware, driving demand for IEC 62443 compliance that can extend schedules by up to a year.
*Our forecasts treat driver/restraint impacts as directional, not additive. The impact forecasts reflect baseline growth, mix effects, and variable interactions.
Segment Analysis
By Component: Software Monetization Reshapes Revenue Mix
Software is recording a 10.07% CAGR through 2031 as vendors transition from one-time licenses to recurring subscriptions that monetize fault detection and energy benchmarking. Supervisory suites now embed reinforcement-learning modules that optimize chiller staging and flag valve drift before comfort complaints arise. Schneider Electric’s EcoStruxure, active in 480,000 sites, charges at USD 0.05-0.15 per ft² monthly, turning the installed base into an annuity. Hardware still dominates the Building automation system market share at 48.43% in 2025 because sensors and controllers remain mandatory, yet commoditization is eroding margins. Services are steady mid-single-digit growers as remote diagnostics lessen the need for on-site truck rolls.
The Building automation system market size attached to software is projected to grow sharply because cloud hosting sidesteps server procurement costs. Vendors bundle multiyear analytics contracts with every new controller, aligning incentives to cut a facility’s utility bills. Independent integrators that master both IT and OT domains are filling skill gaps, charging premium day rates to stitch third-party sensors into vendor dashboards. Over the forecast horizon, software’s higher gross margin will nudge corporate valuations, spurring more tuck-in acquisitions of AI startups.


By System Type: Energy Management Outpaces Legacy HVAC Control
HVAC controls, at 38.51% revenue share in 2025, remain the backbone of the Building automation system market, but energy management modules are racing ahead at a 10.17% CAGR. Utilities in 18 U.S. states now dispatch five-minute price signals, and automated response can shave 15-25% of a site’s bill. Lighting controls are shifting from calendar-based dimming to sensor-driven daylight harvesting, especially in glass-heavy towers. Security, access, and life-safety platforms are converging, enabling a fire alarm to cue HVAC smoke purge and unlock exits simultaneously, as stipulated by NFPA 72.
As boundaries blur, integrated dashboards give facility managers a single view of thermal loads, kWh spend, and occupant counts. That convergence is redefining building controls from “HVAC plus extras” into holistic operational technology stacks. The Building automation system market size for energy management tools will keep expanding as CFOs link emissions disclosures to executive compensation, pushing analytics from plant rooms into the boardroom. Vendors offering modular add-ons rather than forklift upgrades are winning retrofits, and SaaS pricing lets customers start with power metering and layer on lighting or security later.
By Communication Technology: Wireless Shrinks Labor Costs And Bolsters Cybersecurity
Wired backbones held 63.67% revenue in 2025, yet wireless protocols are gathering pace at a 10.11% CAGR because they slash retrofit labor. Thread pilots in Singapore clocked 99.9% uptime, equaling wired reliability while cutting installation times by 40%. BACnet Secure Connect, standardized as ISO/IEC 17543-5 in 2024, adds TLS 1.3 encryption over Ethernet or Wi-Fi, satisfying risk officers who previously blocked air-wave traffic. Wi-Fi 6E’s 6 GHz spectrum enables controls to hitch a ride on corporate LANs, eliminating standalone gateways and their maintenance burden.
Wireless wins biggest in brownfield sites where core drills and ceiling chase work disrupt tenants. The Building automation system market share tilt toward wireless will widen as battery-powered sensors reach five-year lifespans, making “stick-ons” a viable option for leased offices. Still, mission-critical labs and hospitals will favor deterministic wired loops for life-safety zones. Hybrid topologies that combine Power-over-Ethernet spines with Thread edge nodes are emerging as the default architecture.
By Installation Type: Retrofits Close The Gap With New Construction
New-build automation enjoys inherent design synergies and commanded 55.63% of 2025 spend, yet retrofit work is accelerating at a 9.88% CAGR as aging assets face disclosure laws. Europe’s Renovation Wave funnels EUR 150 billion (USD 174.44 billion) into upgrades by 2030, with building controls set to absorb 8-12%. In the United States, Title 24 revisions require existing big-box retail to implement fast shed capabilities, making load controllers a compliance purchase rather than an energy-only play.
Wireless mesh and cloud commissioning cut retrofit timelines from 12 weeks to under five for mid-size offices. Performance contracts that guarantee savings are spreading, letting owners book off-balance-sheet upgrades. As regulations ratchet downward on allowable carbon, the Building automation system market size allocated to retrofits will keep swelling, helped by falling sensor costs and turnkey financing bundles from utilities and ESCOs.
By End User: Residential Unlocks Growth Beyond Commercial Strongholds
Commercial estates still generated 46.83% of 2025 revenue, driven by tenant wellness demands and green-lease clauses. Yet the residential slice is projected to grow at a 9.96% CAGR thanks to the Matter protocol, which removes the app-per-device chaos that repelled homeowners. Utility rebates of USD 50-300 for smart thermostats shorten payback to under two years in 12 EU members and 18 U.S. states. Voice assistants dominate front-end control, with Alexa, Google Assistant, and Apple HomeKit holding 85% penetration in North America by 2025.
Industrial sites are layering ISO 50001 audits onto automation rollouts, and government campuses are chasing net-zero mandates despite procurement red tape. The Building automation system market share uplift in residential will be limited by smaller ticket sizes, but volume potential is vast, and security-minded homeowners value unified lighting, HVAC, and intrusion alerts. Vendors that package starter kits under USD 500 are tapping a long-tail opportunity previously locked out by complex commissioning.
Geography Analysis
North America captured 34.33% of 2025 revenue, buoyed by the 2024 IECC and upcoming Title 24 updates that hard-wire automation into compliance checklists. ASHRAE 90.1-2022 promises 8.9% energy savings over the 2019 baseline, pushing corporate campuses to modernize chilled-water plants. Canada’s National Energy Code mandates controls for buildings above 3,000 m², and municipal incentives in Toronto cover up to 25% of project costs. Mexico lags due to lower tariffs but is seeing automation embedded in new near-shore factories to satisfy parent-company ESG audits. Labor shortages in commissioning trades remain a bottleneck, stretching timelines and propping up service rates.
Asia Pacific is the fastest-growing territory at a 9.86% CAGR. China’s five-year plan steers USD 69 billion toward smart-city layers, reserving roughly 12% for building controls in Beijing, Shanghai, and Shenzhen.[4]National Development and Reform Commission of China, “14th Five-Year Plan for Smart City Development,” ndrc.gov.cn India’s Smart Cities Mission mandates automation for government and commercial properties over 10,000 m², while Japan funds pilots that target 20% savings through occupancy-based HVAC. Australia’s 2025 National Construction Code embeds automation in commercial buildings above 2,000 m², and Singapore’s Green Mark raises resale values for rated properties. Fragmented supply chains and divergent local standards, however, create go-to-market complexity.
Europe enjoys strong policy tailwinds. The EPBD recast forces Building Automation and Control Systems in non-residential sites over 290 kW by 2024, dropping to 70 kW by 2029. France requires installation by January 2025, and Germany can fine laggards EUR 50,000 (USD 58,145.62) per property. Horizon Europe subsidies accelerate demos in Spain, Poland, and Greece, while the Smart Readiness Indicator links automation depth to property valuation. Eastern Europe trails due to subsidy electricity and limited green financing, yet cohesion funds of EUR 10 billion (USD 11.63 billion) through 2027 are earmarked for energy retrofits.
The Middle East shows outsized momentum. Dubai’s AED 7 billion (USD 1.91 billion) smart-grid blueprint mandates building-level response for structures above 10,000 m², baking demand into the pipeline. Siemens’ retrofit of 60 UAE buildings confirmed a 27% energy cut and sub-four-year payback, setting proof points for neighbors. Saudi Arabia’s Diriyah Gate channels USD 63.2 billion into BACnet Secure Connect deployments, aiming for 40% grid automation by 2025. South America and Africa remain nascent; Brazil’s PROCEL Edifica and South Africa’s tax incentives pick up the slack in major metros but lack nationwide impetus.

Competitive Landscape
The Building automation system market is moderately concentrated; Honeywell, Siemens, Johnson Controls, Schneider Electric, and ABB together hold a major share of revenue through installed-base lock-in and multiyear service wraps. These incumbents are pivoting hard into software subscriptions. Honeywell’s Forge and Siemens’ Building X embed AI models that convert mechanical data into recurring revenue rather than one-off controller sales. Schneider’s EcoStruxure bundles analytics with every panel, while Johnson Controls prices OpenBlue on performance contracts tied to energy savings.
Challengers such as Distech Controls, Delta Controls, and Crestron court customers tired of proprietary ecosystems, offering open HTTP and BACnet/SC APIs that let IT teams self-serve dashboards. Network vendors like Cisco and Hubbell blur lines by integrating BACnet gateways into switches, collapsing two boxes into one, and cutting capex by USD 8,000-15,000 per mid-rise. Cybersecurity crushes verdict weightings in RFPs; IEC 62443-certified gear commands price premiums, especially in hospitals and finance. Venture-backed startups push digital twins, but scale favors firms with service fleets able to guarantee uptime.
Residential retrofits represent fresh white space. Matter-compliant thermostats and dimmers from Lutron, Legrand, and Leviton democratize controls for homeowners unwilling to pay for integrators. Subscription monitoring mirrors the smart-security playbook, hinting at annuity upside for brands that capture early mindshare. As SaaS margins outstrip hardware, expect further M&A as conglomerates buy analytics boutiques to lift blended gross margin.
Building Automation System Industry Leaders
Honeywell International Inc.
Siemens AG
Johnson Controls International plc
Schneider Electric SE
ABB Ltd
- *Disclaimer: Major Players sorted in no particular order

Recent Industry Developments
- March 2026: Johnson Controls pledged USD 200 million to scale OpenBlue AI across 5,000 UAE buildings by 2028, partnering with DEWA to enable automated peak-load curtailment.
- February 2026: Schneider Electric bought a German analytics firm for EUR 120 million (USD 129 million) to cut HVAC failures 30% across European retrofits.
- February 2026: Siemens debuted Building X Pro with generative AI queries, rolling out to 200 pilot sites in Germany and the United States.
- January 2026: Honeywell won a USD 85 million Saudi contract to retrofit 150 government buildings with BACnet Secure Connect controls.


Research Methodology Framework and Report Scope
Market Definitions and Key Coverage
Our study defines the building automation system (BAS) market as the aggregate value of hardware, supervisory software, cloud extensions, and recurring onsite services that monitor, control, and optimize HVAC, lighting, energy, fire-life-safety, and security subsystems across residential, commercial, industrial, and institutional buildings. According to Mordor Intelligence analysts, revenues linked to installation labor, integration middleware, and lifecycle retrofit kits are counted because they are inseparable from functional BAS delivery.
Scope exclusion: Purely consumer-grade smart speakers, DIY cameras, and other gadgets that never interface with a building-wide controller are left out.
Segmentation Overview
- By Component
- Hardware
- Controllers
- Sensors and Field Devices
- Actuators
- Other Hardware Components
- Software
- Supervisory / Management Software
- Analytics / Energy Management Software
- Services
- Installation
- Maintenance and Support
- Hardware
- By System Type
- HVAC Control Systems
- Lighting Control Systems
- Security and Access Control Systems
- Video Surveillance System
- Access Control Systems
- Card / RFID Access
- Biometric Access
- Energy Management Systems
- Fire and Life-Safety Systems
- By Communication Technology
- Wired
- Wireless
- By Installation Type
- New-Build
- Retrofit
- By End User
- Residential
- Commercial
- Industrial
- Institutional / Government
- By Geography
- North America
- United States
- Canada
- Mexico
- South America
- Brazil
- Argentina
- Europe
- Germany
- United Kingdom
- France
- Rest of Europe
- Asia Pacific
- China
- Japan
- India
- Rest of Asia Pacific
- Middle East
- United Arab Emirates
- Saudi Arabia
- Rest of Middle East
- Africa
- South Africa
- Rest of Africa
- North America
Detailed Research Methodology and Data Validation
Primary Research
Our analysts interviewed BAS integrators, facility managers, MEP consultants, and IoT chipset vendors across North America, Europe, the Gulf, and Asia-Pacific. The conversations verified typical controller margins, retrofit penetration rates, and cloud-service attach rates, filling gaps that documents leave open.
Desk Research
We began with public datasets such as the US Department of Energy CBECS tables, Eurostat building stock indicators, and UNEP's Global Status Report, which anchor floor-area and energy-use baselines. Trade bodies, including BACnet International, CIBSE, and BSRIA, offered shipment, protocol adoption, and cost benchmarks. Company 10-Ks, green-bond prospectuses, and major facility management contractors' filings helped our team sense-check price dispersion for controllers and field devices.
Subscription resources, D&B Hoovers for OEM financials, Dow Jones Factiva for deal flow, and Questel for patent velocity, supplied additional sanity checks on competitive intensity. These examples are illustrative; many other open and paid sources informed desk validation.
Market-Sizing & Forecasting
A top-down build combined global floor-area stock with penetration and average-spend curves, reconstructed from construction completions, renovation cycles, and equipment replacement data, which are then aligned to regional energy-efficiency mandates. Select bottom-up checks, sampled supplier revenue roll-ups and channel ASP × volume snapshots, validated totals before adjustments. Key variables in our model include new-build completions, retrofit share of floor area, wired-to-wireless protocol mix, average project labor hours, and service contract renewal ratios. Multivariate regression links these drivers to historic BAS outlays, while scenario analysis stresses energy-price shocks and incentive rollbacks. Where bottom-up gaps surfaced, we interpolated using proxy ratios guided by expert interviews.
Data Validation & Update Cycle
Outputs pass variance tests against independent energy-intensity trends, customs codes, and public earnings. Findings move through multi-analyst review rounds, and we refresh each model annually or sooner if policy or merger events materially shift baselines.
Why Mordor's Building Automation Systems Baseline commands reliability
Published estimates often diverge because each publisher makes unique calls on what counts as a BAS sale, how quickly retrofit waves occur, and which currencies underpin averages.
Key gap drivers include narrower subsystem scope by some publishers, their exclusion of integration labor and multi-year service fees, conservative retrofit timing, and less frequent currency and inflation updates.
Benchmark comparison
| Market Size | Anonymized source | Primary gap driver |
|---|---|---|
| USD 202.29 B (2025) | Mordor Intelligence | - |
| USD 101.74 B (2025) | Global Consultancy A | Omits post-install services and most residential retrofits; equipment revenues only |
| USD 87.85 B (2025) | Industry Publisher B | Counts HVAC, lighting, and software only; security and fire-life-safety left out; minimal integration labor |
The comparison shows that when variable selection, refresh cadence, and service-inclusive scope are aligned, Mordor's balanced methodology yields a transparent, decision-ready baseline clients can replicate with clear inputs and repeatable steps.


Key Questions Answered in the Report
What is the projected value of the building automation system market in 2031?
The market is forecast to reach USD 143.38 billion by 2031, expanding at a 9.48% CAGR from 2026.
Which component is growing fastest within building controls?
Software is the fastest, registering a 10.07% CAGR as vendors pivot to subscription analytics.
Why are wireless protocols gaining share in commercial buildings?
Thread, BACnet Secure Connect, and Wi-Fi 6E cut retrofit labor 40% and now satisfy enterprise cybersecurity requirements.
How do energy regulations impact investment decisions?
Codes such as the 2024 IECC and Europe’s EPBD make automation mandatory in larger buildings, accelerating retrofit paybacks.
Which region will add the most new revenue through 2031?
Asia Pacific, led by China and India, is set to grow at 9.86% CAGR on the back of urbanization and smart-city funding.
What is the main barrier for small building owners?
High upfront capital of USD 8–15 per ft² and paybacks over three years deter many small and mid-sized facilities.
Page last updated on:


