US Warehouse Management System Market Size and Share
Market Overview
| Study Period | 2019 - 2030 |
|---|---|
| Forecast Data Period | 2025 - 2030 |
| Historical Data Period | 2019 - 2023 |
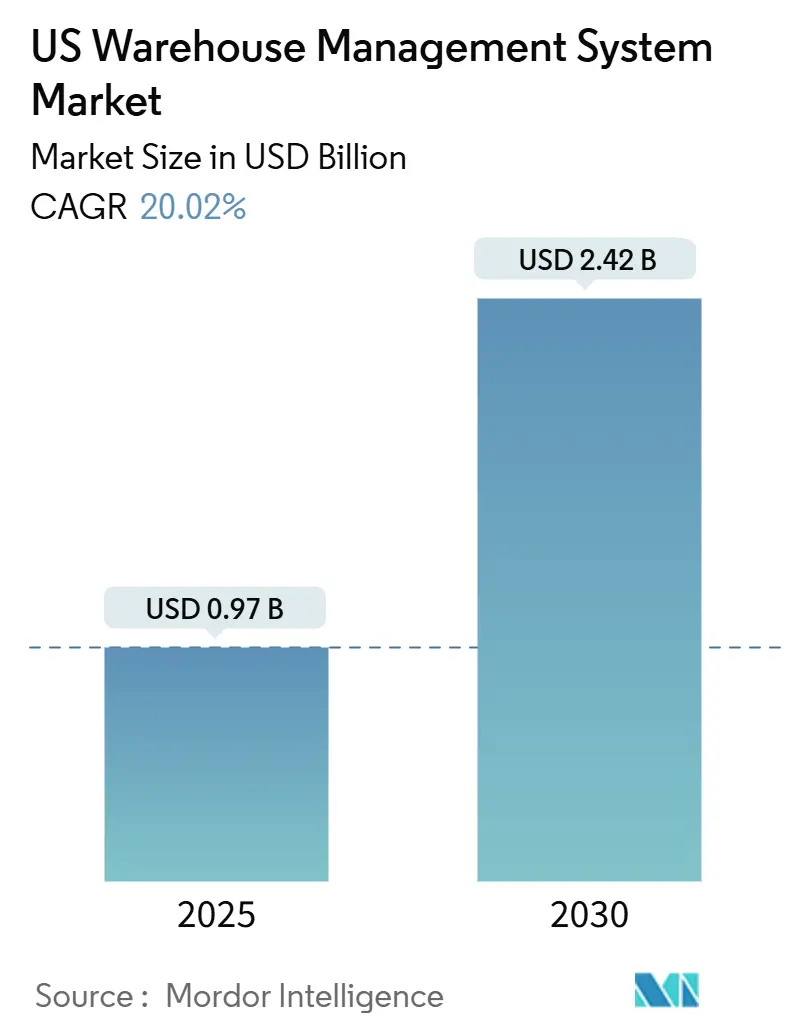
| Market Size (2025) | USD 0.97 Billion |
| Market Size (2030) | USD 2.42 Billion |
| Growth Rate (2025 - 2030) | 20.02% CAGR |
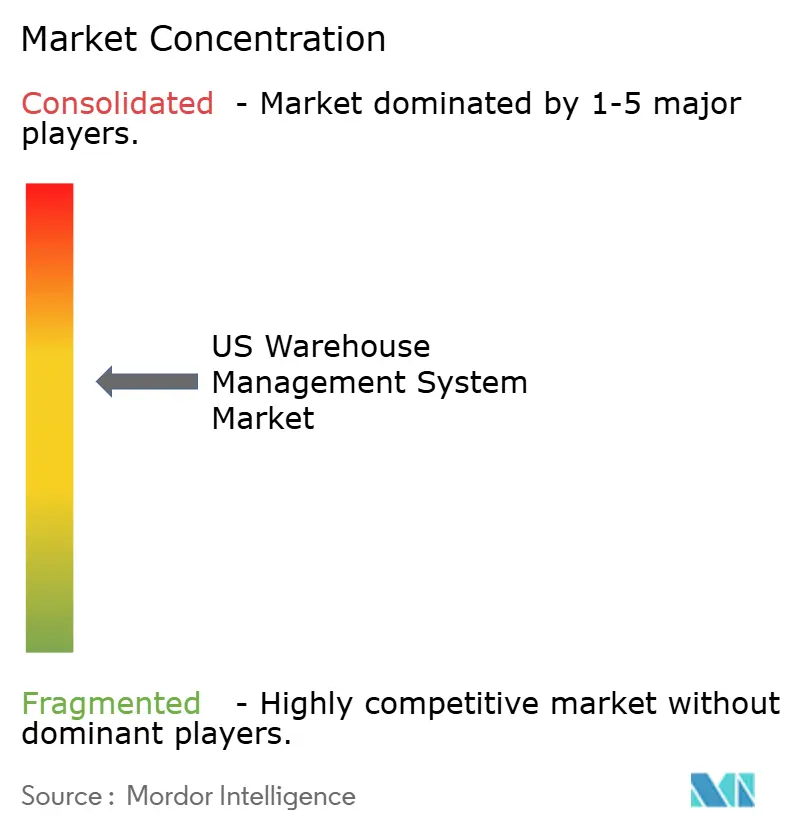
| Market Concentration | Medium |
Major Players *Disclaimer: Major Players sorted in no particular order Image © Mordor Intelligence. Reuse requires attribution under CC BY 4.0. | |
US Warehouse Management System Market Analysis by Mordor Intelligence
The US Warehouse Management System market size is USD 0.97 billion in 2025 and is projected to reach USD 2.42 billion by 2030, posting a robust 20.02% CAGR during the forecast period. Escalating labor shortages, intensifying e-commerce velocity targets, and tightening federal traceability mandates are steering warehouse operators toward software-centric automation that compresses cycle times and lifts inventory accuracy.[1]Marina Mayer, “76% of Supply Chain, Logistics Operations Experiencing Notable Workforce Shortages,” Food Logistics, foodlogistics.com More than 76% of logistics facilities report workforce deficits, prompting companies to adopt robotics-ready WMS platforms that enable fewer employees to handle the increasing throughput. A USD 9 billion construction pipeline for distribution space 25% driven by Amazon, adds fresh demand for cloud-native solutions that can go live before buildings receive their first pallets. Competitive intensity remains moderate as legacy enterprise vendors contend with AI-focused entrants, while regional dynamics reveal the South commanding the largest installed base and the West growing fastest on the back of port modernization.
Key Report Takeaways
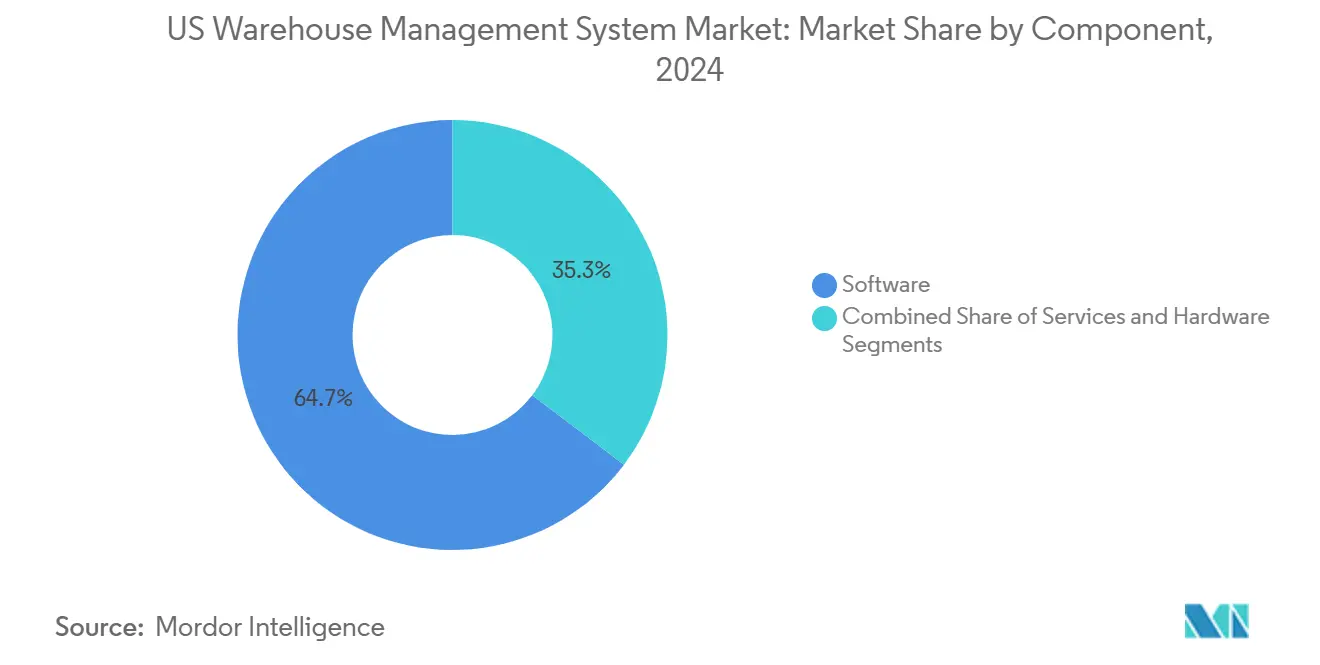
- By component, software led with a 64.7% share of the US Warehouse Management System market in 2024, whereas services are advancing at a 22.31% CAGR through 2030.
- By deployment, cloud captured 58.8% of the 2024 spend of the US Warehouse Management System market, and hybrid is on track for a 22.26% CAGR to 2030.
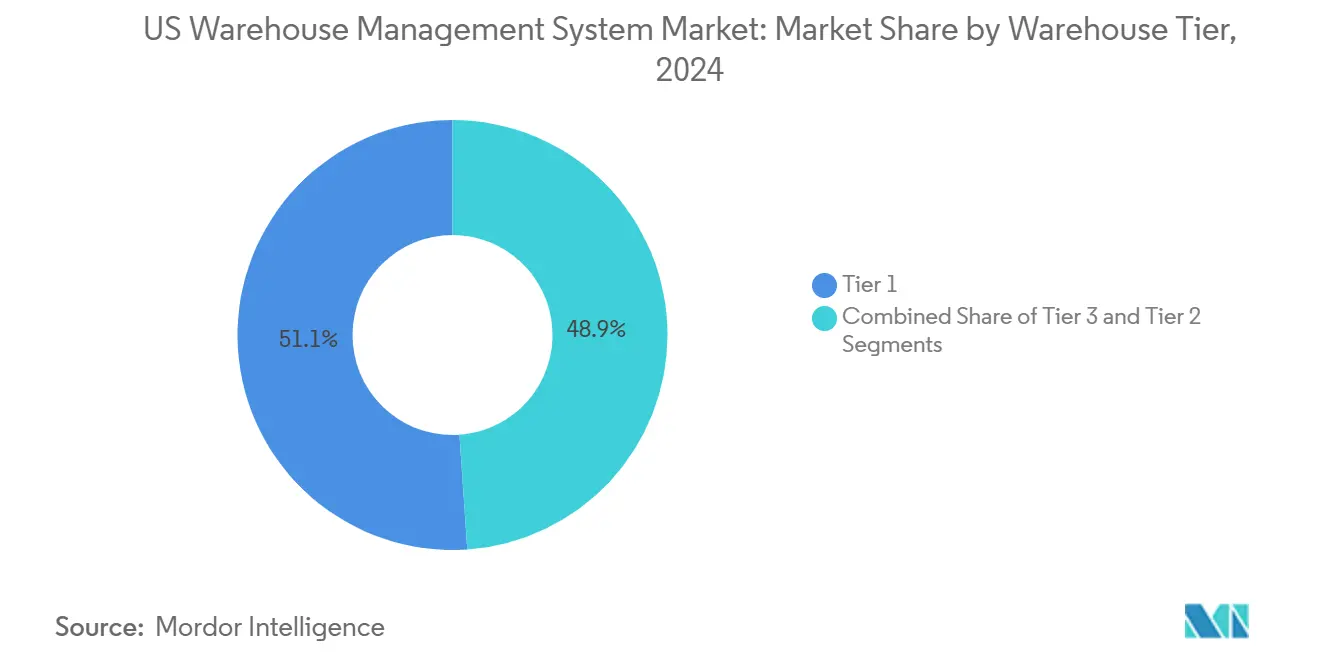
- By warehouse tier, Tier 1 facilities held 51.1% of the 2024 US Warehouse Management System market share, while Tier 3 stockrooms are set to expand at 22.8% CAGR.
- By end-user industry, retail and e-commerce accounted for 35.02% of the 2024 revenue of the US Warehouse Management System market, while pharmaceuticals registered the fastest pace at a 23.31% CAGR.
- By region, the South commanded 38.77% of the 2024 value of the US Warehouse Management System market, but the West is forecast to grow at 22.1% CAGR through 2030.
Worldwide, activity is shaped by contributions from multiple countries and regions, with United states representing one among them. The global report on warehouse management system (wms) market by Mordor Intelligence reflects how these countries and regional layers combine into a single system.
US Warehouse Management System Market Trends and Insights
Drivers Impact Analysis*
| Driver | (~) % Impact on CAGR Forecast | Geographic Relevance | Impact Timeline |
|---|---|---|---|
| Rising adoption of cloud-based WMS among small and midsize warehouses | +3.8% | National; strongest in West and South | Medium term (2-4 years) |
| Labor shortage driving automation-friendly WMS | +4.2% | Nationwide; acute in Northeast and Midwest | Short term (≤ 2 years) |
| E-commerce fulfillment velocity requirements | +3.5% | Nationwide; focused on last-mile metro hubs | Short term (≤ 2 years) |
| Integration with robotics and IoT platforms | +3.1% | Tier 1 distribution centers across all regions | Medium term (2-4 years) |
| Mandates for food and pharma traceability | +2.9% | FDA-regulated facilities nationwide | Short term (≤ 2 years) |
| AI-driven predictive analytics for inventory optimization | +2.5% | Early adoption in West and Northeast | Long term (≥ 4 years) |
| Source: Mordor Intelligence | |||
Rising Adoption of Cloud Based WMS Among Small and Midsize Warehouses
Cloud architecture is redefining cost structures for facilities under 200,000 sq ft by shifting expenditure from capital budgets to subscription fees.[2]Savills Research, “State of the U.S. Industrial Market Q1 2024,” savills.us Operators gain rapid scalability to handle seasonal container-volume swings that rose 12.4% year over year, allowing them to flex compute resources without new servers. These cloud offerings now bundle cybersecurity, disaster recovery, and continuous feature releases, closing the capability gap with Tier 1 distribution centers. Vendors report implementation windows under 90 days, a fraction of on-premise timelines, which hastens payback periods. As parcel carriers raise peak-season surcharges, small warehouses increasingly rely on cloud WMS to orchestrate zone-skipping strategies that trim transportation spend.
Labor Shortage Driving Automation Friendly WMS
Fifty-six percent of supply-chain leaders cite warehouse staffing shortfalls, prompting swift investment in software that can orchestrate goods-to-person automation and voice-directed picking.[3]Suparna Chawla, “Workforce Shortages in Supply Chain,” SAPinsider, sapinsider.org Modern platforms embed task-interleaving algorithms that boost picks per labor hour and cut travel distance, letting a lean workforce maintain customer-promised ship dates. Manufacturers face a projected 1.9 million unfilled roles by 2033, creating spill-over pressure on adjacent distribution sites. As a result, feature roadmaps emphasize low-code configuration, robotic-API libraries, and intuitive mobile UIs that reduce onboarding time for temporary workers. Companies embracing these tools report double-digit improvements in employee retention because monotonous tasks shift to machines.
E-Commerce Fulfillment Velocity Requirements
Same-day delivery commitments demand slotting engines that position high-turn SKUs nearest pack stations and autonomously reroute waves as order backlogs swell. The United States added 413 million sq ft of big-box logistics space in 2023, much of it pre-leased to food, beverage, and online operators who expect built-in WMS connectivity. Machine-learning modules forecast order profiles, balancing pallet, case, and each-picking zones to avoid downstream bottlenecks. Integration with transportation-management systems enables dynamic carrier selection that factors in cut-off times and fuel surcharges, shaving final-mile cycles. As urban micro-fulfillment sites proliferate, multi-node inventory awareness becomes essential to prevent overselling and split shipments, reinforcing WMS as the nervous system of omnichannel networks.
Integration with Robotics and IoT Platforms
The funding of USD 80 million for autonomous-inventory robotics provider Dexory underscores investor confidence in WMS-centric automation ecosystems. Retailers such as Walmart have validated dock-level autonomy by inking multi-year agreements with Fox Robotics forklifts that sync directly to existing slotting rules. Modern WMS vendors now expose event-driven microservices that broadcast work queues to AMRs, AS/RS cranes, and pallet shuttles in real time. IoT sensors feed temperature, vibration, and dwell-time data back into the WMS, enabling predictive maintenance and dynamic task reprioritization. These closed-loop feedback circuits elevate throughput while ensuring compliance with stringent pharma-grade environmental tolerances.
Restraints Impact Analysis*
| Restraint | (~) % Impact on CAGR Forecast | Geographic Relevance | Impact Timeline |
|---|---|---|---|
| High initial implementation and integration costs | -3.2% | Nationwide; toughest for small-to-medium enterprises | Short term (≤ 2 years) |
| Cybersecurity and data-privacy concerns | -2.8% | All regions; heightened in regulated verticals | Medium term (2-4 years) |
| Legacy-system dependence in 3PL networks | -2.1% | Established logistics hubs in Northeast and Midwest | Medium term (2-4 years) |
| Shortage of skilled IT workforce in warehousing sector | -2.5% | Nationwide; severe in secondary markets | Long term (≥ 4 years) |
| Source: Mordor Intelligence | |||
High Initial Implementation and Integration Costs
Total cost of ownership rises quickly when software licenses converge with automation hardware, middleware connectors, and staff retraining. Facility-construction expenses have climbed 38% since pre-pandemic peaks, leaving thinner capital buffers for technology deployments. Many mid-market operators underestimate data-migration complexity, particularly when custom barcode schemas and home-grown inventory files need conversion. After go-live, recurring upgrade and support contracts add incremental pressure, prompting some firms to postpone projects or restrict scope. Financing options such as subscription-plus-services bundles are emerging to ease uptake, yet sticker shock remains a deterrent for cash-constrained businesses.
Cybersecurity and Data Privacy Concerns
As warehouses network PLCs, robots, and handhelds over Wi-Fi and 5G, attack surfaces broaden for ransomware and IP theft. WMS databases store supplier contracts, SKU recipes, and customer personally identifiable information that can fetch premium prices on dark-web exchanges. Recent headline cyberattacks on logistics firms illustrate how a single compromised API can propagate across partner ecosystems, freezing inbound receipts and outbound orders. Compliance frameworks now mandate multi-factor authentication, intrusion detection, and end-to-end encryption, layering cost and complexity onto implementations. Shortage of qualified security engineers exacerbates the risk, with many facilities relying on managed-service providers to monitor threats around the clock.
*Our forecasts treat driver/restraint impacts as directional, not additive. The impact forecasts reflect baseline growth, mix effects, and variable interactions.
Segment Analysis
By Component: Software Dominance Amid Services Surge
Software modules generated USD 0.63 billion in 2024, equal to a 64.7% slice of the US Warehouse Management System market size, underpinned by demand for advanced wave planning, labor management, and slotting engines. Services, while smaller in absolute value, are sprinting at 22.31% CAGR as clients seek configuration, robotic integration, and continuous improvement assistance. Enterprises acknowledge that successful rollouts depend as much on process re-engineering and data governance as on code, driving consulting fees higher. Hardware RF terminals, conveyor controls, and IoT sensors remain essential, especially where automated storage and retrieval systems interface with software to orchestrate pallet and case flows. Providers have responded by bundling lifecycle services from blueprint through hyper-care, ensuring systems evolve with business needs rather than stagnate after go-live.
The rising share of services is tied to the complexity of hybrid deployments that must straddle cloud microservices and on-premise conveyor PLCs. Pharmaceutical clients request validation protocols and 21 CFR Part 11 documentation, further inflating professional-services demand. Retailers rolling out micro-fulfillment now require rapid site replication, leaning on service teams to clone configuration templates across networks. To prevent project creep, many vendors offer outcome-based contracts pegged to put-away accuracy or order-cycle metrics, aligning incentives with customer ROI. As AI features mature, post-implementation advisory work on data-model training and continuous optimization will solidify services as a structural growth pillar over the forecast horizon.


By Deployment: Cloud Leadership with Hybrid Momentum
Cloud accounted for 58.8% of 2024 revenue, demonstrating user confidence in outsourced infrastructure, automatic scaling, and evergreen updates. Enterprises on cloud platforms report go-lives 30% faster than on-premise alternatives because hardware procurement and data-center buildouts vanish from the critical path. Yet the fastest clip belongs to hybrid, set to record a 22.26% CAGR as firms retain local control for latency-sensitive automation while offloading analytics and reporting to the cloud. This arrangement satisfies pharmaceutical data-residency rules and preserves real-time response when thousands of robotic calls hit the system each second.
On-premise remains viable where low-latency access and deterministic uptime trump other considerations for defense contractors, cold-chain operators, and firms with sunk capital in private data centers. However, upgrade fatigue and cybersecurity concerns are nudging even conservative players toward cloud adjuncts for non-transactional workloads. Vendors increasingly design identical APIs across deployment modes, letting clients switch hosting patterns without recoding integrations. As 5G private networks spread inside warehouses, hybrid topologies will gain favor, positioning the cloud as analytics brain and on-premise as execution spine.
By Warehouse Tier: Tier 1 Scale Meets Tier 3 Growth
Tier 1 centers housing more than 50,000 SKUs generated 51.1% of 2024 revenue, reflecting their capital heft and the functional breadth required to support omnichannel demands. These facilities embrace complex order streaming, yard-management integration, and carrier-label certification, thereby inflating license values. Yet Tier 3 stockrooms under 10,000 SKUs are on course for a 22.8% CAGR, signaling democratization of WMS as subscription pricing lowers barriers. Cloud templates allow a two-person IT team to deploy enterprise-grade features once reserved for big-box operations, including AI slotting and voice picking, leveling the competitive footing.
Tier 2 regional hubs act as technology test beds; companies often pilot automation and AI algorithms here before rolling them into flagship mega-sites. They also provide disaster-recovery capacity, making real-time data replication and multi-site inventory balancing core WMS requirements. As parcel carriers and grocers accelerate micro-fulfillment, thousands of Tier 3 nodes will come online, each demanding lightweight yet robust WMS footprints. Consequently, vendors are investing in modular architectures that scale down gracefully without dropping essential compliance and visibility functions.
By End-User Industry: Retail Foundation with Pharmaceutical Acceleration
Retail and e-commerce captured 35.02% of spending in 2024, anchored by the constant need for rapid order turn and omnichannel visibility. Fast fashion and consumer electronics merchants were early adopters of cycle-count automation and returns diagnostics, setting performance benchmarks other sectors now chase. Pharmaceutical warehouses rank as the swiftest riser forecast at 23.31% CAGR as DSCSA and real-time release transform compliance from static paperwork to live digital records. Drug manufacturers link WMS with MES to automate sample quarantine, temperature variance alerts, and serialized pallet tracking from bulk sterile manufacture to finished-goods staging.
Third-party logistics providers form a sizeable slice because brand owners outsource multichannel complexity and regulatory burdens. Food and beverage growers race to meet FSMA 204 traceability, compelling SKU-level event capture at inbound inspection, processing, and outbound shipment. Manufacturing warehouses harness WMS to stage components for just-in-time production, shrinking work-in-process buffers and freeing floor space for revenue-generating assembly lines. Across verticals, customer experience metrics fill-rate and on-time-in-full have become board-level KPIs, vaulting WMS from back-office tool to strategic platform.
Geography Analysis
The South anchored 38.77% of 2024 revenue thanks to deep-water ports at Savannah and Houston, pro-business tax regimes, and robust interstate connectivity that funnel imports into domestic retail networks. Dallas-Fort Worth alone topped 30 million sq ft of net absorption, spurring multi-tenant campuses where WMS rollouts are bundled into lease agreements to speed tenant readiness. Nearshoring trends see Mexican-manufactured goods cross Laredo and El Paso, adding demand for cross-dock-oriented WMS setups capable of translating Spanish ASNs into U.S. UOM codes without manual re-keying.
The West is slated for the fastest 22.1% CAGR on the strength of port-modernization at Los Angeles and Oakland, and a tech-savvy labor pool that embraces AI pilots early.[4]Savills Research, “State of the U.S. Industrial Market Q2 2024,” savills.us High real-estate costs and chronic labor shortages push operators toward dense automation and cloud SaaS to maximize cubic utilization and keep headcount lean. Silicon Valley start-ups use West Coast sites as POCs for autonomous drones and predictive analytics before commercializing nationwide. Environmental regulations around emissions and water usage also spur the adoption of energy-optimization modules embedded in leading WMS packages.
The Northeast maintains a sizeable share due to proximity to 55 million consumers within a day’s drive, yet dated building stock mandates retrofits that complicate conveyor layouts and software integration. Labor markets are tight, prompting uptake of voice-picking and robot-escort cart solutions that minimize travel. Meanwhile, the Midwest leverages its central geography for national hub-and-spoke networks; Chicago-area facilities deploy multi-client WMS instances that segment inventory by brand while pooling labor across aisles. Both regions confront aging IT estates in legacy 3PL campuses, investing heavily in phased migrations to cloud microservices that minimize downtime risk.
Competitive Landscape
The US Warehouse Management System market supports a diverse roster of vendors, yielding a medium concentration profile. Manhattan Associates and Blue Yonder remain entrenched among Fortune 500 retailers, leveraging mature slotting engines and vast partner ecosystems. Oracle and SAP extend WMS capabilities out of their ERP cores, winning multinational rollouts that prize end-to-end data continuity. Niche specialists such as Softeon and HighJump (now Körber) offer modular suites that resonate with mid-market 3PLs needing granular billing and wave-planning flexibility.
Strategic alliances shape differentiation: Blue Yonder’s partnership with Geek+ for AMR orchestration bundles hardware and AI dispatching, while Manhattan’s cloud-native Active WM pairs with Locus Robotics through certified adapters. Venture-backed entrants like Corvus Robotics and Dexory challenge incumbents by embedding autonomous inventory drones directly into the WMS transaction stream, offering near-continuous cycle counting. Customers weigh ecosystem maturity against agility; some split portfolios, retaining legacy systems in flagship DCs and piloting next-generation platforms in greenfield micro-fulfillment centers.
M&A activity focuses on filling functional gaps in labor-management, yard-management, AI analytics, and on securing vertical depth in regulated industries. Vendors tout open APIs and low-code UI builders to shorten integration timelines, an advantage when courting 3PLs with heterogenous customer ERPs. As cloud adoption deepens, recurring revenue mixes shift upward, funding R&D into prescriptive analytics and digital-twin simulation. Competitive positioning, therefore, hinges on delivering tangible productivity gains faster than alternative investments in automation hardware or real-estate expansion.
US Warehouse Management System Industry Leaders
Manhattan Associates Inc.
Blue Yonder Group Inc.
Körber Supply Chain Software Inc.
Infor Inc.
Tecsys Inc.
- *Disclaimer: Major Players sorted in no particular order

Recent Industry Developments
- September 2025: LeverX finalized a greenfield SAP Extended Warehouse Management rollout for a global pharmaceutical firm, delivering full FDA and GMP compliance, integrated traceability, a 35% lift in staff productivity, and a 40% cut in material movements.
- August 2025: Multiple pharmaceutical and food manufacturers fast-tracked WMS projects ahead of the FDA’s January 20, 2026, FSMA 204 deadline, channeling new capital into systems that log Key Data Elements at each Critical Tracking Event and can furnish regulators with requested records within 24 hours.
- July 2025: Venture investors boosted Series B and growth-stage funding for companies developing AI-driven inventory software and autonomous robotics, underscoring confidence that automation can ease chronic warehouse labor gaps and sharpen operating efficiency.
- June 2025: Leading retailers and third-party logistics providers inked partnerships with robotics specialists to deploy autonomous mobile units and AI optimization tools that slot seamlessly into existing WMS environments, targeting dock-side tasks and cycle counting without major facility retrofits.
- May 2025: Cloud-native WMS vendors reported faster uptake among small and midsize warehouses, while hybrid models gained momentum as operators sought the elasticity of the cloud alongside on-premises control for sensitive data and legacy integrations.


US Warehouse Management System Market Report Scope
| Software |
| Services |
| Hardware |
| On-premise |
| Cloud |
| Hybrid |
| Tier 1 – Complex distribution centers (>50,000 SKUs) |
| Tier 2 – Regional warehouses (10,000-50,000 SKUs) |
| Tier 3 – Small stockrooms (<10,000 SKUs) |
| Retail and E commerce |
| Third party logistics |
| Food and Beverage |
| Pharmaceuticals |
| Manufacturing |
| Other End-user Industries |
| Northeast |
| Midwest |
| South |
| West |
| By Component | Software |
| Services | |
| Hardware | |
| By Deployment | On-premise |
| Cloud | |
| Hybrid | |
| By Warehouse Tier | Tier 1 – Complex distribution centers (>50,000 SKUs) |
| Tier 2 – Regional warehouses (10,000-50,000 SKUs) | |
| Tier 3 – Small stockrooms (<10,000 SKUs) | |
| By End-user Industry | Retail and E commerce |
| Third party logistics | |
| Food and Beverage | |
| Pharmaceuticals | |
| Manufacturing | |
| Other End-user Industries | |
| By Region | Northeast |
| Midwest | |
| South | |
| West |


Key Questions Answered in the Report
What is the current value of the US Warehouse Management System market?
The US Warehouse Management System market stands at USD 0.97 billion in 2025.
How fast is the market expected to grow through 2030?
It is forecast to expand at a 20.02% CAGR, reaching USD 2.42 billion by the end of the period.
Which deployment model leads adoption?
Cloud solutions hold 58.8% of 2024 spending, reflecting preference for scalability and lower upfront costs.
Which industry vertical is growing fastest in WMS adoption?
Pharmaceuticals show the highest momentum, projected at a 23.31% CAGR as DSCSA compliance drives investment.
Which U.S. region will see the quickest market expansion?
The West is expected to outpace other regions at a 22.1% CAGR through 2030, aided by port modernization and tech-oriented users.
What primary factor is pushing small warehouses toward WMS upgrades?
Acute labor shortages and e-commerce velocity requirements are motivating smaller sites to deploy automation-ready cloud WMS platforms.
Page last updated on:


