Warehouse Order Picking Market Size and Share
Market Overview
| Study Period | 2019 - 2030 |
|---|---|
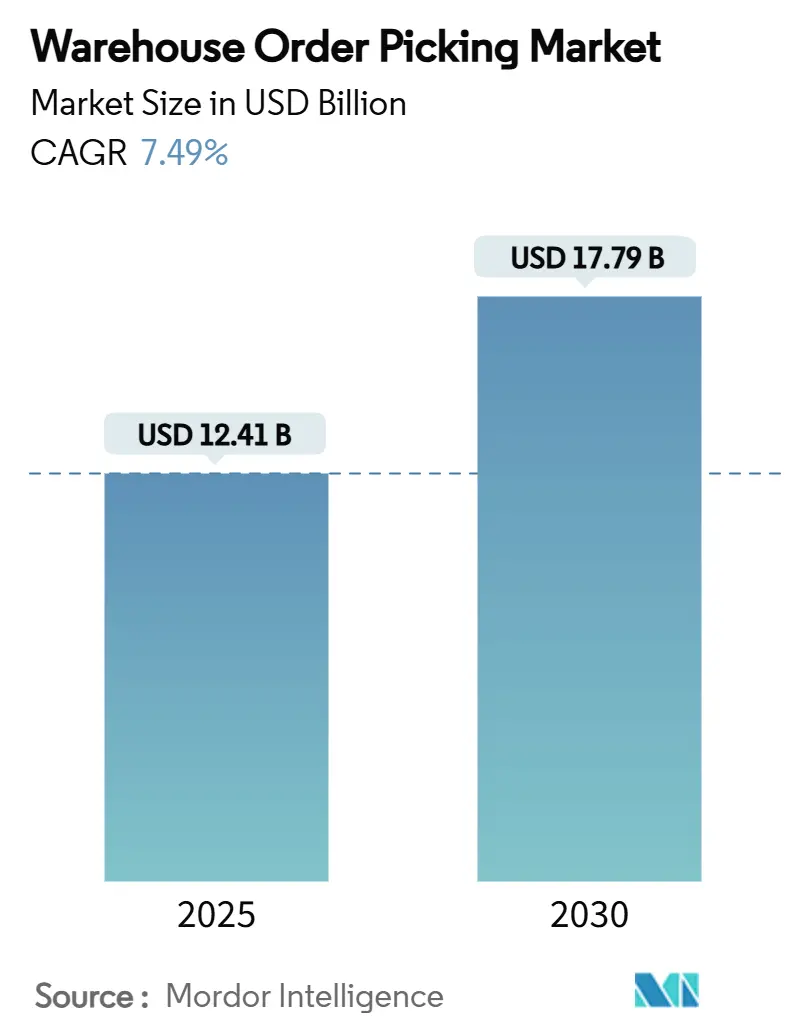
| Market Size (2025) | USD 12.41 Billion |
| Market Size (2030) | USD 17.79 Billion |
| Growth Rate (2025 - 2030) | 7.49% CAGR |
| Fastest Growing Market | Asia Pacific |
| Largest Market | North America |
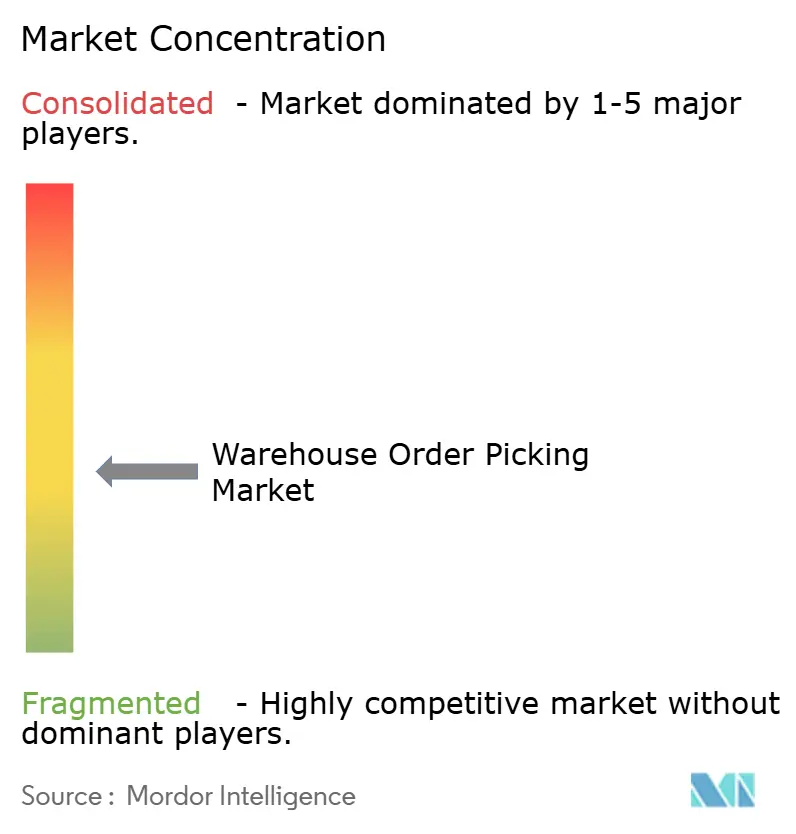
| Market Concentration | Medium |
Major Players *Disclaimer: Major Players sorted in no particular order Image © Mordor Intelligence. Reuse requires attribution under CC BY 4.0. | |
Warehouse Order Picking Market Analysis by Mordor Intelligence
The warehouse order picking market size stands at USD 12.41 billion in 2025 and is forecast to reach USD 17.79 billion by 2030, advancing at a 7.49% CAGR during 2025-2030. Demand accelerates as e-commerce operators push one-hour delivery windows, manufacturers reshore production, and fulfillment centers struggle with chronic labor gaps. Automation vendors answer with autonomous mobile robots, AI-native warehouse execution software, and compact goods-to-person systems that shorten picking cycles to minutes. Falling robot prices and subscription-based Robotics-as-a-Service contracts are lowering entry barriers for small and mid-sized warehouses. Energy-efficient drives, regenerative power systems, and on-site renewables support ESG goals while trimming operating costs. Cyber-physical security, technician shortages, and brownfield integration costs temper the pace of adoption, yet investment momentum remains strong among retailers, 3PLs, and pharmaceutical distributors.
Key Report Takeaways
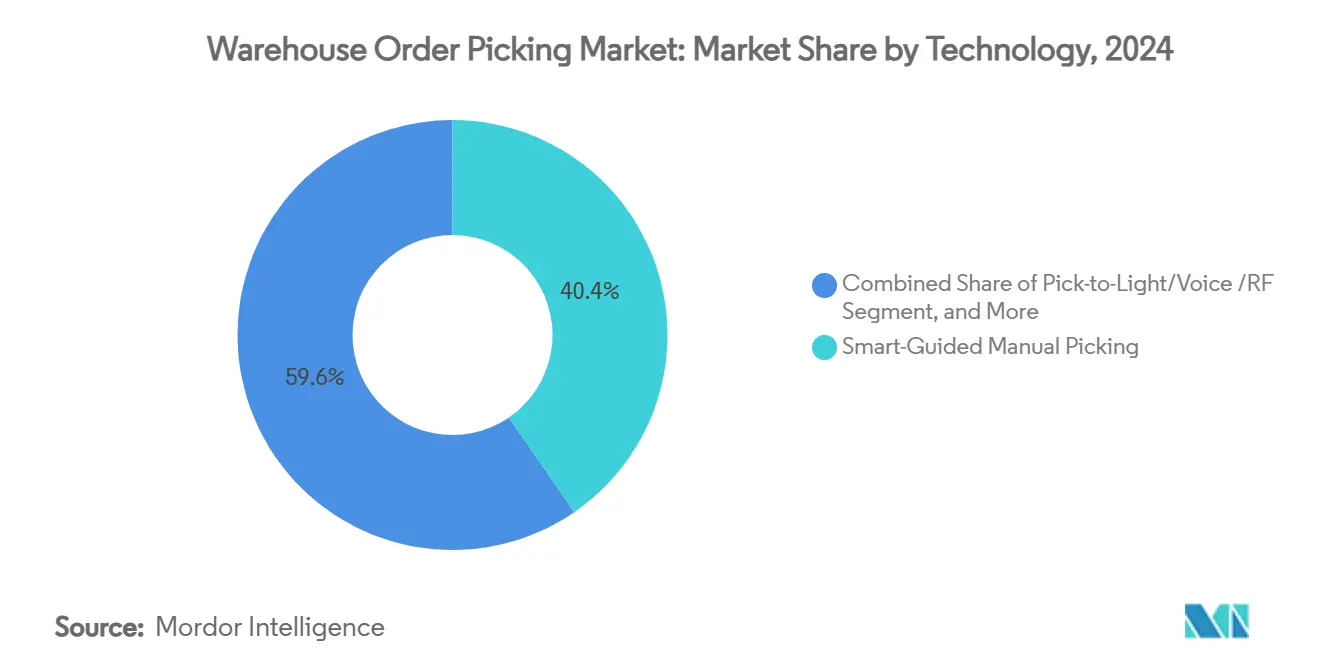
- By technology, smart-guided manual systems led with 40.42%of warehouse order picking market share in 2024, while autonomous mobile robots are on track for a 9.18% CAGR through 2030.
- By picking method, piece picking controlled 55.61% of the warehouse order picking market size in 2024; cluster and batched picking is projected to expand at an 8.76% CAGR between 2025-2030.
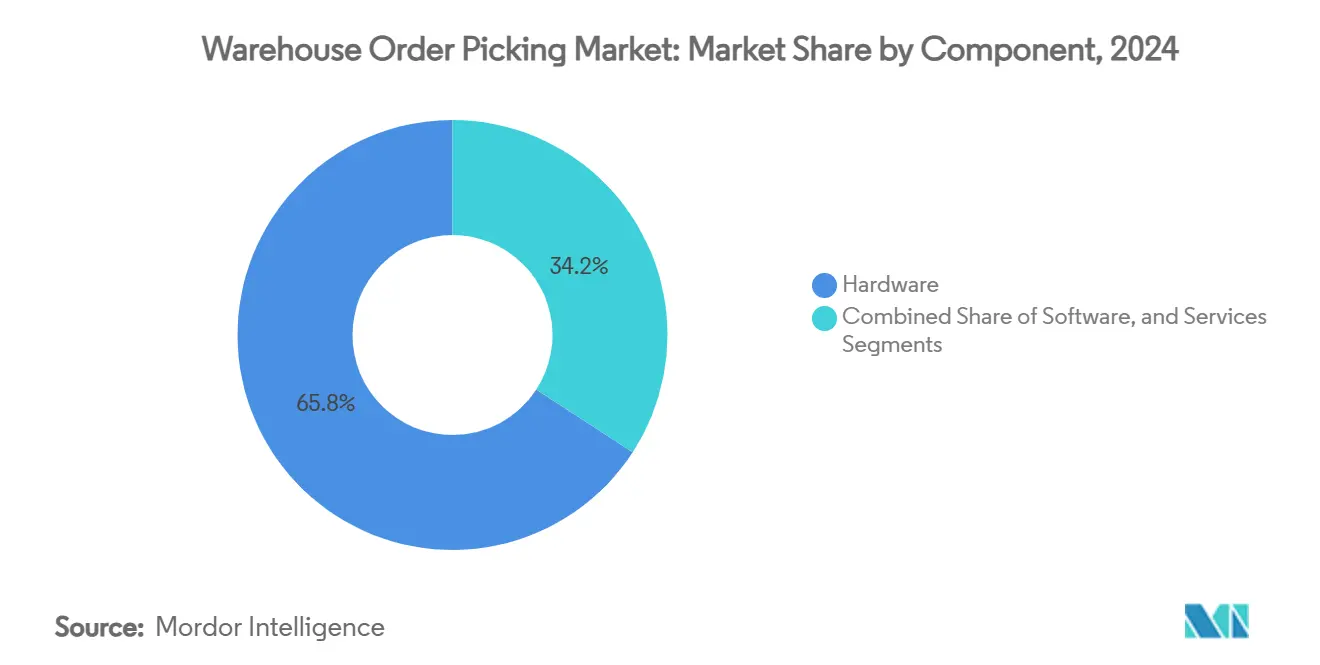
- By component, hardware accounted for 65.82% of the warehouse order picking market size in 2024, whereas software is set to grow at an 8.27% CAGR to 2030.
- By end-user industry, e-commerce and retail captured 47.25% revenue share in 2024; healthcare, pharmaceuticals, and cosmetics are advancing at a 10.58% CAGR through 2030.
- By geography, North America held 34.18% of 2024 revenue, whereas Asia-Pacific records the fastest regional CAGR at 7.87% during the forecast period.
Global Warehouse Order Picking Market Trends and Insights
Drivers Impact Analysis*
| Driver | (~) % Impact on CAGR Forecast | Geographic Relevance | Impact Timeline |
|---|---|---|---|
| Surging same-day delivery service levels | +1.8% | Global, with concentration in North America and Europe urban centers | Short term (≤ 2 years) |
| Escalating warehouse labor cost | + 1.2% | Global, most acute in North America and Western Europe | Medium term (2-4 years) |
| Falling AMR (Autonomous Mobile Robot) Prices | +0.9% | Global, with early adoption in Asia Pacific manufacturing hubs | Medium term (2-4 years) |
| Rising use of AI-Native Warehouse Execution Systems | +1.1% | North America and Europe leading, Asia Pacific rapid follower | Long term (≥ 4 years) |
| ESG-mandated energy-efficient intralogistics retrofits | +0.8% | Europe primary driver, North America and Asia Pacific following | Long term (≥ 4 years) |
| Government fiscal incentives for reshoring | +0.6% | North America primary, with spillover to Mexico and Canada | Medium term (2-4 years) |
| Source: Mordor Intelligence | |||
Same day delivery expectations
Consumers now equate fast delivery with brand loyalty. Urban micro-fulfillment centers dedicate scarce floor space to goods-to-person systems that compress pick paths and push order-to-ship cycles below 15 minutes.[1]AutoStore (https://www.autostoresystem.com/cases/an-innovator-in-rapid-online-delivery-is-getting-faster-with-autostore-mfc-solutions) Retailers integrate compact cube storage and high-speed shuttle robots to boost order density and maintain real-time stock accuracy. Food, grocery, and apparel segments lead deployment because product freshness and style seasonality demand near-instant fulfillment. Same-day guarantees also accelerate adoption of predictive slotting software that positions high-velocity SKUs within one robot move from pick stations. Parcel carriers benefit as automated hubs flatten afternoon peaks and enable late order cut-off times.
Rising warehouse labor cost
Labor represents up to 70% of fulfillment expense, with 400% annual turnover at many U.S. facilities.[2]Honeywell International Inc. (https://www.honeywell.com/us/en/news/featured-stories/2024/09/future-warehouse-operations-hybrid-labor-management)Wage inflation strengthens the payback case for robotic picking that triples lines per hour while reducing workplace injuries. Operators deploy hybrid workflows where robots handle repetitive travel and people manage exception cases, raising overall productivity and job satisfaction. Government incentives for reshoring amplify automation investments as manufacturers offset higher domestic wages through lights-out intralogistics. Labor pressures likewise spur interest in ergonomic exoskeletons and AI-assisted vision picking that extend the productive life of experienced staff.
Falling AMR prices
Average unit costs for autonomous mobile robots have dropped by 40% since 2017, targeting USD 10,800 by 2025. Lower prices open the warehouse order picking market to 50,000 mid-size facilities previously priced out of goods-to-person automation. Modularity allows operators to start with ten robots and scale upward without new rails or guide-paths. Battery chemistry improvements deliver two-shift run time, while cloud fleet managers balance traffic and cut idle time. Robotics-as-a-Service plans convert upfront capex into monthly opex, easing CFO concerns and smoothing cash flow.
AI-native warehouse execution systems
Machine-learning algorithms now recalculate optimal pick sequences every few seconds, shortening travel by 30% and hitting 99.5% order accuracy at scale. Vision analytics automates quality inspection, and predictive maintenance slashes unplanned downtime. Digital twins allow operators to model SKU mix changes virtually before moving a shelf. Cloud applications achieve 90% adoption in greenfield sites, democratizing advanced analytics for companies without large IT teams.[3]Association for Advancing Automation (https://www.automate.org/editorials/ai-in-warehouse-efficiency-in-2025) Over time, AI-native systems replace fixed rule engines, giving warehouses self-optimizing capabilities that raise throughput regardless of demand shocks.
Restraints Impact Analysis*
| Restraint | (~) % Impact on CAGR Forecast | Geographic Relevance | Impact Timeline |
|---|---|---|---|
| Shortage of Skilled Technicians for Automation Maintenance | -0.7% | Global, most acute in North America and Western Europe | Medium term (2-4 years) |
| High Upfront CAPEX for Brownfield Integration | -0.5% | Global, particularly affecting SMEs in Asia Pacific and emerging markets | Short term (≤ 2 years) |
| Cyber-Physical Security Risks | -0.4% | Global, with heightened concerns in critical infrastructure sectors | Long term (≥ 4 years) |
| Fragmented Software Interoperability Standards | -0.3% | Global, with regional variations in adoption standards | Medium term (2-4 years) |
| Source: Mordor Intelligence | |||
Shortage of skilled automation technicians
In recent years, supply-chain managers have increasingly reported difficulty in hiring qualified mechatronics staff, and 770,000 technician positions will open by 2025. Skill gaps inflate maintenance costs and force vendors to bundle extended remote support agreements. Rural facilities suffer most because travel times hinder rapid response to breakdowns, prompting interest in self-diagnosing robots and augmented-reality repair guides. Community colleges are expanding two-year programs, but graduation numbers lag demand. Until the pipeline fills, technician scarcity slows multi-site roll-outs and lengthens ROI periods for capital projects.
High upfront CAPEX for brownfield projects
Retrofitting legacy buildings often costs 40% more than greenfield installations due to structural reinforcements, floor resurfacing, and phased cutovers that keep operations running. Symbotic’s recent delays underline how integration risk erodes shareholder value when expenses outpaced budgets. Small and mid-sized enterprises hesitate to commit USD 5-10 million without flexible financing. Pay-per-pick and robot leasing models are emerging, yet adoption remains limited in traditional sectors unfamiliar with subscription economics. Vendors are responding with modular mezzanines and software-defined controls that reduce construction scope, but brownfield payback periods still trail those of new facilities.
*Our forecasts treat driver/restraint impacts as directional, not additive. The impact forecasts reflect baseline growth, mix effects, and variable interactions.
Segment Analysis
By Technology: Manual Systems Face AMR Disruption
Manual and smart-guided solutions retained 40.42% of 2024 revenue, reflecting the installed base of RF-scanner workflows in small warehouses. Yet autonomous mobile robots headline growth, posting a 9.18% CAGR as prices fall and navigation software matures. Goods-to-person shuttles gain ground in high-density e-commerce hubs where cubic real estate costs outpace automation outlays. Collaborative picking robots fill the gap for SKU sets that remain hard to grip, lowering changeover time versus full mechanization. As labor shortages intensify, the warehouse order picking market increasingly gravitates toward hybrid human–robot ecosystems that preserve flexibility while lifting throughput.
Digital twins accelerate technology migrations by simulating rack spacing, robot fleet size, and conveyor speeds before installers arrive. Emerging 5G private networks remove Wi-Fi congestion and push control latency below 10 milliseconds, enabling synchronized fleets of 300+ robots. Vision-guided picking arms now integrate tactile sensors, broadening the SKU envelope to include soft polybags and irregular consumer goods. Technology selection thus hinges less on fundamental capability gaps and more on a buyer’s appetite for capital risk and change-management readiness.


By Picking Method: Piece Dominance Meets Algorithmic Clustering
Piece picking commanded 55.61% of 2024 demand because single-item e-commerce orders remain prevalent. AI clustering is reshaping this mix by consolidating orders with overlapping SKUs and driving an 8.76% CAGR for batch picking workflows. Case picking holds steady inside B2B and club-store channels where pallet quantities still move. Pallet picking persists for inbound replenishment and wholesale cross-docking where throughput outweighs flexibility. Machine-learning engines embedded in warehouse execution platforms now decide method shifts dynamically, improving picker productivity by 20% without hardware changes.
Cluster algorithms also reduce travel paths when combined with put-wall sortation that funnels batch contents into discrete e-commerce parcels. Operators deploying robotic put-walls improve order accuracy to 99.8% and speed induction times for seasonal labor. The warehouse order picking market benefits as these software-led optimizations extend ROI to facilities unable to justify high-bay shuttle systems. Going forward, demand forecasting modules will tie method selection to marketing campaigns, automatically allocating resources ahead of flash-sales or new product drops.
By Component: Software Commands Premium Multiples
Hardware still generated 65.82% of revenue in 2024 through conveyors, shuttles, racks, and robots. Yet software enjoys the highest valuation multiples and an 8.27% CAGR to 2030 as operators prioritize real-time orchestration. Cloud-native platforms deliver upgrades monthly, avoiding forklift replacements for feature gains. Middleware translators bridge legacy PLCs with modern REST APIs, easing phased migrations in brownfield warehouses. Service revenue grows alongside software because implementation, training, and lifecycle support remain indispensable, particularly for small firms without in-house engineers.
Vendors embed cybersecurity modules that monitor traffic across operational and information technology layers, fulfilling insurance mandates for critical infrastructure. As AI drives decision making, explainability dashboards satisfy auditors and regulatory bodies by logging algorithmic logic. The warehouse order picking market thus moves toward platform models where hardware becomes a data-collection endpoint and software delivers differentiating value.
By End-User Industry: Healthcare Accelerates High-Spec Adoption
E-commerce and retail accounted for 47.25% of 2024 turnover, a testament to relentless online spending and wide SKU diversity. Pharmaceutical, healthcare, and cosmetics facilities post the strongest 10.58% CAGR because temperature control, track-and-trace mandates, and contamination avoidance require precise handling. Robotic cube storage mitigates human contact and maintains constant ambient conditions, addressing Good Distribution Practice regulations. Food and beverage follow closely as grocers trial micro-fulfillment near city centers to cut last-mile costs.
Manufacturing adoption accelerates as lean programs target intralogistics bottlenecks that starve assembly lines. Construction remains early-stage, yet modular housing trends promise predictable parts that suit automated case picking. Transportation and 3PL providers expand solutions portfolios, bundling fulfillment automation with freight forwarding to lock in customer contracts. As compliance pressures rise, verticals with strict quality regimes pay premiums for validated automation, propelling specialized integrators into lucrative niches.
Geography Analysis
North America accounted for the largest market share in the global warehouse order picking market in 2024, driven by strong investments from omnichannel giants in robotic automation and AI-based orchestration systems. Walmart’s USD 200 million pilot of autonomous forklifts exemplifies large-scale commitment to mechanized intralogistics. Canada and Mexico gain manufacturing share through near-shoring, prompting regional logistics firms to deploy shuttle-based goods-to-person systems near cross-border corridors.
Europe follows with widespread retrofit activity that swaps aging conveyor lines for energy-efficient motor drives, advancing corporate ESG pledges. Germany leads patent filings, while France and the United Kingdom focus on grocery micro-fulfillment to mitigate congestion charges in urban delivery zones. Italy illustrates the trend with Dr. Max’s new automated hub leveraging AMRs and shuttle technology. Pan-European integrators compete by bundling renewable power audits with automation roll-outs.
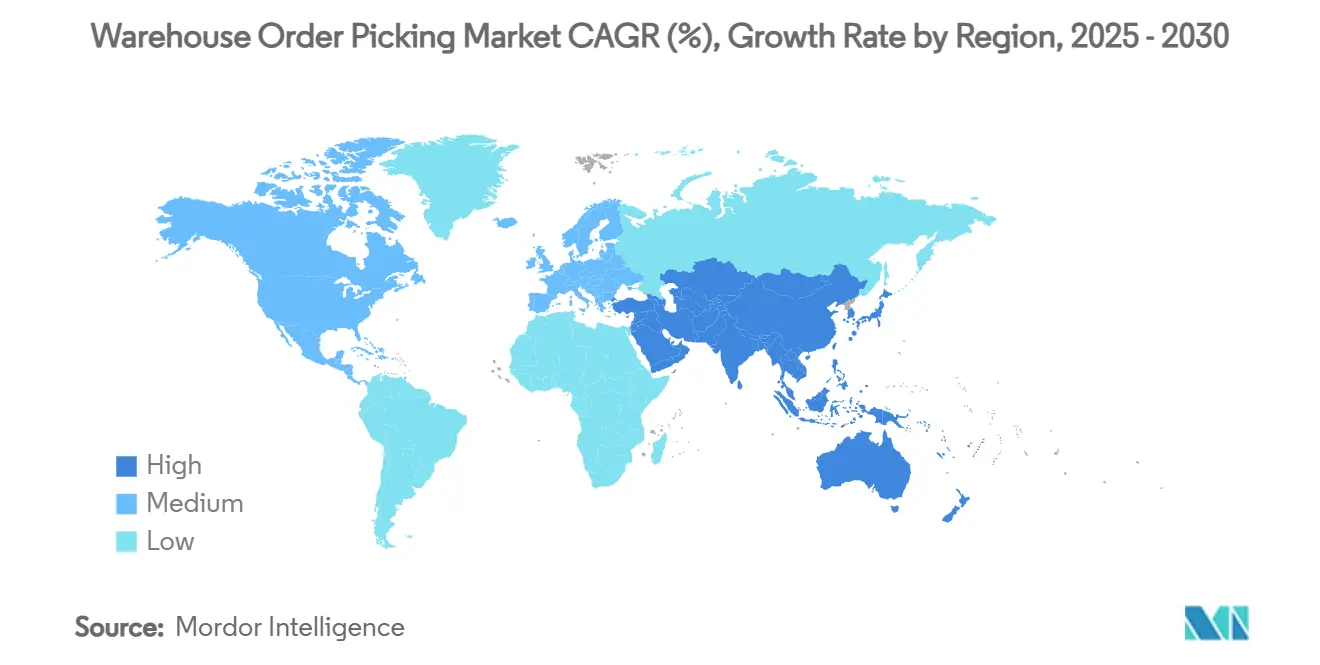

Asia-Pacific is the fastest rising region, adding USD 1.36 billion between 2025 and 2030. Chinese 11-11 and 6-18 shopping festivals stress fulfillment nodes, driving wholesale replacement of manual zones with high-speed tote shuttles. Japanese operators retrofit seismic-proof racking and collaborative robots to offset demographic labor shortages. India’s policy packages subsidize automated storage and retrieval systems for export-oriented factories, and Australia pilots autonomous case picking in cold-chain facilities supplying remote communities.
Competitive Landscape
Competition remains moderate, with legacy material-handling firms, robot specialists, and software newcomers vying for wallet share. KION Group partners with NVIDIA and Accenture to embed digital twins that simulate entire supply chains, shrinking commissioning times by 20%. Zebra Technologies bought Photoneo to marry 3D vision with handheld scanning, extending reach from data capture to robotic perception. Quicktron Robotics and Fox Robotics secure fresh capital, intensifying price pressure on incumbent AMR vendors.
Intellectual-property filings emphasize vision stacking, robotic gripping, and dynamic task assignment. Vendors woo buyers with lifetime throughput guarantees and performance-based contracts that pay per pick. System integrators raise value by unifying WMS, WES, and material-flow simulation within one dashboard, enabling single-pane oversight. Market entrants differentiate through specialized niches such as AI-powered consolidation robots or deep-freeze compatible shuttles. As platform ecosystems mature, software interoperability will dictate supplier selection more than physical robot speed.
Consolidation is expected as diversified lift-truck makers acquire software houses, mirroring Toyota Industries’ earlier purchase of Bastian Solutions. Meanwhile, Amazon’s interest in Covariant underscores wholesale’s appetite for proprietary AI as a strategic asset. Overall, supplier power sits with vendors that can integrate hardware, software, and financing, rather than with single-point technology purveyors.
Warehouse Order Picking Industry Leaders
KION Group AG
Toyota Industries Corporation
Honeywell International Inc.
Daifuku Co., Ltd.
BEUMER GROUP
- *Disclaimer: Major Players sorted in no particular order

Recent Industry Developments
- July 2025: THG Fulfil deployed a 120,000-bin AutoStore system with 100 R5 Pro robots in Warrington, U.K.
- June 2024: Tharsus Group invested GBP 8 million (USD 10 million) in VersaTile’s AI warehouse solutions.
- June 2024: RightHand Robotics expanded its RightPick deployment at Apotea’s new logistics center in Varberg, Sweden.


Global Warehouse Order Picking Market Report Scope
| Smart-Guided Manual Picking |
| Pick-to-Light/Voice /RF |
| AS/RS-based Goods-to-Person |
| Autonomous Mobile Robots (AMR) |
| Collaborative Picking Robots |
| Piece Picking |
| Case Picking |
| Pallet Picking |
| Cluster/Batched Picking |
| Hardware |
| Software |
| Services |
| E-commerce and Retail |
| Food and Beverage |
| Healthcare, Pharmaceuticals, and Cosmetics |
| Manufacturing |
| Transportation and Logistics |
| Construction |
| Other End-User Industries (Agriculture and Farming, Home Goods and Furniture, among others) |
| North America | United States |
| Canada | |
| Mexico | |
| Europe | United Kingdom |
| Germany | |
| France | |
| Italy | |
| Rest of Europe | |
| Asia Pacific | China |
| Japan | |
| India | |
| Australia | |
| South Korea | |
| Rest of Asia Pacific | |
| South America | Brazil |
| Argentina | |
| Rest of South America | |
| Middle East | United Arab Emirates |
| Saudi Arabia | |
| South Africa | |
| Rest of Middle East | |
| Africa | South Africa |
| Egypt | |
| Nigeria | |
| Rest of Africa |
| By Technology | Smart-Guided Manual Picking | |
| Pick-to-Light/Voice /RF | ||
| AS/RS-based Goods-to-Person | ||
| Autonomous Mobile Robots (AMR) | ||
| Collaborative Picking Robots | ||
| By Picking Method | Piece Picking | |
| Case Picking | ||
| Pallet Picking | ||
| Cluster/Batched Picking | ||
| By Component | Hardware | |
| Software | ||
| Services | ||
| By End-User Industry | E-commerce and Retail | |
| Food and Beverage | ||
| Healthcare, Pharmaceuticals, and Cosmetics | ||
| Manufacturing | ||
| Transportation and Logistics | ||
| Construction | ||
| Other End-User Industries (Agriculture and Farming, Home Goods and Furniture, among others) | ||
| By Geography | North America | United States |
| Canada | ||
| Mexico | ||
| Europe | United Kingdom | |
| Germany | ||
| France | ||
| Italy | ||
| Rest of Europe | ||
| Asia Pacific | China | |
| Japan | ||
| India | ||
| Australia | ||
| South Korea | ||
| Rest of Asia Pacific | ||
| South America | Brazil | |
| Argentina | ||
| Rest of South America | ||
| Middle East | United Arab Emirates | |
| Saudi Arabia | ||
| South Africa | ||
| Rest of Middle East | ||
| Africa | South Africa | |
| Egypt | ||
| Nigeria | ||
| Rest of Africa | ||


Key Questions Answered in the Report
How fast is demand for autonomous mobile robots growing inside fulfillment centers?
The segment leads growth at roughly 7.49% CAGR through 2030 as unit prices fall and navigation software matures.
Which end-user vertical is adopting high-spec automation the quickest?
Healthcare, pharmaceuticals, and cosmetics show the fastest 10.58% CAGR because regulatory and temperature-control needs favor robotic picking.
What is the biggest hurdle when retrofitting existing warehouses?
Brownfield projects face higher upfront costs and longer installation timelines due to structural upgrades and phased cutovers.
Which region is expanding the fastest?
Asia-Pacific posts about 7.87%CAGR on the back of e-commerce growth, manufacturing shifts, and government automation incentives.
Page last updated on:


