Market Overview
| Study Period | 2020 - 2031 |
|---|---|
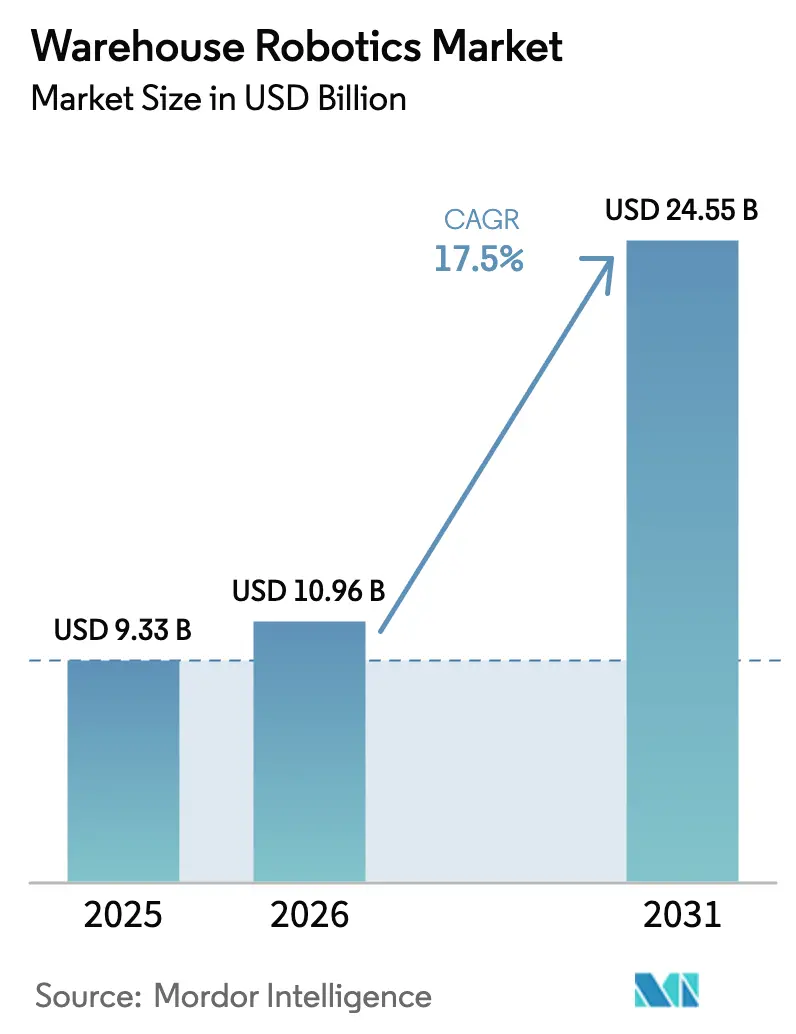
| Market Size (2026) | USD 10.96 Billion |
| Market Size (2031) | USD 24.55 Billion |
| Growth Rate (2026 - 2031) | 17.50% CAGR |
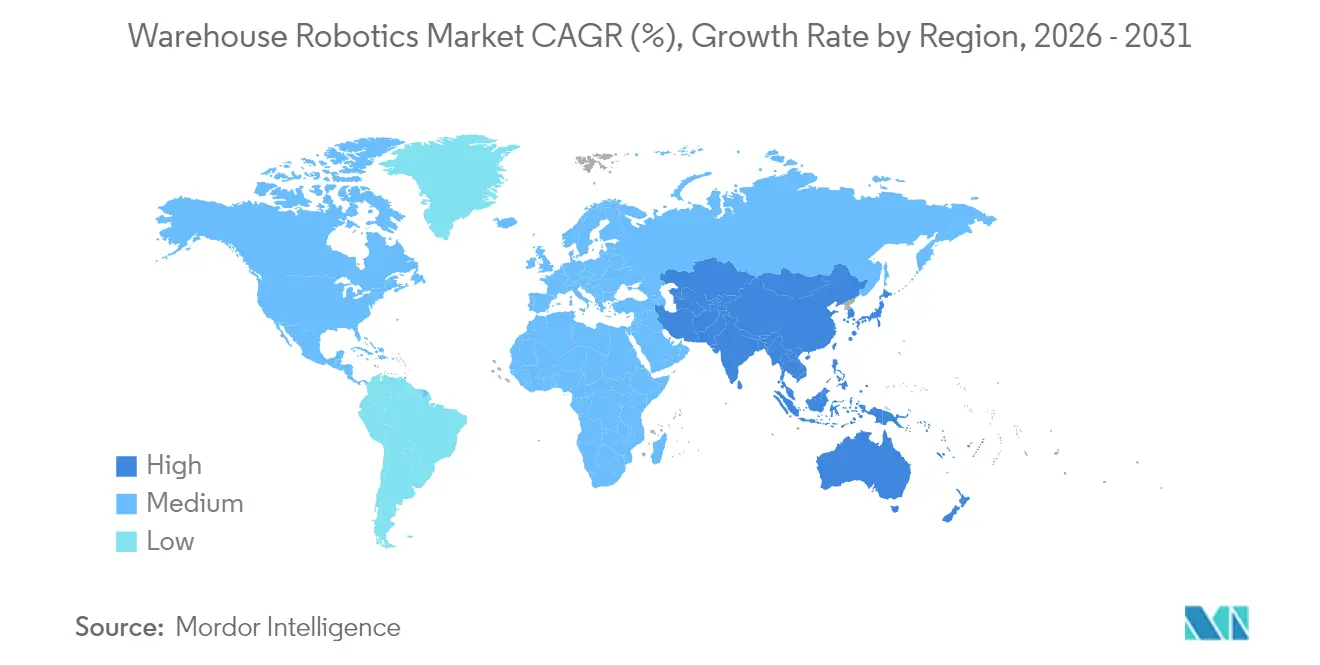
| Fastest Growing Market | Asia Pacific |
| Largest Market | Asia Pacific |
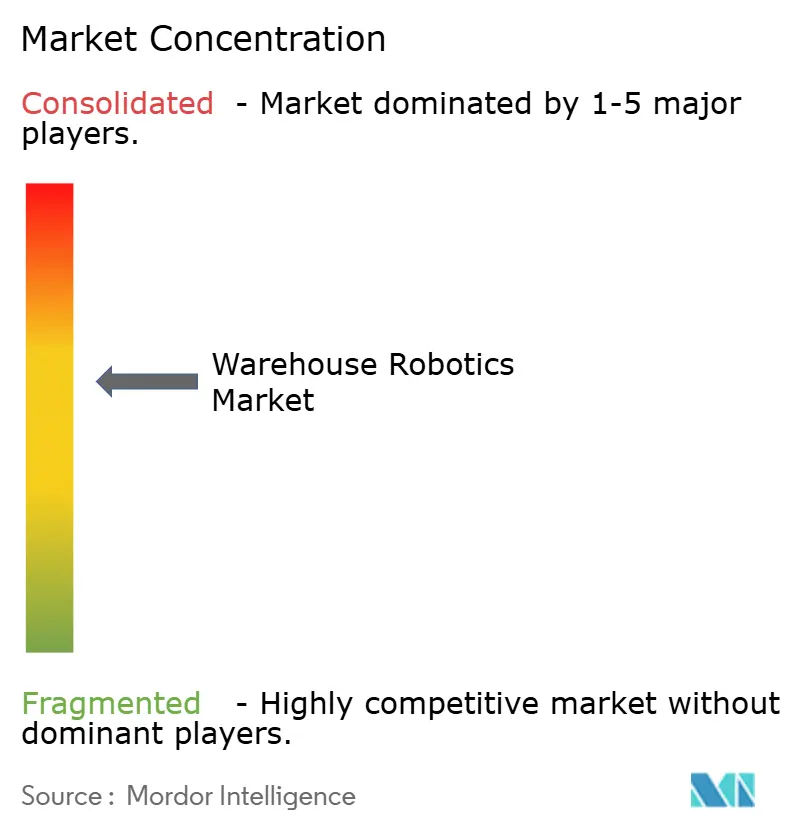
| Market Concentration | Medium |
Major Players *Disclaimer: Major Players sorted in no particular order Image © Mordor Intelligence. Reuse requires attribution under CC BY 4.0. | |
Warehouse Robotics Market Analysis by Mordor Intelligence
The warehouse robotics market size is expected to grow from USD 9.33 billion in 2025 to USD 10.96 billion in 2026 and is forecast to reach USD 24.55 billion by 2031 at 17.5% CAGR over 2026-2031. A tight labor pool in OECD economies, SKU proliferation that complicates manual picking, and computer-vision breakthroughs that let robots grasp irregular items are the prime accelerants. Intensifying same-day-delivery promises compress fulfillment windows, driving retailers and 3PLs to automate complex picking flows with autonomous mobile robots (AMRs) and automated storage and retrieval systems (AS/RS). Asia Pacific dominates shipments as China recorded a 44% spike in new warehouse robot installations during 2024.[1]IFR Editorial Team, “Robot Installations Reach Record High in China,” International Federation of Robotics, ifr.orgHardware still accounts for 70.62% of outlays, yet edge-enabled fleet-orchestration software is the fastest-growing layer as operators seek real-time optimization that lifts asset utilization and ROI.[2]Editorial, “Tech Trends 2030: The Next Era of Industrial Robotics,” Siemens Insights, siemens.com M&A keeps reshaping the field: Zebra Technologies bought Photoneo for USD 350 million in December 2024 to secure 3-D vision IP.
Key Report Takeaways
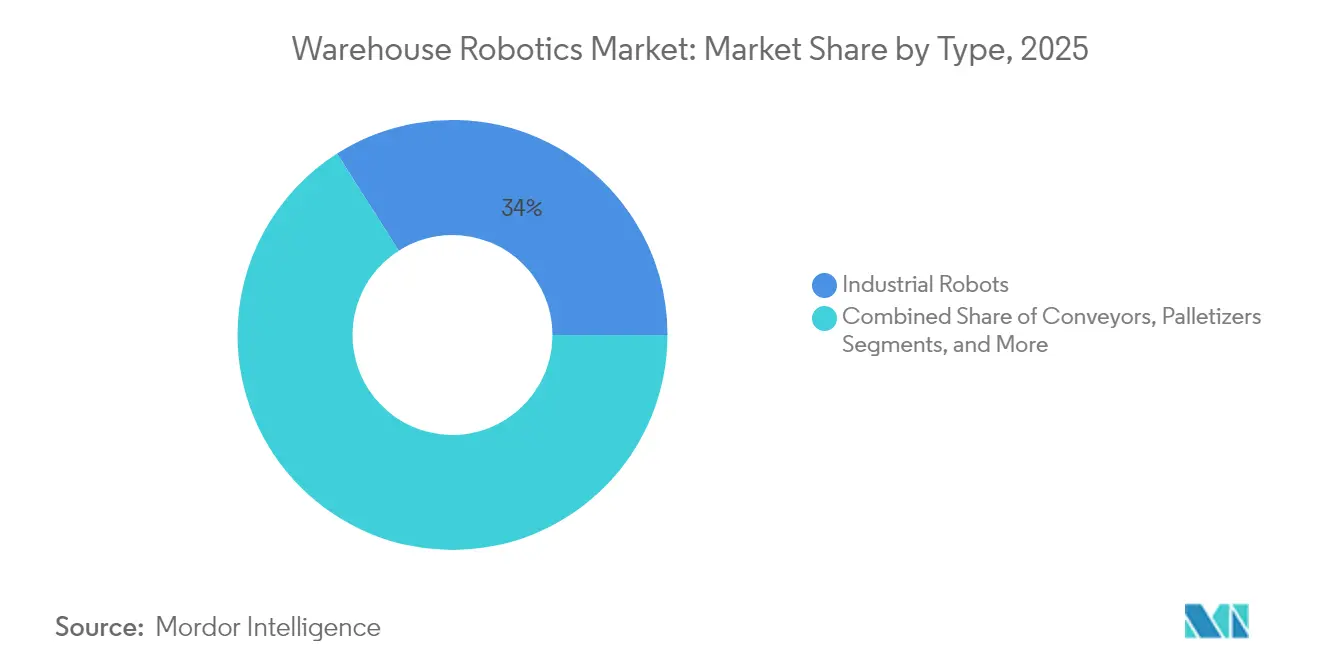
- By product type, industrial robots led with 34.02% revenue share of the warehouse robotics market size in 2025; mobile robots are projected to expand at an 18.02% CAGR through 2031.
- By function, storage commanded 38.05% share of the warehouse robotics market size in 2025, while picking and sorting is advancing at an 18.11% CAGR through 2031.
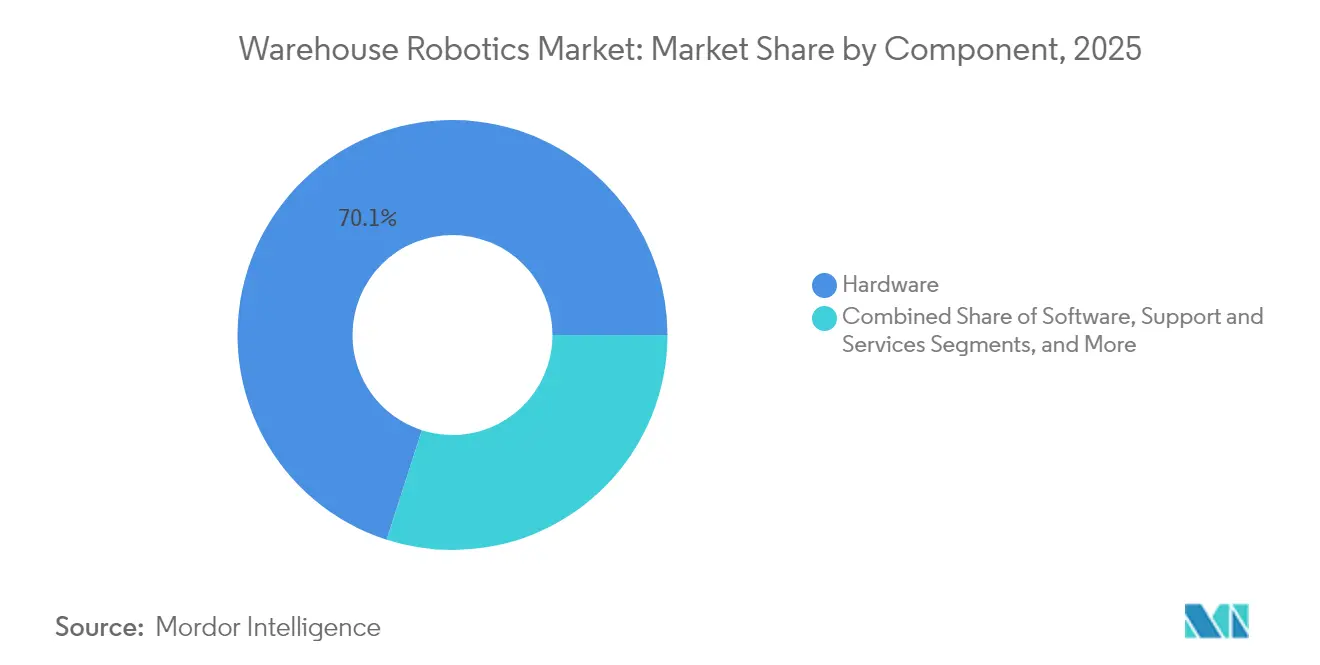
- By component, hardware captured 70.05% of the warehouse robotics market share in 2025; software is forecast to register an 18.44% CAGR to 2031.
- By end-user industry, retail and e-commerce accounted for a 28.31% slice of the warehouse robotics market size in 2025, yet automotive shows the highest projected CAGR at 17.96% through 2031.
- By geography, Asia Pacific held 39.52% share of the warehouse robotics market size in 2025 and is set to expand at an 17.94% CAGR to 2031.
Note: Market size and forecast figures in this report are generated using Mordor Intelligence’s proprietary estimation framework, updated with the latest available data and insights as of 2026.
Global Warehouse Robotics Market Trends and Insights
Drivers Impact Analysis*
| Driver | (~) % Impact on CAGR Forecast | Geographic Relevance | Impact Timeline |
|---|---|---|---|
| E-commerce SKU proliferation and same-day-delivery pressure | +2.8% | Global, concentrated in North America and APAC | Short term (≤ 2 years) |
| Rising investments by 3PLs and retailers in AMRs and AS/RS | +3.1% | North America and Europe, expanding to APAC | Medium term (2-4 years) |
| Shrinking warehouse labor pool in OECD economies | +2.4% | North America and Europe core, spillover to developed APAC | Long term (≥ 4 years) |
| AI-powered vision enabling robotic picking of difficult SKUs | +1.9% | Global, early adoption in North America and Europe | Medium term (2-4 years) |
| Edge-based fleet orchestration cuts downtime and boosts ROI | +1.6% | Global, technology-forward markets first | Short term (≤ 2 years) |
| Carbon-neutral warehousing mandates favor low-energy robots | +1.2% | Europe and North America, expanding globally | Long term (≥ 4 years) |
| Source: Mordor Intelligence | |||


E-commerce SKU Proliferation and Same-Day-Delivery Pressure
Amazon now juggles more than 350 million active SKUs, a scale that overwhelms manual pickers and demands robotic confidence in grasping dissimilar shapes. Same-day commitments shrink cycle times to under four hours in major metros, so fulfillment nodes deploy AMRs that triple order-processing speed during peak events. Seasonal spikes can push volumes 500%, rendering manual flex-labor models cost-prohibitive. Goods-to-person systems erase unproductive employee travel, while AI inventory-placement tools cut average pick paths 60%. Regulators enforce truthful delivery-promise disclosure, compelling operators to harden throughput guarantees with robotic capacity.
Rising Investments by 3PLs and Retailers in AMRs and AS/RS
DSV earmarked USD 50 million to roll out AMRs across European sites, unlocking density gains of 85% and shielding margins from urban rent inflation. Walmart matched with a USD 1 billion automation pledge that widens adoption of micro-fulfillment centers embedded in existing stores.[3]Staff Writer, “Walmart Announces USD 1 Billion Investment in Supply Chain Automation,” Walmart Corporate News, walmart.com Robots-as-a-service schemes lower entry thresholds by shifting spend from CAPEX to variable fees per pick. ISO 3691-4 driverless-truck standards give risk-averse logistics managers a compliance roadmap, accelerating green-lighting of AMR pilot projects.
Shrinking Warehouse Labor Pool in OECD Economies
Vacancy rates top 8% in U.S. and European fulfillment hubs, and churn hovers near 100% in strenuous roles. Real wages escalated 15-20% during 2024, eroding profit cushions for manual warehouses. Robots slash labor minutes per order up to 60%, enabling facilities to absorb volume growth without proportionate head-count increases. Aging workforces further tighten supply in Japan and Germany, while younger cohorts prefer technology-centric jobs. Firms now position robotics as augmentation rather than displacement, reserving human staff for exception resolution and continuous improvement tasks.
AI-Powered Vision Enabling Robotic Picking of Difficult SKUs
Vision stacks now hit 99.5% grasp accuracy on transparent, deformable, or reflective items that once defeated automation. Machine-learning pipelines accelerate category onboarding from weeks to hours, broadening addressable use cases in pharma and luxury cosmetics. New multi-material grippers combine suction, pinch, and soft-finger modes in one end-effector, letting a single cell tackle 15-20 SKU families without retooling. Edge GPUs compress image-to-action latency below 50 milliseconds, rivaling human reflex while maintaining repeatability.
Restraints Impact Analysis*
| Restraint | (~) % Impact on CAGR Forecast | Geographic Relevance | Impact Timeline |
|---|---|---|---|
| High CAPEX and integration cost for brownfield retrofits | -1.8% | Global, more acute in mature markets with legacy infrastructure | Short term (≤ 2 years) |
| Fragmented safety and data-privacy regulations by region | -1.4% | Global, particularly complex in Europe and North America | Medium term (2-4 years) |
| Cyber-physical security vulnerabilities in fleet software | -0.9% | Global, higher risk in connected environments | Short term (≤ 2 years) |
| Lithium-ion battery supply volatility affects AMR BOM costs | -0.7% | Global, supply chain concentrated in APAC | Medium term (2-4 years) |
| Source: Mordor Intelligence | |||
High CAPEX and Integration Cost for Brownfield Retrofits
Retrofitting legacy sites costs 60-80% more than greenfield builds because aisles, mezzanines, and electrical services rarely align with robot envelopes.[4]Bastian Solutions Team, “Warehouse Automation: Brownfield vs Greenfield Considerations,” Bastian Solutions, bastiansolutions.com Projects often trigger USD 2 million in wiring, floor leveling, and software-interface expenses. Every week of installation downtime can forfeit USD 50,000 in throughput revenue, so operators stagger rollouts in micro-phases that preserve live lanes. Vendors now push modular pods that fit inside existing racks, trimming upfront cash burn and easing board-level approvals.
Fragmented Safety and Data-Privacy Regulations by Region
ISO 10218:2025 mandates new power-and-force-limiting thresholds, while U.S. ANSI/RIA R15.08 diverges on navigation safeguards, forcing global shippers to certify one fleet twice. GDPR rules oblige European warehouses to justify every sensor pixel captured near staff, adding legal review cycles to deployment timelines. Documentation hurdles raise program costs 15-25% and can extend launch by six months as firms reconcile overlapping standards.
*Our forecasts treat driver/restraint impacts as directional, not additive. The impact forecasts reflect baseline growth, mix effects, and variable interactions.
Segment Analysis
By Type: Mobile Robots Drive Flexible Automation
Mobile platforms edge forward with an 18.02% CAGR to 2031, eclipsing fixed industrial units for greenfield fulfillment projects. The warehouse robotics market size for mobile robots is projected to reach USD 10.74 billion by 2031 as retailers value layout agility that supports frequent SKU resets. Industrial six-axis arms still own heavy palletizing with 34.02% share, yet conveyor-less AMR strategies cut infrastructure costs 70% and shrink commissioning times from months to weeks. Parcel hubs favor high-speed sortation systems that already handle 40% more packages than pre-2024 baselines, while cube-based AS/RS lifts storage density fourfold in urban footprints. Integration layers now orchestrate mobile fleets, shuttles, and lifts under one scheduler to prevent aisle congestion and balance work queues.
The warehouse robotics market continues to showcase hybrid deployments where AMRs ferry totes to stationary arm clusters for high-dexterity picks. AI route engines re-plan paths every second to dodge obstacles and reduce robot idle to under 10%. Vendors position large-format floor AMRs for case movement and compact swarm bots for goods-to-person tasks, maximizing cube utilization. Industrial palletizers gain embedded vision that trims pattern design times 25% and improves load stability, vital for fragile EV battery packs. Collectively, multi-modal fleets future-proof operations against product-mix volatility.


By Function: Picking Dynamics Redefine Storage Norms
Storage still dominates with 38.05% slice of 2025 revenue, yet picking and sorting drives incremental value and will post an 18.11% CAGR to 2031. The warehouse robotics market share for advanced picking systems rises as goods-to-person principles cut worker walk distances 75%. Dynamic slotting algorithms reposition inventory overnight based on forecast demand, shrinking average pick span to 30 seconds. Edge latency now measures below 30 milliseconds, letting robots recalculate optimal routes mid-mission. Cross-dock nodes invest in robotic sorters that process e-commerce returns and re-inject goods into outbound flows the same day, limiting markdown erosion.
Predictive analytics tie demand data to AS/RS shuttle assignments, pushing high-velocity SKUs near ergonomic pick stations and lowering daily cycle-count labor. Robotics packaging cells adapt box size in real time, cutting corrugate waste 15% and optimizing truck fill rates. Split-case automation gains traction in grocery fulfillment where variable weight items challenge conveyor pacing. Operators view picking performance as the rate-limiting step, and capital therefore gravitates toward vision-equipped end-effectors and autonomous carts that close the gap.
By Component: Software Orchestration Becomes the Differentiator
Hardware claimed 70.05% of spending in 2025, but software revenues will outpace all other layers at an 18.44% CAGR through 2031. Operators realize that without intelligent orchestration, hardware utilization stalls at 60-65%. Unified control towers now issue fleet-wide missions, predict maintenance intervals, and harmonize traffic across brands. This flexibility prevents vendor lock-in by ensuring new robot models plug into common APIs. Predictive algorithms avert 40% of unexpected stoppages, extending asset life and boosting return on invested capital.
The warehouse robotics market size linked to software subscriptions is projected to surpass USD 4.47 billion by 2031 as robotics-as-a-service converts upfront licenses into monthly fees that scale with activity. Managed services bundles fold in 24/7 remote monitoring, on-site spares, and process-optimization sprints, letting lean organizations stay current without expanding head-count. Cloud visibility across multi-site networks supports cross-dock balancing, so under-utilized robots in one facility shift tasks to hotspots at another, squeezing additional capacity from existing fleets.
By End-User Industry: Automotive Challenges Retail Supremacy
Retail and e-commerce remained the biggest buyers in 2025 at 28.31%, but electrified-vehicle programs propel automotive to the fastest 17.96% CAGR. Lithium-ion battery packs require careful orientation and weight balancing, making robotic handling essential for safety and takt-time adherence. The warehouse robotics market size earmarked for automotive spares is forecast to breach USD 3.34 billion by 2031, bolstered by integrated manufacturing-to-warehouse control loops that automate just-in-time sequencing.
Food and beverage operators automate chilled zones, trimming energy usage 30% as robots move goods in narrow aisles that humans find uncomfortable. Pharma facilities extend robotics into serialization and tamper-evident packaging to obey stringent traceability mandates. Third-party logistics providers embed multi-tenant AMR fleets to guarantee 99.9% pick accuracy, a service-level edge in a commoditized sector. Electronics assemblers rely on ESD-safe grippers and clean-room-rated drives, underscoring niche growth opportunities for specialist vendors.
Geography Analysis
Asia Pacific retained 39.52% of global revenue in 2025 and is tracking an 17.94% CAGR to 2031 as Chinese makers export aggressively and regional wages climb. Local champions such as Geek+ shipped record volumes while Japan turned to robotics to offset an aging workforce and South Korea integrated AS/RS with smart factories under national industrial policy. India enters an acceleration phase on the back of government-backed automation subsidies that attract foreign direct investment.
North America ranks second and remains a bellwether for venture-backed innovation, channeling more than USD 2 billion into warehouse automation startups during 2024. U.S. big-box retailers pioneer micro-fulfillment and dark-store concepts, while Canada’s Toronto-Vancouver corridor scales robotics to relieve labor scarcity. Mexico benefits from near-shoring and deploys AMR-ready warehouses that cut landed costs for U.S. importers by 25%.
Europe lags headline growth yet maintains steady adoption. Germany leans on Industry 4.0 grants to fund integrated logistics cells for automotive suppliers. The United Kingdom prioritizes flexible systems that can realign to post-Brexit customs flows. France and the Netherlands act as pan-European gateways, investing in cube-storage to mitigate land constraints. The EU’s forthcoming AI Act will raise compliance costs yet elevate safety baselines, favoring established vendors with proven records.

Regulatory Landscape
Safety and compliance for warehouse robotics are shaped by international standards and region-specific workplace rules. ISO 3691-4:2023 provides a baseline safety framework for driverless industrial trucks and AMRs, requiring site-specific risk assessment before deployment, while ISO 10218-1:2025 and ISO 10218-2:2025 update safety requirements for industrial robots and their integration. In the United States, OSHA enforcement commonly relies on the OSH Act General Duty Clause where there is no robotics-specific federal standard, which increases the practical weight of documented risk assessments, training, and safeguards for mixed human-robot operations.
In Europe, compliance is increasingly driven by the overlap between machine safety and AI governance. AI literacy obligations under Article 4 of the EU AI Act have applied since February 2, 2025, affecting warehouse operators that use AI-enabled vision and optimization tools. The EU Machinery Regulation (EU) 2023/1230 applies starting January 20, 2027, and it tightens conformity expectations for AI-enabled machinery and safety components, adding another compliance layer for robotics OEMs and integrators selling into the EU.
Value Chain Analysis
The value chain runs from component suppliers (actuators, sensors, cameras, safety scanners, batteries, and compute) to robot OEMs (AMRs/AGVs, arms, sortation, and AS/RS), software providers (fleet management, orchestration, vision and picking, simulation/digital twins, and cybersecurity), systems integrators, and end users (retail and e-commerce, 3PL, food and beverage, automotive, electronics, and pharma). Recent partnerships show tighter coupling between robotics platforms and cloud and AI infrastructure. In April 2026, NEURA Robotics and AWS announced a strategic collaboration to integrate NEURA's cognitive robotics platform with AWS cloud and AI infrastructure, which reflects how AI toolchains and data pipelines influence deployment, monitoring, and continuous improvement.
Downstream, integrators and logistics operators increasingly procure solutions as modular systems with phased commissioning to limit brownfield disruption and integration risk. In June 2026, DSV and Exotec entered a strategic partnership in which Exotec equipped DSV's Venlo logistics center with a Skypod System using about 100 autonomous robots, illustrating how end users seek bundled hardware plus orchestration to deliver throughput and storage-density outcomes. Key bottlenecks include constrained availability of AI chips/GPUs that extend lead times for compute-heavy robots and perception stacks, and interoperability gaps tied to proprietary protocols and limited standards adoption (for example, VDA 5050), which can increase integration effort when facilities run multiple robot brands.
Competitive Landscape
More than 700 active suppliers keep margins tight, but consolidation is gathering pace. Amazon Robotics, Dematic, and Swisslog command entrenched footprints with broad portfolios, while innovators like Symbotic and Exotec win share by offering modular, high-throughput architectures. Zebra’s USD 350 million Photoneo buy embeds proprietary 3-D vision into scanners and lifts perceived differentiation. Symbotic’s purchase of Walmart’s internal robotics arm in January 2025 grants proprietary sortation IP and an anchor retail customer.
Technology head-to-head contests now pivot on AI path planning, latency control, and interoperability. Vendors pairing proprietary hardware with open APIs gain mindshare as operators mix brands inside single facilities. Robotics-as-a-service contracts give mid-tier players a financial edge, transferring ownership risk away from customers. White-space niches such as cold storage and hazardous goods remain ripe for entrants that can certify specialized payloads. Competitive intensity will continue, yet capital access and software stacks are emerging as the decisive victory levers.
Warehouse Robotics Industry Leaders
Kiva Systems (Amazon Robotics LLC)
TGW Logistics Group GMBH
Singapore Technologies Engineering Ltd (Aethon Incorporation)
InVia Robotics Inc.
ABB Ltd.
- *Disclaimer: Major Players sorted in no particular order

Market Opportunities and Future Outlook
Large greenfield programs and major retrofit projects create whitespace for robotics-equipped fulfillment and sortation centers that can justify end-to-end automation, from goods receipt through storage, picking, and outbound. In March 2026, Amazon Australia announced an investment of more than AUD 750 million in a 150,000 sqm robotics-equipped fulfillment center in Logan, Queensland (targeted for completion in 2028), reinforcing how network expansion and purpose-built sites support multi-robot deployments. Similar patterns are visible in the United States, where Amazon filed plans in July 2026 for a robotics-equipped sorting and fulfillment warehouse in Georgetown, Texas, creating demand for AMRs, sorting, and orchestration software in high-throughput parcel and e-commerce flows.
Another opportunity centers on higher-autonomy picking and heavy-payload movement, where new platforms and models reduce manual exception handling and reduce dependency on infrastructure. At Automate 2026, OMRON debuted LD-150 and LD-300 AMRs aimed at higher-throughput, narrow-aisle, and heavy-payload transport, signaling vendor attention to payload classes beyond tote movement. Alongside this, physical AI and vision-language-action approaches are moving into production use cases, such as Nomagic deploying a VLA model at Brack.Alltron in Switzerland (reported to reduce robot-caused human interventions by about 50%). That application expands the range of SKUs and tasks suitable for robotic picking cells, while increasing demand for simulation, data tooling, and multi-vendor orchestration that can operationalize these models across fleets.
Recent Industry Developments
- July 2026: ABB announced the inclusion of vSLAM navigation in its F712 autonomous forklift. The update advances infrastructure-light autonomy in warehouse vehicle automation, supporting deployments where changing layouts or mixed traffic make fixed navigation aids harder to maintain.
- June 2026: TGW Logistics Group began an automation project for a Lineage refrigerated warehouse facility in Hutchins, Texas, with completion targeted for end-2027. The project highlights continued investment in cold-chain automation, where consistent throughput and labor constraints in temperature-controlled environments favor high levels of mechanization and software-driven flow control.
- December 2024: Zebra Technologies acquired Photoneo for USD 350 million to secure 3D vision intellectual property. The move strengthens the perception layer used in robotic picking and inspection, and it supports tighter integration between machine vision and warehouse execution workflows across mixed fleets.


Research Methodology Framework and Report Scope
Market Definition and Coverage
For this report, the market covers robots and robotics-led automation systems deployed inside warehouses to move, store, pick, sort, and handle goods, along with the related control software and supporting services that make these systems usable at scale.
Scope exclusions: It does not count general factory-floor robotics used only for production lines, nor conventional material handling equipment that operates without robotic autonomy or warehouse-focused navigation.
Segmentation Overview
- By Type
- Industrial Robots
- Sortation Systems
- Conveyors
- Palletizers
- Automated Storage and Retrieval Systems (AS/RS)
- Mobile Robots (AGVs and AMRs)
- By Function
- Storage
- Packaging
- Trans-shipment
- Picking and Sorting
- By Component
- Hardware
- Software
- Support and Services
- By End-user Industry
- Food and Beverage
- Automotive
- Retail and E-commerce
- Electrical and Electronics
- Pharmaceutical
- Third-Party Logistics (3PL)
- Other End-user Industries
- By Geography
- North America
- United States
- Canada
- South America
- Brazil
- Argentina
- Rest of South America
- Europe
- Germany
- United Kingdom
- France
- Italy
- Rest of Europe
- Asia-Pacific
- China
- Japan
- South Korea
- India
- Rest of Asia-Pacific
- Middle East and Africa
- Middle East
- Saudi Arabia
- United Arab Emirates
- Turkey
- Rest of Middle East
- Africa
- South Africa
- Nigeria
- Rest of Africa
- Middle East
- North America
Data Sources, Market Sizing, and Validation
Desk Research
Desk research was used to set the outside boundaries of demand and to keep the numbers tied to observable warehouse activity. We referenced public sources such as OECD labor statistics, US Bureau of Labor Statistics wage and productivity series, US Census and Eurostat trade and inventory indicators, and customs trade releases where robotics and automation equipment is visible by category. We also used patents and publications in sources such as USPTO, WIPO, and peer-reviewed journals to understand where navigation, vision, and gripper improvements were making deployment easier.
Alongside this, we reviewed company filings, annual reports, investor presentations, association websites, and reputable press coverage to map product scope and typical revenue recognition patterns. When needed, subscriptions that aggregate company financials and track news were used to speed up cross-checking of revenue mix and expansion activity, and patent databases were used to verify technology direction. These sources are illustrative rather than exhaustive, and many other public and paid references were reviewed for data collection, validation, and clarification.
Primary Interviews and Surveys
Primary discussions were held with warehouse operators, system integrators, and robotics solution providers to validate adoption pace and to clarify how buyers split spending across hardware, software, and ongoing services. Since demand is global, inputs were checked across major logistics hubs in APAC, EMEA, and the Americas so the model reflects differences in labor costs, e-commerce intensity, and automation readiness.
Distribution of primary research fieldwork respondents
| Company type | Respondent position | Region |
|---|---|---|
| Top tier: 28% | CXOs: 16% | APAC: 46% |
| Mid tier: 56% | Functional/Unit leaders: 28% | EMEA: 36% |
| Smaller Players: 16% | Managers: 56% | Americas: 18% |
Market-Sizing & Forecasting
Sizing starts with a top-down build where warehousing activity and automation intensity are translated into a robotics demand pool by region, then filtered through typical deployment patterns by task type. After the demand pool is formed, it is split across key solution buckets seen in real warehouses, including mobile robots, AS/RS, sortation, conveyors, palletizing, and industrial robots used for warehouse handling.
To keep the model practical, a small set of inputs drives most of the work, and they are refreshed when new signals appear. These include warehouse space additions and throughput growth, e-commerce order volumes and SKU complexity, labor availability and wage inflation, automation capex trends, and typical price bands by system type (with software and service attach rates applied where contracts indicate recurring value). Forecasting is built using scenario analysis supported by interview-based consensus on adoption constraints, and then adjusted using simple time-series smoothing when historical growth is stable.
Results are corroborated with selective bottom-up approximations, such as sampled average selling prices times estimated unit deployments for AMRs and AS/RS projects, and channel checks on integration backlogs. Where bottom-up visibility is thin, gaps are handled by using conservative penetration ranges and rechecking them with operator and integrator feedback before totals are finalized.
Data Validation & Update Cycle
Outputs are validated through multiple checks so the final number is not driven by a single assumption. We compare the model against independent signals such as regional warehouse investment cycles, automation installation commentary, and the implied mix between hardware and recurring software or service revenue, and then investigate any sharp variances by task category or region.
Anomalies trigger a second pass where assumptions like ASP movement, deployment density, and currency conversion timing are reviewed, followed by peer review within the analyst team. The report is refreshed annually, and interim updates are made when material events occur, such as large shifts in logistics activity or notable changes in pricing and lead times. Before delivery, the dataset and key assumptions receive a final update pass so the view reflects the most recent information available.
Mordor Intelligence's Warehouse Robotics Market Sizing Compared With Other Published Estimates
Published market sizes for warehouse robotics often differ even when the topic label looks the same, since the boundary between robots, broader warehouse automation, and services is not treated consistently. Differences also show up when firms anchor to different base years, apply different currency conversion timing, or roll forward prices in ways that do not match how system contracts are structured.
In a refresh-led view, the spread is usually explained by how often pricing and mix assumptions are updated, and whether software and service attach rates are counted only when they are contracted for warehouse deployments. The table reflects these gaps, where a more frequently refreshed ASP and currency timing, combined with validation against task-level adoption signals, is what keeps Mordor Intelligence aligned to what warehouses are actually deploying in the current cycle.
Benchmark comparison
| Source | Market Size | Gaps in Research Methodology |
|---|---|---|
| Mordor Intelligence | USD 10.96 B (2026) | |
| Global Consultancy A | USD 7.35 B (2026) | This figure appears to use a narrower counted scope or more conservative price progression for major system types, which can understate value when software and service layers are attached to deployments. |
| Industry Research House B | USD 5.20 B (2024) | A different base year and a smaller starting demand pool can drive a lower value, especially if warehouse automation projects are counted only when robot hardware is shipped and not when integration and commissioning revenue is recognized. |
Taken together, the comparison suggests that timing choices and what gets counted around deployment-linked software and services explain most of the gap. By keeping assumptions traceable to warehouse activity indicators and rechecking key price and mix inputs, the estimate stays repeatable and easier to reconcile when clients map it to their own planning models.


Key Questions Answered in the Report
What is the current value of the warehouse robotics market?
The warehouse robotics market is valued at USD 10.96 billion in 2026.
How fast is the warehouse robotics sector growing?
It is projected to post a 17.5% CAGR, reaching USD 24.55 billion by 2031.
Which geographic region commands the largest share?
Asia Pacific leads with 39.52% revenue share, buoyed by China’s rapid robot adoption.
Which robot type is expanding the quickest?
Mobile robots, including AGVs and AMRs, are advancing at an 18.02% CAGR through 2031.
Which end-user segment is gaining ground fastest?
Automotive logistics shows the highest growth at an 17.96% CAGR due to EV battery handling needs.
Page last updated on:


