Market Overview
| Study Period | 2020 - 2031 |
|---|---|
| Forecast Data Period | 2026 - 2031 |
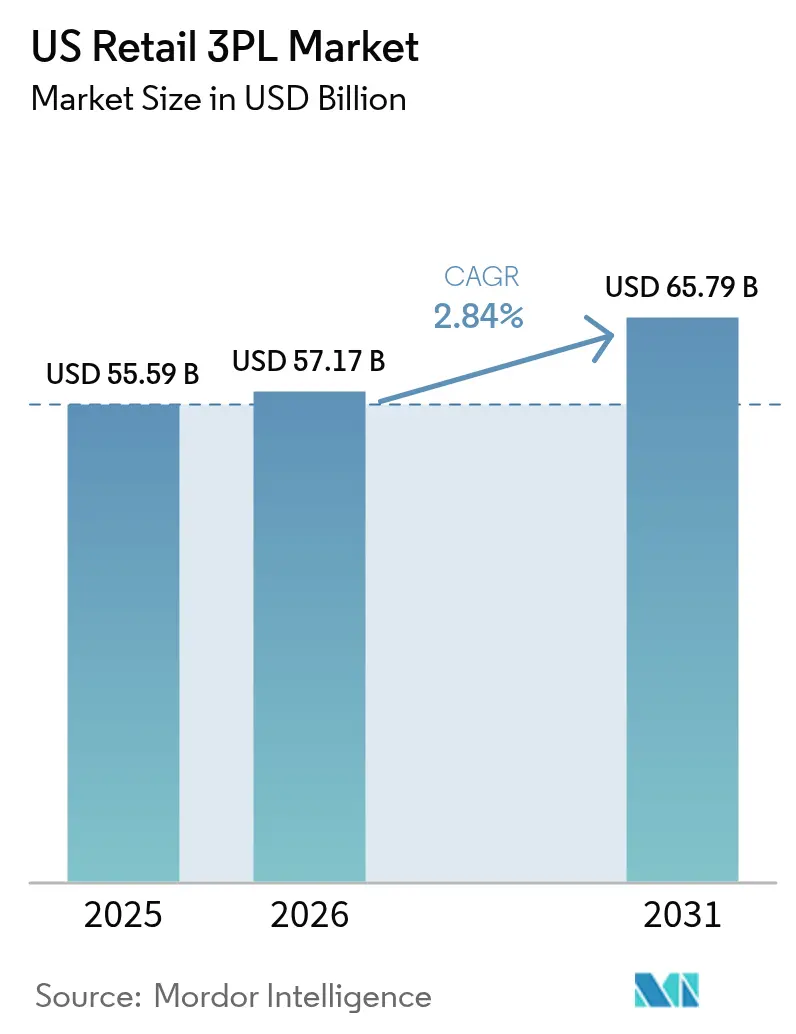
| Base Year Market Size (2025) | USD 55.59 Billion |
| Market Size (2026) | USD 57.17 Billion |
| Market Size (2031) | USD 65.79 Billion |
| Growth Rate (2026 - 2031) | 2.84% CAGR |
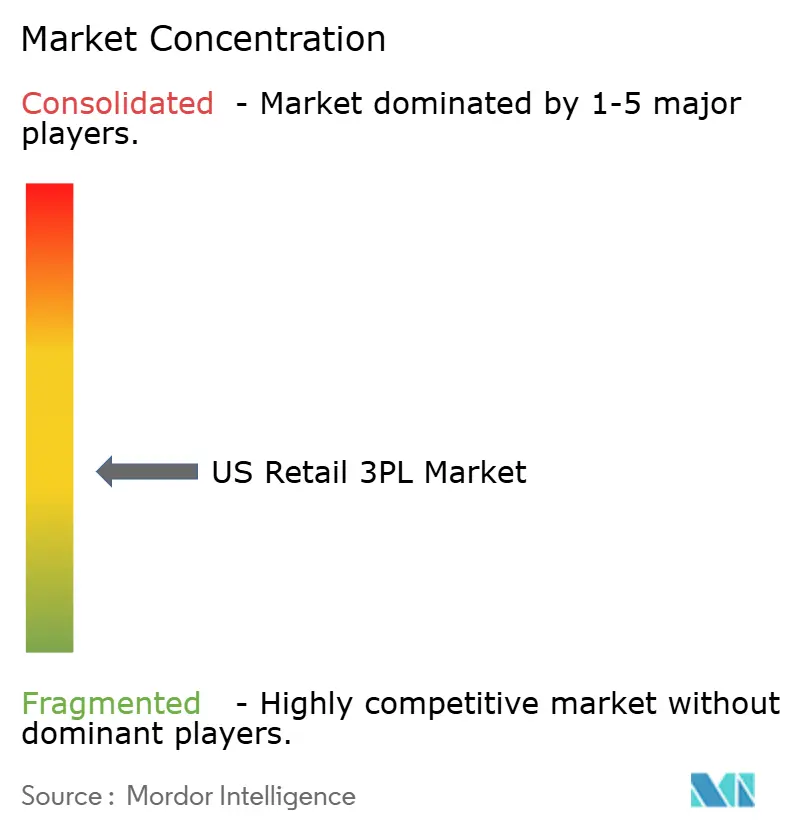
| Market Concentration | Medium |
Major Players *Disclaimer: Major Players sorted in no particular order Image © Mordor Intelligence. Reuse requires attribution under CC BY 4.0. | |
US Retail 3PL Market Analysis by Mordor Intelligence
The US Retail 3PL Market size in 2026 is estimated at USD 57.17 billion, growing from 2025 value of USD 55.59 billion with 2031 projections showing USD 65.79 billion, growing at 2.84% CAGR over 2026-2031. Moderate headline growth conceals a broad pivot toward high-value, specialized services that reward flexibility, speed, and data-rich execution rather than pure network scale. Micro-fulfillment assets close to population centers, multi-temperature warehousing solutions for fresh-food distribution, and AI-enabled reverse logistics workflows are emerging as clear differentiators. Providers able to combine those capabilities with hybrid asset strategies are winning new contracts as retailers juggle post-pandemic e-commerce normalization, inflation-induced margin pressure, and relentless same-day delivery promises. The Retail third-party logistics (3PL) market landscape is also being altered by a wave of consolidation among temperature-controlled and brokerage specialists, while automation investment is accelerating across every service tier to counter rising labor costs and last-mile inefficiencies.
Key Report Takeaways
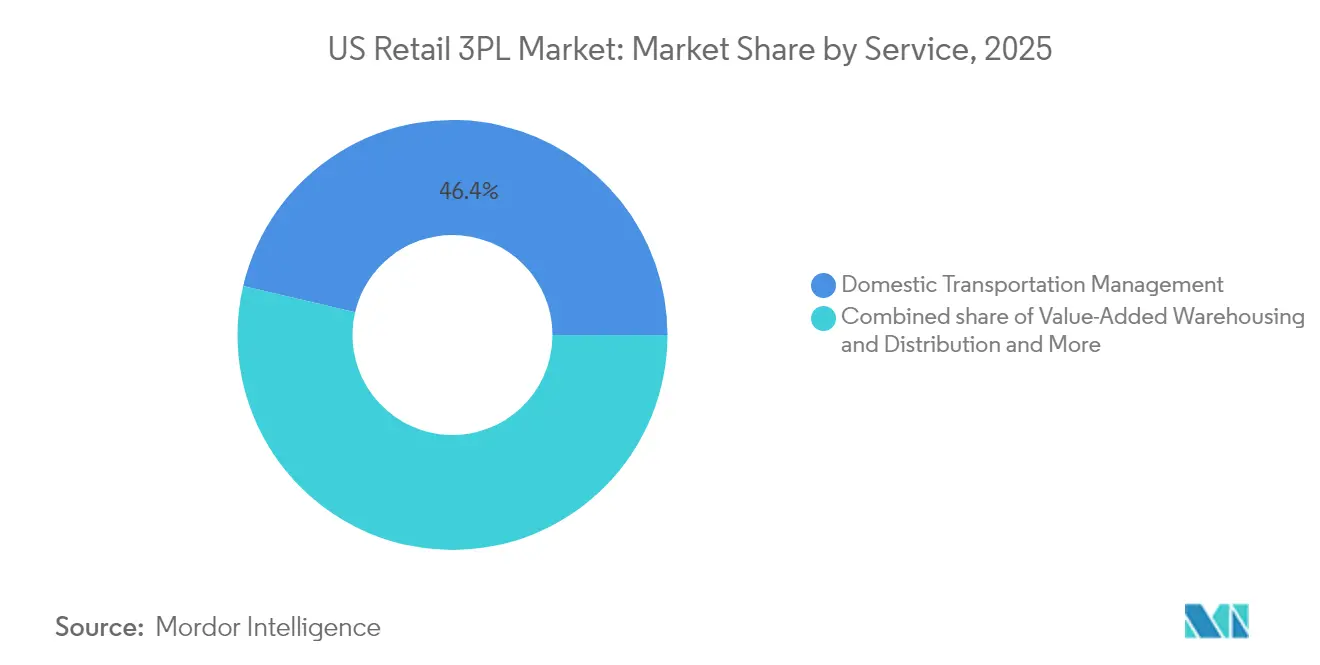
- By service, Domestic Transportation Management retained 46.35% of the US Retail third-party logistics market share in 2025. The US Retail third-party logistics market for Value-Added Warehousing and Distribution (VAWD) is forecast to expand at a 3.65% CAGR between 2026-2031.
- By product category, Foods and Beverages led with 27.60% of the US Retail third-party logistics market revenue share in 2025. The US Retail third-party logistics market for Fashion and Lifestyle is projected to grow at a 5.28% CAGR between 2026-2031.
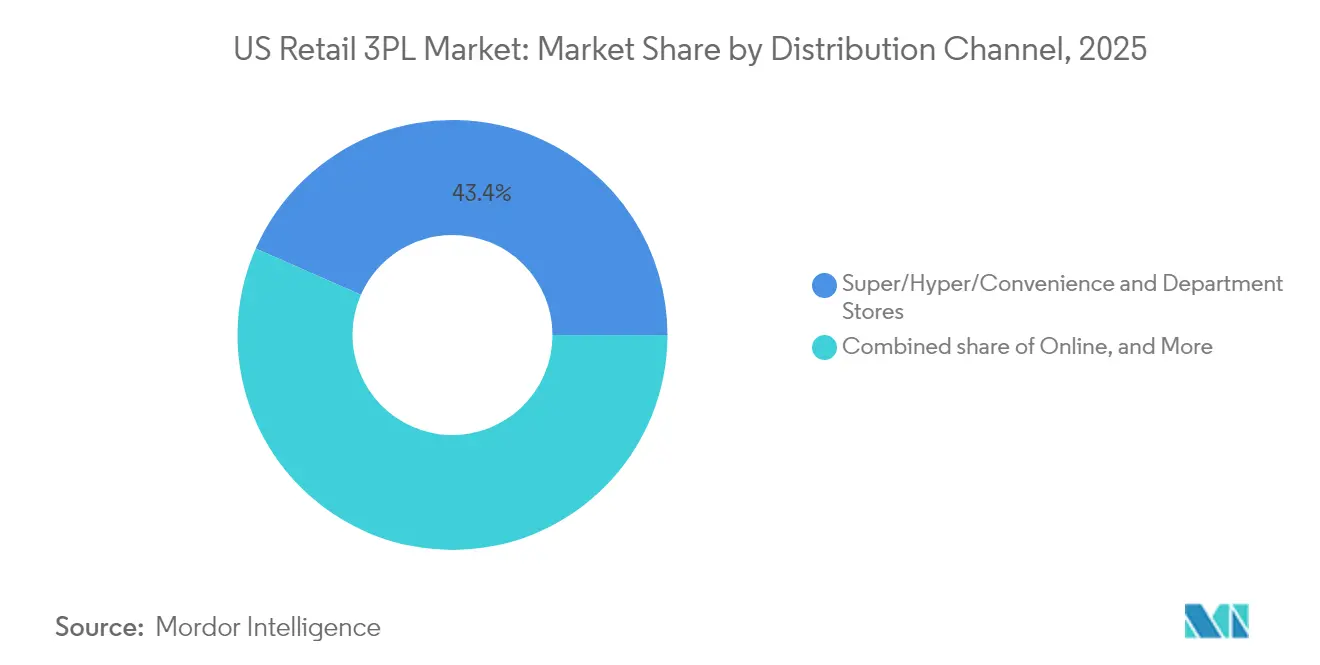
- By distribution channel, Super/Hyper/Convenience and Department Stores commanded 43.40% of the US Retail third-party logistics market size in 2025. The US Retail third-party logistics market for the Online channel is advancing at a 6.05% CAGR between 2026-2031.
- By logistics model, Asset-Light approaches held 49.20% of the US Retail third-party logistics market share in 2025. The US Retail third-party logistics market for the Hybrid model records the highest projected CAGR at 4.01% between 2026-2031.
- By geography, the Southeast captured 23.75% of the US Retail third-party logistics market size in 2025. In the US Retail third-party logistics market, the West is the fastest-growing region at a 3.38% CAGR over 2026-2031.
Note: Market size and forecast figures in this report are generated using Mordor Intelligence’s proprietary estimation framework, updated with the latest available data and insights as of 2026.
US Retail 3PL Market Trends and Insights
Drivers Impact Analysis*
| Driver | (~) % Impact on CAGR Forecast | Geographic Relevance | Impact Timeline |
|---|---|---|---|
| Hyper-local same-day delivery expectation | +0.8% | Northeast & West Coast metros | Short term (≤ 2 years) |
| Online fresh-food and meal-kit penetration | +0.7% | National (urban focus) | Medium term (2-4 years) |
| Fashion return-rate surge & reverse logistics | +0.5% | Nationwide | Medium term (2-4 years) |
| Store-based fulfillment & BOPIS adoption | +0.4% | High-density retail corridors | Medium term (2-4 years) |
| Peak-season flash-event volume spikes | +0.3% | Nationwide | Short term (≤ 2 years) |
| Source: Mordor Intelligence | |||
Hyper-local Same-day Delivery Reshapes Urban Logistics
Warehouse vacancy in primary U.S. metros fell to multi-year lows in 2024 as retailers raced to secure infill space required to meet same-day promises. Large-format leases signed by 3PLs accounted for 35% of total industrial activity, reflecting a strategic shift toward urban nodes that compress order-to-door times. The average last-mile delivery cost in dense urban zones reached USD 10.10 per package, up 12% year-over-year, prompting heavy investment in AI-driven routing tools that compress mileage and driver hours. Providers with proprietary micro-fulfillment designs can cut line-haul splits, reduce split-shipments, and capture premium pricing from omnichannel retailers searching for guaranteed same-day coverage.
Online Fresh-Food and Meal-Kit Purchases Drive Cold-Chain Expansion
U.S. consumers accelerated adoption of online grocery baskets in 2024, increasing demand for temperature-controlled square footage that can flex between frozen, chilled, and ambient zones. Major consolidators such as Lineage Logistics and Americold scaled networks through M&A, unlocking capital for high-density automation that sharpens temperature precision and trims energy cost curves. 3PLs bundling route-level telematics and real-time load monitoring are securing multi-year contracts from meal-kit providers that require two-hour delivery windows in metro cores.
Fashion Returns Accelerate Specialized Reverse Logistics
Online apparel return rates peaked between 40%-50% in 2024, turning reverse flows into a profit lever for logistics partners that can grade, refurbish, and restock inventory in days, not weeks. Major parcel carriers deepened their capabilities by acquiring tech-enabled platforms such as Happy Returns, enabling box-free drop-off processing at scale. Sophisticated 3PLs layer AI pattern analysis to predict size-related returns, adjusting outbound picking logic to lower future return incidence.
Store-based Fulfillment Alters Replenishment Flow
Seventy-two percent of large chains now run Buy Online, Pick Up In-Store (BOPIS) or ship-from-store programs, converting retail footprints into mini-DCs that demand daily, high-frequency replenishment. Michaels documented a 21% delivery-time reduction after shifting 4% more e-commerce orders to single-point store fulfillment, illustrating service upside for 3PLs offering channel-agnostic inventory orchestration[1]Retail TouchPoints Staff, “Michaels Elevates Ship-from-Store Fulfillment to Cut Delivery Times,” retailtouchpoints.com.
Restraints Impact Analysis*
| Restraint | (~) % Impact on CAGR Forecast | Geographic Relevance | Impact Timeline |
|---|---|---|---|
| Post-pandemic e-commerce normalization | -0.9% | Nationwide | Short term (≤ 2 years) |
| Consumer inflation fatigue on high-ticket goods | -0.5% | High-cost markets | Medium term (2-4 years) |
| “Green-miles” skepticism on cost pass-through | -0.3% | Coastal states | Long term (≥ 4 years) |
| Source: Mordor Intelligence | |||
Post-pandemic E-commerce Normalization
Domestic freight volumes contracted again in Q1 2025, with shipment indices down 13.8% year-over-year, leaving some 3PL networks over-capacitated[2]Logistics Management Staff, “U.S. Bank Freight Payment Index Q1 2025,” logisticsmgmt.com. Operators are consolidating micro-fulfillment footprints, sub-leasing unused cross-docks, and doubling down on cost-to-serve analytics to defend margins until demand rebounds.
Consumer Inflation Fatigue
Shipping fees triggered 67% of cart abandonments in 2024, eclipsing speed concerns, as shoppers prioritized price over delivery windows. Average order values for furniture and appliances slid 12.3%, forcing 3PLs to engineer lower-cost line-haul routings and revisit carrier mix strategies to stay aligned with tighter retailer budgets.
*Our forecasts treat driver/restraint impacts as directional, not additive. The impact forecasts reflect baseline growth, mix effects, and variable interactions.
Segment Analysis
By Service: VAWD’s Automation Edge Unlocks Value
Value-Added Warehousing and Distribution generated the fastest 3.65% CAGR outlook, even though Domestic Transportation Management accounted for the single-largest 46.35% revenue slice within the Retail third-party logistics market in 2025. Rising retailer appetite for inventory postponement, kitting, and direct-to-consumer pick-and-pack workflows elevates multi-temperature and high-velocity warehousing assets. The Retail third-party logistics market size allocated to VAWD is projected to widen its share as omni-inventory strategies gain traction. Providers combining robotics, automated storage and retrieval systems, and real-time warehouse execution software deliver cycle-time reductions that translate into measurable sell-through gains for clients. Retailers increased their outsourced warehousing penetration from 43% to 65%, underscoring a strategic handoff that favors 3PLs investing in next-generation fulfillment orchestration. In contrast, Transportation Management remains pivotal for long-haul replenishment yet faces margin compression as contract bid cycles intensify and shippers pursue mode optimization to counter softer freight indices. Still, freight brokerages that add procurement platforms and API-based tender visibility can capture incremental wallet share from smaller shippers. Over the forecast horizon, service differentiation rather than pure asset control is expected to reshape how the Retail third-party logistics market allocates capital.
Domestic Transportation Management specialists are re-positioning to provide end-to-end control tower visibility that syncs with warehouse management systems and returns networks. Standard truckload brokerage margins averaged in the low single digits during 2024, spurring providers to bolt on value-add segments such as cross-dock consolidation, pool distribution, and outbound parcel sortation. As contract rates stabilize, asset-light brokers that embed digital freight matching and predictive pricing algorithms can defend their share. Meanwhile, VAWD innovators that deploy goods-to-person robotics can lift picker productivity by 3-4 x relative to manual zones, enabling higher throughput without proportional headcount increases. Energy-efficient refrigeration investments are also critical because utility costs now account for 12% of total warehouse expense for chilled facilities. Integrating renewable power agreements and battery storage can carve 200-300 basis points off total operating costs, enhancing competitive bids for fresh-food contracts.


By Product: Fashion’s Reverse-Flow Complexity Fuels Growth
Foods and Beverages commanded 27.60% revenue in 2025, reflecting the category’s year-round velocity and temperature-sensitive handling needs. Yet Fashion and Lifestyle is slated for a 5.28% CAGR, the steepest among product silos, underpinned by surging e-commerce penetration, seasonal SKU turnover, and return-to-stock speed imperatives. Apparel returns hovering near 50% convert reverse logistics from cost center to premium service, widening margin pools for partners that can grade, steam, and re-package apparel within 48 hours. Garment-on-hanger transport, RFID pallet tracking, and value-added services such as personalization or embroidery amplify the need for specialists capable of tailoring facility layouts to apparel workflows.
Foods and Beverages will continue to anchor fixed-asset deployment, particularly in cold-chain nodes accessible to high-density coastal metros. Multi-tenant facilities equipped with zone-flexing racking systems allow providers to adjust temperature bands as product mix shifts. Personal and Household Care products require strict batch-lot traceability, driving demand for 3PLs certified under current good manufacturing practices. Furniture logistics centers handle outsized SKUs and white-glove final-mile crews trained in in-home assembly, while Electronics and Appliances push 3PLs to integrate secure cages, bonded zones, and lithium battery compliance protocols. Each sub-sector presents addressable white-space for niche entrants that pair category expertise with national reach.
By Distribution Channel: Online Surge Rewrites Fulfillment Playbooks
Brick-and-mortar Super/Hyper/Convenience and Department Stores still generated 43.40% of the Retail third-party logistics market share in 2025, yet the Online channel is expanding fastest at a 6.05% CAGR. Between 2026 and 2031, the Retail third-party logistics market size associated with pure-play e-commerce could rise by USD 9.4 billion as retailers double down on direct shipment and marketplace strategies. That acceleration flows directly into demand for parcel sortation hubs, pop-up overflow DCs, and data-driven last-mile routing platforms. Retailers leaning into ship-from-store are blending physical and digital channels; 60% of shoppers research offline before completing online transactions, blurring fulfillment boundaries.
Specialty store volumes remain resilient, but increasingly expect curated logistics programs that respect fragile, regulated, or high-value merchandise nuances. Club and outlet chains are piloting autonomous trailer unloading systems to shrink dwell times. Other niche channels, like subscription boxes and rental services, require reverse logistics orchestration nearly equal in scale to outbound flows. 3PLs that overlay configurable middleware APIs can funnel inventory data across disparate order management systems, ensuring synchronized allocations and avoiding expensive split shipments.
By Logistics Model: Hybrid Designs Marry Control and Flex
Asset-Light management-based models captured 49.20% revenue in 2025 by delivering brokerage agility without heavy balance-sheet exposure. Even so, the Hybrid model’s projected 4.01% CAGR highlights retailers' appetite for partners able to dial capacity up or down in response to flash-event volatility. Providers blending owned fleets with contracted capacity can guarantee baseline service while accessing spot resources when seasonal peaks hit. Technology that optimizes asset assignment based on real-time lane economics underpins hybrid success, allowing shippers to pivot modes and mix loads dynamically.
Asset-heavy carriers hold the advantage in temperature-controlled, high-security, or white-glove niches where specialized equipment and trained crews are gatekeepers. However, capital outlays for near-zero-emission fleets and solar-powered warehouses are intensifying. Hybrid providers mitigate that burden by pooling capital-intensive assets across diversified verticals, smoothing utilization. Over the forecast window, integrated network visibility platforms will blur model boundaries, letting retailers procure transport as an on-demand service layered atop variable storage capacity.
Geography Analysis
The Southeast generated 23.75% of the nationwide 2025 spend, leveraging port diversification, population inflows, and expansive intermodal corridors. Gateway nodes such as Savannah handled record TEU throughput, underpinning import-driven demand for transload and regional distribution services. Major 3PLs expanded cross-dock footprints along Interstate 95, positioning for accelerated e-commerce parcel splits destined for the Carolinas and Florida. State-level incentives for advanced manufacturing are also lifting inbound component volumes, reinforcing warehouse absorption trends.
The West is projected to outpace all regions at a 3.38% CAGR, buoyed by high-tech consumer bases, direct Asia-Pacific trade flows, and last-mile innovation ecosystems. Industrial vacancy in Los Angeles, Seattle, and Phoenix compressed below 3% in late-2024, keeping rents elevated and spurring multi-story facility developments. Intermodal lifts through the Southwest climbed growth of 22.3% in 2024 as shippers rerouted cargo via inland rail terminals to bypass congested ports. Sustainability mandates are also strongest on the West Coast, prompting 3PLs to pilot electric drayage fleets and rooftop solar installations that align with shipper ESG scorecards.
The Northeast combines dense urban consumer clusters with proximity to East Coast gateways, making it fertile ground for micro-fulfillment and same-day parcel networks. Congestion and real-estate scarcity amplify demand for creative vertical warehousing and off-hours delivery programs. The Midwest remains the nation’s supply-chain crossroads where north-south and east-west corridors intersect, making it ideal for national fulfillment campuses offering two-day reach to 80% of U.S. households. Southwest border crossings channel growing near-shoring volumes, with cross-border dray runs catalyzing warehouse growth in Texas. Each region’s distinct demographic and infrastructure profile compels 3PLs to tailor asset mix, labor strategy, and service menu accordingly.
Competitive Landscape
The United States retail third-party logistics market features a moderately fragmented ensemble of global integrators, category specialists, and technology-led disruptors. Scale leaders such as GXO Logistics focus on proprietary automation, data science, and multi-year contracts to protect their share[3]U.S. Securities and Exchange Commission, “GXO Logistics 2024 Annual Report,” sec.gov. Mid-sized temperature-controlled experts Lineage Logistics and Americold pursue network consolidation to expand cold-chain coverage and unlock capital for energy-efficient upgrades.
Acquisition momentum continued through 2024 with RXO acquiring Coyote Logistics for USD 1 billion, enlarging digital brokerage capabilities, while Knight-Swift absorbed Dependable Highway Express’s LTL division to strengthen western regional density. Providers are investing in cloud-native visibility suites that fuse transportation, warehousing, and returns into a single control tower view. Emerging platforms such as ShipMonk deploy SaaS models that integrate fulfillment and claims handling tools to attract high-growth direct-to-consumer brands. Competitive intensity is highest around reverse logistics, sustainability services, and last-mile orchestration, where white-space remains abundant and margin premiums are defensible.
Capital deployment is increasingly channeled toward robotics, AI-enabled planning, and carbon-tracking modules rather than green-field mega campuses. Logistics start-ups secure venture backing by offering carbon-neutral routing algorithms or subscription-based same-day networks. Traditional carriers respond by partnering with drone operators, evidenced by Walmart’s extension of Wing drone delivery to 100 additional stores covering five metros. Overall, the market rewards providers combining deep operational expertise with nimble technology layers that lower cost-to-serve and elevate retailer customer-experience metrics.
US Retail 3PL Industry Leaders
DHL Supply Chain
CEVA Logistics
AIT Worldwide Logistics
United Parcel Service, Inc.
C.H. Robinson Worldwide, Inc.
- *Disclaimer: Major Players sorted in no particular order

Recent Industry Developments
- May 2025: Walmart expanded its drone delivery program with Wing to 100 additional stores across five metro areas, building the nation’s largest aerial last-mile network.
- May 2025: Amazon signed a multi-year pact with FedEx for extra-large residential deliveries, reshaping parcel carrier share in bulky goods.
- April 2025: Michaels completed acquisition of JOANN intellectual property, adding 600 new SKUs and raising omnichannel logistics complexity.
- September 2024: RXO purchased Coyote Logistics from UPS for USD 1 billion to scale freight brokerage.


Research Methodology Framework and Report Scope
Market Definitions and Key Coverage
Mordor Intelligence defines the United States retail third-party logistics (3PL) market as the value generated when retailers outsource order fulfilment, domestic and international transportation management, warehousing, returns handling, and ancillary packaging services to specialist 3PL providers. Activities performed entirely in-house by retailers or by parcel integrators for non-retail clients are outside the stated boundary.
Scope exclusion: inbound raw-material logistics for manufacturers is not part of this study.
Segmentation Overview
- By Service
- Domestic Transportation Management
- Roadways
- Railways
- Airways
- Waterways
- International Transportation Management
- Roadways
- Railways
- Airways
- Waterways
- Value-Added Warehousing and Distribution (VAWD)
- Domestic Transportation Management
- By Product
- Foods and Beverages
- Personal and Household Care
- Fashion and Lifestyle (accessories, apparel, footwear)
- Furniture
- Electronics and Household Appliances
- Other Products
- By Distribution Channel
- Super/Hyper/Convenience and Department Stores
- Specialty Stores
- Online
- Other Channels
- By Logistics Model
- Asset-Light (Management-Based)
- Asset-Heavy (Own Fleet and Warehouses)
- Hybrid
- By Geography
- Northeast
- Midwest
- Southwest
- Southeast
- West
Detailed Research Methodology and Data Validation
Primary Research
Interviews and online surveys with logistics executives, regional 3PLs, omnichannel retailers, and parcel software vendors across the Northeast, Midwest, and West validated secondary ratios, clarified typical contract scopes, and highlighted pricing pressures stemming from labor shortages.
Desk Research
Our analysts screened authoritative, open datasets such as the U.S. Census Bureau's Annual Retail Trade Survey, Bureau of Transportation Statistics freight flows, National Retail Federation holiday-sales trackers, Federal Motor Carrier Safety Administration carrier capacity files, and Transportation Intermediaries Association quarterly benchmarks. Company 10-Ks, investor decks, and trade-press coverage supplied current revenue splits and contract wins that reveal service mix shifts toward value-added warehousing. Subscription tools, including D&B Hoovers for financials and Dow Jones Factiva for deal alerts, enriched competitor mapping. These sources, while illustrative, represent only a share of the material vetted for this assessment.
Market-Sizing & Forecasting
We initiated a top-down build. Retail merchandise sales by product class were aligned with estimated logistics-outsourcing penetration and split by service bucket, which are then cross-checked against carrier invoices, warehouse lease footprints, and sampled average selling prices multiplied by pallet throughput for a selective bottom-up sense-check. Key variables like e-commerce share of retail sales, reverse-logistics incidence, warehouse labor cost index, and contract renegotiation cycles influence both our 2024 baseline and forecasts. Multivariate regression with ARIMA overlays projects each driver through 2030. Expert interviews supplied consensus ranges where public data were thin, and any gaps in warehouse rate quotes were bridged using zone-weighted rental benchmarks.
Data Validation & Update Cycle
Outputs pass anomaly scanning, peer review, and a senior analyst sign-off. The model is refreshed annually, yet interim events, such as major M&A, new labor accords, or fuel-cost spikes, trigger a partial re-run before clients receive the file.
Building Confidence in Our US Retail Third Party Logistics Numbers
Published estimates often diverge because firms adopt different service baskets, pricing references, and update cadences.
Key gap drivers include: some studies fold in first-party grocery distribution, while others exclude returns processing altogether; several reports apply uniform margin mark-ups, inflating totals, while Mordor grounds conversion factors in observed contract rates; finally, many values reflect 2023 exchange rates, whereas our 2024 base is currency-adjusted and inflation-normalized.
Benchmark comparison
| Market Size | Anonymized source | Primary gap driver |
|---|---|---|
| USD 55.59 B (2024) | Mordor Intelligence | - |
| USD 51.94 B (2024) | Regional Consultancy A | narrows scope to transport and omits reverse logistics |
| USD 290.34 B (2024) | Global Consultancy B | aggregates all retail freight spend, including in-house fleets and parcel postage |
These comparisons show that Mordor's disciplined scope selection, variable-level modeling, and yearly refresh deliver a balanced, transparent baseline that decision-makers can replicate and stress-test with limited effort.


Key Questions Answered in the Report
What is the current size of the United States retail third party logistics market?
The market stands at USD 57.17 billion in 2026 and is projected to hit USD 65.79 billion by 2031.
Which service segment is growing fastest?
Value-Added Warehousing & Distribution is forecast to grow at 3.65% CAGR, outpacing transportation-focused services.
Why is the Fashion & Lifestyle vertical attractive to 3PLs?
E-commerce fashion generates high return rates, creating premium demand for sophisticated reverse logistics services and driving a 5.28% CAGR.
How are hybrid logistics models benefiting retailers?
Hybrid models blend owned and contracted assets, letting shippers secure baseline capacity while scaling flexibly during flash events, which supports a 4.01% CAGR.
Which U.S. region offers the strongest growth outlook?
The West region is projected to expand at 3.38% CAGR to 2031, boosted by tech-savvy consumers, Asia-Pacific trade flows, and sustainability mandates.
Page last updated on:


