Market Overview
| Study Period | 2020 - 2031 |
|---|---|
| Market Size (2026) | USD 272.29 Billion |
| Market Size (2031) | USD 316.73 Billion |
| Growth Rate (2026 - 2031) | 3.07% CAGR |
| Fastest Growing Market | Africa |
| Largest Market | Asia Pacific |
| Market Concentration | Medium |
Major Players *Disclaimer: Major Players sorted in no particular order Image © Mordor Intelligence. Reuse requires attribution under CC BY 4.0. | |
Rigid Plastic Packaging Market Analysis by Mordor Intelligence
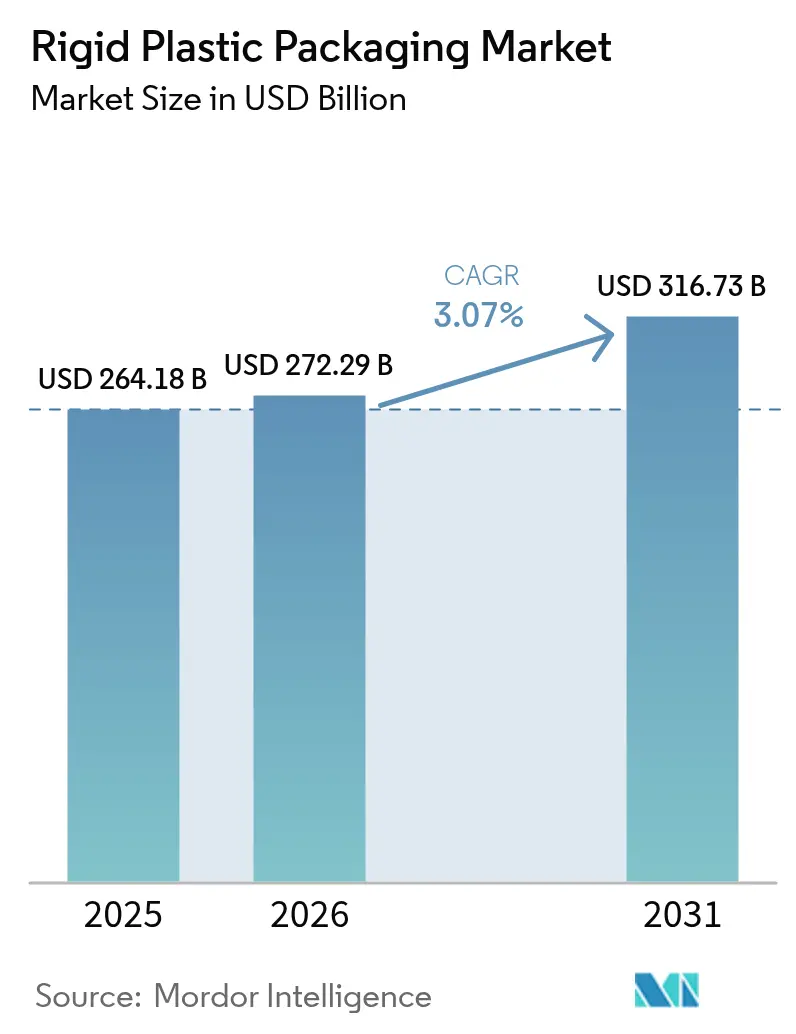
The rigid plastic packaging market size is projected to expand from USD 264.18 billion in 2025 and USD 272.29 billion in 2026 to USD 316.73 billion by 2031, registering a CAGR of 3.07% between 2026 to 2031. Brand-owner pledges for higher recycled content, e-commerce’s need for drop-resistant containers, and mandated design-for-reuse principles together reshape procurement strategies, margin structures, and capital spending patterns. Converters now chase scarce food-grade recycled resin, while retailers favor monomaterial designs that pass curbside sortation tests, and chemical producers migrate toward returnable intermediate bulk containers that slash transport waste. Polymer price swings are illustrated by the 18% spike in polyethylene during early 2025, with pressure converters having limited hedging power, yet vertically integrated recyclers cushion volatility. Meanwhile, AI-enabled vision systems reduce defect rates enough to justify ultra-thin walls, letting leaders trim resin intensity even as overall unit demand rises.
Key Report Takeaways
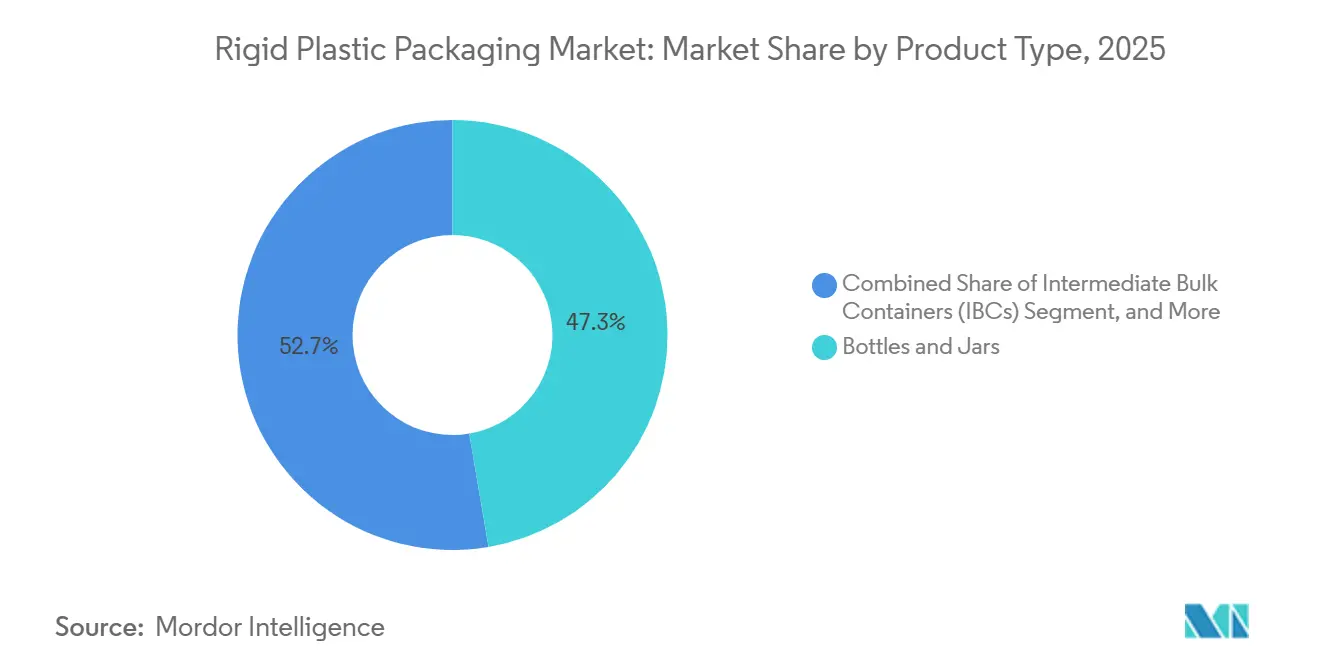
- By product type, bottles and jars led with 47.33% revenue share in 2025, while intermediate bulk containers are forecast to expand at a 4.11% CAGR through 2031.
- By material, polyethylene accounted for 34.87% of the rigid plastic packaging market share in 2025; polyethylene terephthalate is projected to grow fastest at 4.37% CAGR to 2031.
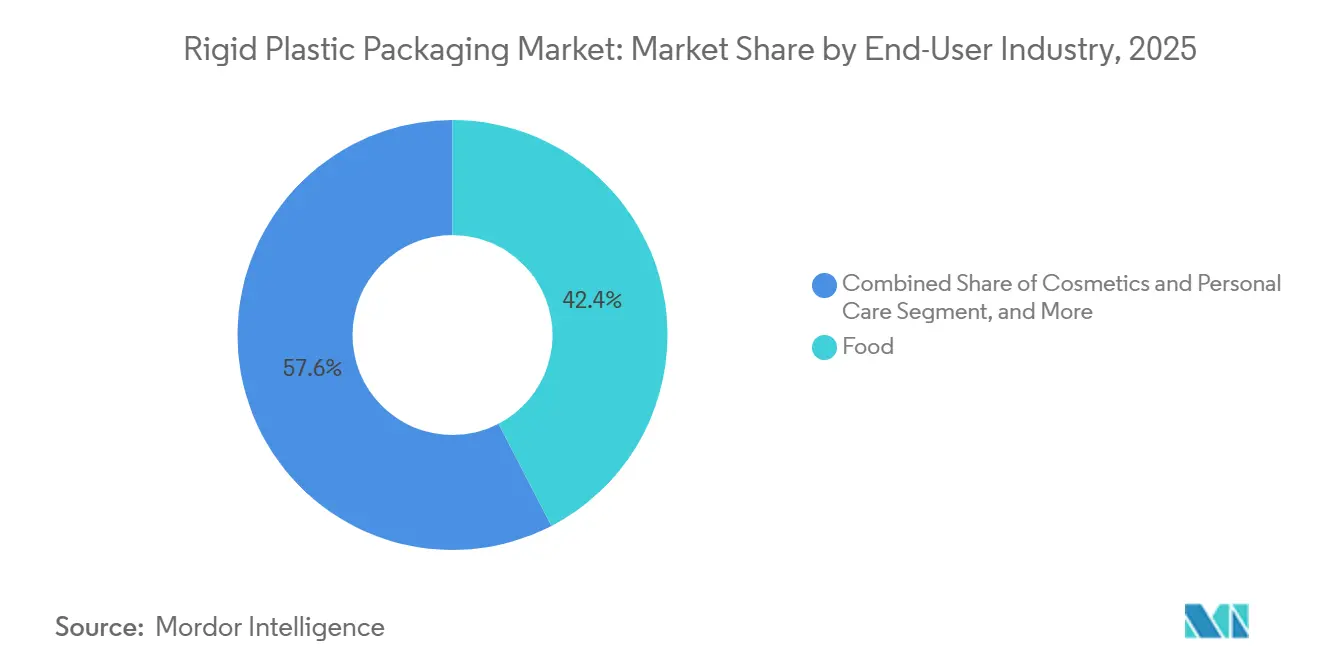
- By end-user industry, food applications captured 42.39% of sales in 2025, whereas cosmetics and personal care are advancing at a 4.74% CAGR over the same period.
- By manufacturing process, injection molding held 34.83% share of the rigid plastic packaging market size in 2025; stretch blow molding is set to record the highest 4.52% CAGR through 2031.
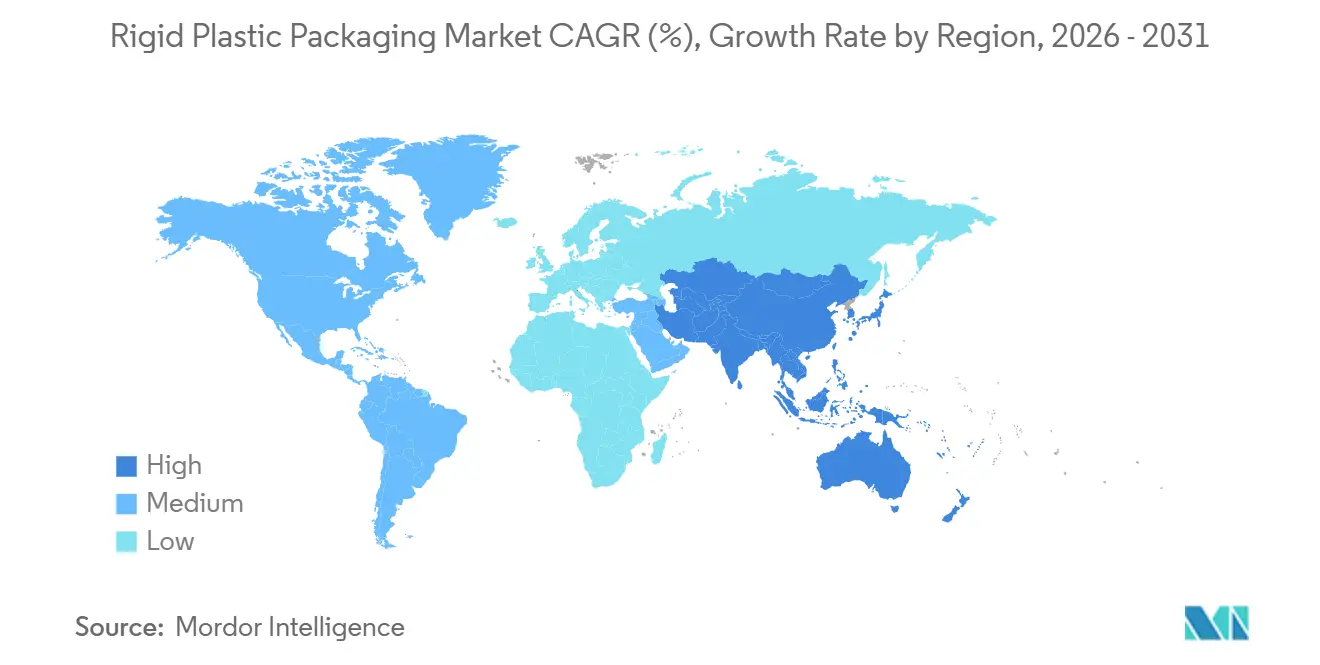
- By geography, Asia-Pacific commanded 42.69% of global demand in 2025, while Africa is poised for the quickest 4.16% CAGR up to 2031.
Note: Market size and forecast figures in this report are generated using Mordor Intelligence’s proprietary estimation framework, updated with the latest available data and insights as of 2026.
Global Rigid Plastic Packaging Market Trends and Insights
Drivers Impact Analysis*
| Driver | (~) % Impact on CAGR Forecast | Geographic Relevance | Impact Timeline |
|---|---|---|---|
| Circular-economy mandates driving recycled-content packaging demand | +0.8% | Europe, North America, Asia-Pacific (India, Japan, South Korea) | Medium term (2-4 years) |
| Surge in e-commerce accelerating demand for impact-resistant ship-ready formats | +0.6% | Global, with concentration in North America, Europe, China | Short term (≤2 years) |
| Demographic shift toward smaller households fueling single-serve rigid packs | +0.4% | North America, Europe, urban Asia-Pacific | Long term (≥4 years) |
| Adoption of high-barrier monomaterial solutions to meet 2027 EU recyclability targets | +0.5% | Europe, spillover to North America and Asia-Pacific | Medium term (2-4 years) |
| Expansion of refill-at-store ecosystems boosting demand for durable returnable rigid packs | +0.3% | Europe (France, Germany, Netherlands), pilot programs in North America | Long term (≥4 years) |
| AI-enabled vision systems reducing defect rates enabling ultra-thin-wall rigid containers | +0.2% | Global manufacturing hubs (China, Germany, United States) | Short term (≤2 years) |
| Source: Mordor Intelligence | |||
Circular-Economy Mandates Driving Recycled-Content Packaging Demand
European Regulation 2025/40 obliges beverage bottles to contain 25% recycled PET by 2025 and 30% by 2030, while India’s Plastic Waste Management rules push rigid formats to 60% recycling by 2026 and 80% by 2028.[1]European Commission, “Packaging and Packaging Waste,” EUROPA.EU Sorting shortfalls leave converters bidding premiums of 15-20% for certified food-grade resin, compressing margins in bottled water and dairy. Brand owners now co-finance deposit-return networks and chemical recycling ventures to secure feedstock, fostering multiyear offtake contracts that lock in supply at indexed pricing. These mandates also accelerate shifts toward monomaterial designs that meet recyclability criteria without multilayer complexity. As compliance deadlines near, procurement leverage tilts toward vertically integrated recyclers able to guarantee traceability, creating new entry barriers for smaller converters.
Surge in E-Commerce Accelerating Demand for Impact-Resistant Ship-Ready Formats
Global online grocery penetration climbed to 8.3% in the United States during 2025, raising the number of handling events each package endures. Drop-test results showed that polypropylene jars survived 1.5-meter drops with no leaks, whereas stand-up pouches failed in 12% of cases.[2]Institute of Packaging Professionals, “Drop-Test Performance Study,” IOPP.ORG Cosmetics giants, including L’Oréal, swapped flexible tubes for rigid HDPE bottles in subscription boxes to cut damage claims. The protective edge of rigid containers, however, raises transport emissions because weight rises 18-22%, creating tension with retailer carbon goals. Hybrid concepts with rigid bases with flexible overcaps are emerging to balance impact resistance, recyclability, and weight.
Demographic Shift Toward Smaller Households Fueling Single-Serve Rigid Packs
Average household size in OECD nations slipped to 2.3 persons in 2025.[3]Organisation for Economic Co-operation and Development, “Average Household Size,” OECD.ORG Single-portion yogurt cups, condiment jars, and mini beverage bottles consequently represent 34% of rigid plastic volumes in North America, versus 26% ten years ago. Portion control lifts package-to-product ratios, with a 150-gram yogurt cup using 6.2 grams of polystyrene compared to 1.8% for kilo tubs. Duty-free and hotel amenity channels amplify demand for travel-size rigid formats, propelling the cosmetics and personal care segment’s 4.74% forecast CAGR. France’s AGEC law banning single-use hotel toiletries from 2027 is expected to pivot demand toward refillable rigid dispensers.
Adoption of High-Barrier Monomaterial Solutions to Meet 2027 EU Recyclability Targets
Multilayer structures with EVOH and polyamide fail curbside sortation, prompting converters to embed barrier chemistry inside single-resin matrices. Dow’s RETAIN modifiers and Borealis’s Purpolen PP grades deliver oxygen and moisture barriers while allowing mechanical recycling. Early adopters such as Danone rolled out monomaterial yogurt cups despite a 10% cost uptick, prioritizing compliance and consumer preference for recyclable packs. Cost premiums are narrowing as capacity scales, and by 2027 these solutions are expected to dominate European condiments and dairy packaging.
Restraints Impact Analysis*
| Restraint | (~) % Impact on CAGR Forecast | Geographic Relevance | Impact Timeline |
|---|---|---|---|
| Escalating polymer price volatility compressing converter margins | -0.5% | Global, acute in regions dependent on imported resin (Europe, Southeast Asia) | Short term (≤2 years) |
| Increasing consumer shift to flexible and paper-based alternatives | -0.4% | North America, Europe, urban Asia-Pacific | Medium term (2-4 years) |
| PFAS and microplastics regulatory scrutiny limiting barrier-coating options | -0.3% | United States, European Union, Canada | Medium term (2-4 years) |
| Low adoption of advanced melt filtration restricting food-grade recycled resin availability | -0.2% | Global, particularly acute in Asia-Pacific and South America | Medium term (2-4 years) |
| Source: Mordor Intelligence | |||
Escalating Polymer Price Volatility Compressing Converter Margins
Polyethylene spot values oscillated between USD 0.62 and USD 0.89 per pound in 2025 after Gulf Coast hurricanes disrupted crackers. European polypropylene prices spiked 22% in early 2026 amid high gas costs. Converters on thin 8-12% EBITDA margins cannot fully pass through rapid surges because consumer-goods brands negotiate annual contracts. Smaller players processing under 50 kt per year pay 7-9% resin premiums versus majors, according to the Plastics Industry Association. Food-grade rPET offers no respite, trading at a 35% premium over virgin PET in 2026. The turbulence favors vertically integrated recyclers such as Plastipak that secure closed-loop supply at cost-plus terms.
Increasing Consumer Shift to Flexible and Paper-Based Alternatives
Paper cartons captured 14% of Europe’s liquid-food volumes in 2025, up from 11% in 2022, as Tetra Pak extended the ambient shelf life to nine months. Unilever moved 18% of Southeast Asian shampoo SKUs from rigid HDPE to pouches, reducing pack weight by 60% and transport emissions by 40%. Rigid formats still dominate pressure-sensitive categories carbonated beverages, aerosols, and returnable industrial containers, but lose share in sauces, detergents, and dry snacks, where flexibles equal rigidity in barrier terms. In markets with poor recycling, the disposal stigma attached to rigid plastics accelerates conversion to compostable or energy-recoverable substrates.
*Our forecasts treat driver/restraint impacts as directional, not additive. The impact forecasts reflect baseline growth, mix effects, and variable interactions.
Segment Analysis
By Product Type: Intermediate Bulk Containers Scale in Closed-Loop Logistics
Rigid plastic packaging market size for bottles and jars remained dominant at USD 125.14 billion in 2025, equal to 47.33% of total demand. Intermediate bulk containers, though only 6.5% of 2025 volume, are projected to achieve a 4.11% CAGR, riding chemical and pharmaceutical companies’ preference for 1,000-liter returnable units that withstand up to 100 refill cycles. Lightweight trays and containers continue to serve ready-meal and bakery needs, benefiting from microwave compatibility and tamper-evident seals. Pallets molded from recycled HDPE add 20-year service life and resistance to pests, supporting closed-loop automotive and building-materials shipping. Caps, closures, and dispensing systems, though representing 12% of tonnage, deliver premium margins through patented tamper-evident features, as demonstrated by Silgan’s 18% EBITDA on pharmaceutical closures.
Beyond volume, unit economics are reshaped by lightweighting. AI-assisted vision lets dairy cups trim wall thickness from 0.45 mm to 0.38 mm without stacking failures, saving 16% polystyrene. UN-certification for hazardous-goods IBCs mandates 15-20% thicker walls, while carbonated-drink bottles must pass ASTM burst tests. As a result, the rigid plastic packaging market will increasingly see revenue growth decouple from resin volume as reuse and lighter walls counterbalance rising unit counts.


By Material: Polyethylene Terephthalate Surges on Bottle-to-Bottle Loops
Polyethylene maintained 34.87% of 2025 sales thanks to HDPE’s chemical resistance and LDPE’s flexibility. Yet the rigid plastic packaging market sees polyethylene terephthalate poised for the swiftest 4.37% CAGR, spurred by beverage pledges to source 50% recycled PET by 2030. Closed-loop bottle-to-bottle systems scale across Europe and North America, with chemical depolymerization plants from Eastman supplying virgin-equivalent monomers. Polypropylene remains vital for heat-tolerant food trays and hinged caps, while regulatory bans on foam foodservice ware contract polystyrene volumes. Bioplastics, though only 2.1% of tonnage, capture mindshare in compostability debates. NatureWorks’ 75 kt PLA facility and Danimer’s PHA partnerships with Bacardi underscore biopolymer momentum, but high cost and limited heat tolerance curb penetration.
In the long run, the certainty of feedstock will determine the industry's frontrunners. While PE producers are turning to chemical recycling to tap into recycled feedstock, PET is already benefiting from the advantage of established bottle deposit systems. This integration of chemical recycling by PE producers aims to address the growing demand for sustainable materials, while PET's established systems provide a reliable supply of recycled content. Furthermore, policy signals, especially Europe's mandates on recycled content, strongly indicate that PET's adoption will surpass that of other resins in the rigid plastic packaging arena, driven by regulatory pressures and consumer demand for environmentally friendly packaging solutions.
By End-User Industry: Cosmetics and Personal Care Fastest Toward 2031
Food uses generated 42.39% of 2025 demand, anchored by dairy, ready meals, and fresh produce trays. Still, cosmetics and personal care will post the steepest 4.74% CAGR, as premium brands leverage glass-look PET for on-the-go formats and airport retail sets that command higher price per milliliter. Beverage lines continue to rely on PET and HDPE for carbonation safety and UV protection, with bottle weights dropping from 28 g to 23 g for 500 ml still water between 2020-2025. Healthcare maintains resilient margins due to ISO 15378 and FDA Part 211 compliance hurdles. Industrial users pivot to returnable IBCs and drums to curb single-use steel.
Refill-at-store ecosystems, championed by Carrefour and Waitrose, require rigid containers capable of 30-50 cycles, nudging brand owners to design heavier-duty packs. Loop’s 89% return rate in European pilots validates consumer acceptance, yet such formats still constitute less than 1% of packaged-goods volumes. If deposit-return infrastructure widens beyond beverages, cosmetics and household-cleaning categories may become key battlegrounds within the rigid plastic packaging market.
By Manufacturing Process: Stretch Blow Molding Wins Lightweighting Race
Injection molding produced 34.83% of 2025 units—principally caps, closures, and thick-walled jars—but stretch blow molding is forecast for a 4.52% CAGR, delivering the best strength-to-weight ratios. Two-stage SBM gives a 0.3 mm wall in 500 ml water bottles without burst failures, cutting PET use by up to 18%. Extrusion blow molding remains essential for handle-equipped HDPE jugs. Thermoforming feeds high-volume tray production yet generates 15-20% trim waste that must be reprocessed. Rotational molding tackles large hollow items like IBCs, trading longer cycle times for low tooling cost.
By 2025, 42% of Chinese injection molders had adopted in-line systems, outpacing Europe's 28% uptake. These vision-guided quality control systems are becoming increasingly popular due to their ability to enhance production efficiency and reduce defects. With defect rates dipping below 1%, converters are pushing the limits of wall-thinning. This maneuver is enabling the rigid plastic packaging market to see a rise in value, even as resin consumption levels off.
Geography Analysis
Asia-Pacific accounted for 42.69% of global revenue in 2025, underpinned by China’s approval of 8.5 million t ethylene capacity and India’s escalating recycling targets. Bottle-to-bottle PET plants from Suntory and Asahi lift Japan toward its 60% recycled-content goal for 2030. Southeast Asia attracts beverage FDI, yet only 34% of post-consumer plastic reaches formal recycling, limiting feedstock for food-grade loops. Africa is set for the fastest 4.16% CAGR, buoyed by Coca-Cola Hellenic’s USD 150 million PET plant in Nigeria and South Africa’s EPR law that shifts 80% of municipal collection cost onto producers. Currency constraints, however, inflate resin import costs by up to 18%.
In North America and Europe, retailers resist price hikes, leading to significant margin pressures amidst ongoing price volatility. California's SB 54 mandates 25% recycled content by 2032, aiming to enhance sustainability and reduce environmental impact in packaging. This regulation is expected to drive innovation in material sourcing and recycling processes. Meanwhile, Germany's VerpackG penalizes multilayer packs through fee modulation, encouraging manufacturers to adopt monomaterials at a faster pace to align with stringent environmental standards and reduce costs associated with non-compliance.
South America's perspective remains moderate; while Brazil's reverse-logistics mandate boosts collection efforts and promotes recycling initiatives, only 25% of municipalities currently operate selective programs, underscoring the need for broader infrastructure development and policy enforcement. This limited implementation hampers the region's ability to fully capitalize on recycling potential. In the Middle East, low-cost feedstock provides a competitive advantage for rigid plastic packaging production. However, water scarcity continues to constrain beverage market growth, which is a key driver for packaging demand. This challenge slows the overall expansion of the rigid plastic packaging market, despite the region's cost advantages in raw material sourcing.

Competitive Landscape
The rigid plastic packaging market remains moderately fragmented; top ten converters held roughly 35% of 2025 revenue. Amcor’s USD 1.5 billion acquisition of Berry Global’s health, hygiene, and nutrition films arm enlarged its pharmaceutical and dairy footprint, signaling a pivot toward scale economics in recycled-resin procurement and ESG reporting. Plastipak’s closed-loop recycling supplies 40% of its rPET need, shielding it from spot volatility and creating a trusted pathway for brand owner pledges. ALPLA’s Polish rPET plant and Sealed Air’s Prism line illustrate how feedstock security and e-commerce performance drive investment choices.
Technology adoption distinguishes leaders. AI-enhanced vision trims defect rates to 0.8%, enabling ultra-thin walls that shave 12-16% resin. Eastman’s USD 1 billion polyester renewal facility ups the ante, depolymerizing mixed waste into virgin monomers to overcome mechanical recycling limits. Dow lodged 14 applications in 2024-2025, while Borealis captured IP for oxygen-barrier PP. Smaller converters, lacking regulatory affairs bandwidth, struggle with 18-24-month approval timelines for novel food-contact materials, reinforcing a two-tier market within the rigid plastic packaging industry.
Companies that integrate recycling, leverage AI for quality control, and anticipate regulations are now leading the pack. These three pillars are crucial for defending profit margins through 2031. Meanwhile, untapped opportunities exist in refillable formats beyond beverages, such as personal care and household products, tamper-evident closures for medications to ensure safety and compliance, and smart labels that monitor the life cycles of containers, providing transparency and sustainability insights.
Rigid Plastic Packaging Industry Leaders
Amcor plc
Silgan Holdings Inc.
Sealed Air Corporation
Sonoco Products Company
Huhtamäki Oyj
- *Disclaimer: Major Players sorted in no particular order

Recent Industry Developments
- January 2026: Amcor completed its USD 1.5 billion takeover of Berry Global’s health, hygiene, and nutrition films division, adding 3.2 billion rigid units of annual capacity across North America and Europe.
- December 2025: ALPLA opened a EUR 50 million (USD 53 million) bottle-to-bottle recycling plant in Radomsko, Poland, bringing 35,000 t of rPET capacity online with 10-year offtake deals from Coca-Cola European Partners and Nestlé Waters.
- November 2025: Sealed Air debuted Prism Rigid Packaging, blending recycled HDPE with impact modifiers for Amazon grocery pilots that aim to cut corrugated use 40%.
- October 2025: Huhtamäki closed its polystyrene foam plant in Wattwil, Switzerland, reallocating EUR 35 million (USD 37 million) to PET and PP tray lines in Germany and Poland.


Global Rigid Plastic Packaging Market Report Scope
Rigid plastic packaging is hard, solid plastic packaging that maintains its shape and is used to store, protect, and transport products safely. Unlike flexible packaging, it does not bend or fold easily.
The Rigid Plastic Packaging Market Report is Segmented by Product Type (Bottles and Jars, Trays and Containers, Intermediate Bulk Containers, Pallets, Other Product Types), Material (Polyethylene, Polyethylene Terephthalate, Polypropylene, Polystyrene and Expanded Polystyrene, Bioplastics, Other Materials), End-User Industry (Food, Beverage, Healthcare, Cosmetics and Personal Care, Industrial, Building and Construction, Automotive, Other End-User Industries), Manufacturing Process (Injection Molding, Extrusion Blow Molding, Injection Blow Molding, Stretch Blow Molding, Thermoforming, Rotational Molding, Compression Molding), and Geography (North America, South America, Europe, Asia-Pacific, Middle East, Africa). The Market Forecasts are Provided in Terms of Value (USD).
By Product Type
| Bottles and Jars |
| Trays and Containers |
| Intermediate Bulk Containers (IBCs) |
| Pallets |
| Other Product Types |
By Material
| Polyethylene (PE) | High-Density Polyethylene (HDPE) |
| Low-Density Polyethylene (LDPE) | |
| Polyethylene Terephthalate (PET) | Virgin PET |
| Recycled PET (rPET) | |
| Polypropylene (PP) | |
| Polystyrene (PS) and Expanded Polystyrene (EPS) | |
| Bioplastics | Polylactic Acid (PLA) |
| Polyhydroxyalkanoates (PHA) | |
| Other Materials |
By End User Industry
| Food | Dairy |
| Confectionery and Bakery | |
| Ready Meals | |
| Beverage | Carbonated Soft Drinks |
| Bottled Water | |
| Alcoholic Beverages | |
| Healthcare | Pharmaceuticals |
| Medical Devices | |
| Cosmetics and Personal Care | |
| Industrial | |
| Building and Construction | |
| Automotive | |
| Other End-User Industries |
By Manufacturing Process
| Injection Molding |
| Extrusion Blow Molding |
| Injection Blow Molding |
| Stretch Blow Molding |
| Thermoforming |
| Rotational Molding |
| Compression Molding |
By Geography
| North America | United States | |
| Canada | ||
| Mexico | ||
| South America | Brazil | |
| Argentina | ||
| Rest of South America | ||
| Europe | United Kingdom | |
| Germany | ||
| France | ||
| Italy | ||
| Rest of Europe | ||
| Asia-Pacific | China | |
| Japan | ||
| India | ||
| South Korea | ||
| Rest of Asia-Pacific | ||
| Middle East and Africa | Middle East | United Arab Emirates |
| Saudi Arabia | ||
| Rest of Middle East | ||
| Africa | South Africa | |
| Egypt | ||
| Rest of Africa | ||
| By Product Type | Bottles and Jars | ||
| Trays and Containers | |||
| Intermediate Bulk Containers (IBCs) | |||
| Pallets | |||
| Other Product Types | |||
| By Material | Polyethylene (PE) | High-Density Polyethylene (HDPE) | |
| Low-Density Polyethylene (LDPE) | |||
| Polyethylene Terephthalate (PET) | Virgin PET | ||
| Recycled PET (rPET) | |||
| Polypropylene (PP) | |||
| Polystyrene (PS) and Expanded Polystyrene (EPS) | |||
| Bioplastics | Polylactic Acid (PLA) | ||
| Polyhydroxyalkanoates (PHA) | |||
| Other Materials | |||
| By End User Industry | Food | Dairy | |
| Confectionery and Bakery | |||
| Ready Meals | |||
| Beverage | Carbonated Soft Drinks | ||
| Bottled Water | |||
| Alcoholic Beverages | |||
| Healthcare | Pharmaceuticals | ||
| Medical Devices | |||
| Cosmetics and Personal Care | |||
| Industrial | |||
| Building and Construction | |||
| Automotive | |||
| Other End-User Industries | |||
| By Manufacturing Process | Injection Molding | ||
| Extrusion Blow Molding | |||
| Injection Blow Molding | |||
| Stretch Blow Molding | |||
| Thermoforming | |||
| Rotational Molding | |||
| Compression Molding | |||
| By Geography | North America | United States | |
| Canada | |||
| Mexico | |||
| South America | Brazil | ||
| Argentina | |||
| Rest of South America | |||
| Europe | United Kingdom | ||
| Germany | |||
| France | |||
| Italy | |||
| Rest of Europe | |||
| Asia-Pacific | China | ||
| Japan | |||
| India | |||
| South Korea | |||
| Rest of Asia-Pacific | |||
| Middle East and Africa | Middle East | United Arab Emirates | |
| Saudi Arabia | |||
| Rest of Middle East | |||
| Africa | South Africa | ||
| Egypt | |||
| Rest of Africa | |||


Key Questions Answered in the Report
What is the current value of the rigid plastic packaging market?
The rigid plastic packaging market size stood at USD 272.29 billion in 2026.
How fast is global demand for rigid plastic containers expected to grow?
From 2026 to 2031, demand is projected to advance at a 3.07% CAGR.
Which region leads consumption of rigid plastic packs?
Asia-Pacific accounted for 42.69% of global 2025 revenue, the largest regional share.
Which material is gaining share most rapidly in rigid packaging?
Polyethylene terephthalate is set for the swiftest 4.37% CAGR through 2031 due to bottle-to-bottle recycling loops.
What segment shows the highest growth in end-use industries?
Cosmetics and personal care packaging is forecast to expand at 4.74% CAGR on the back of travel-size and premium trends.
How concentrated is the supplier landscape?
The top ten converters control about 35% of revenue, reflecting moderate consolidation but ongoing opportunities for regional firms.
Page last updated on:


