Infertility Treatment Devices Market Size and Share
Market Overview
| Study Period | 2020 - 2031 |
|---|---|
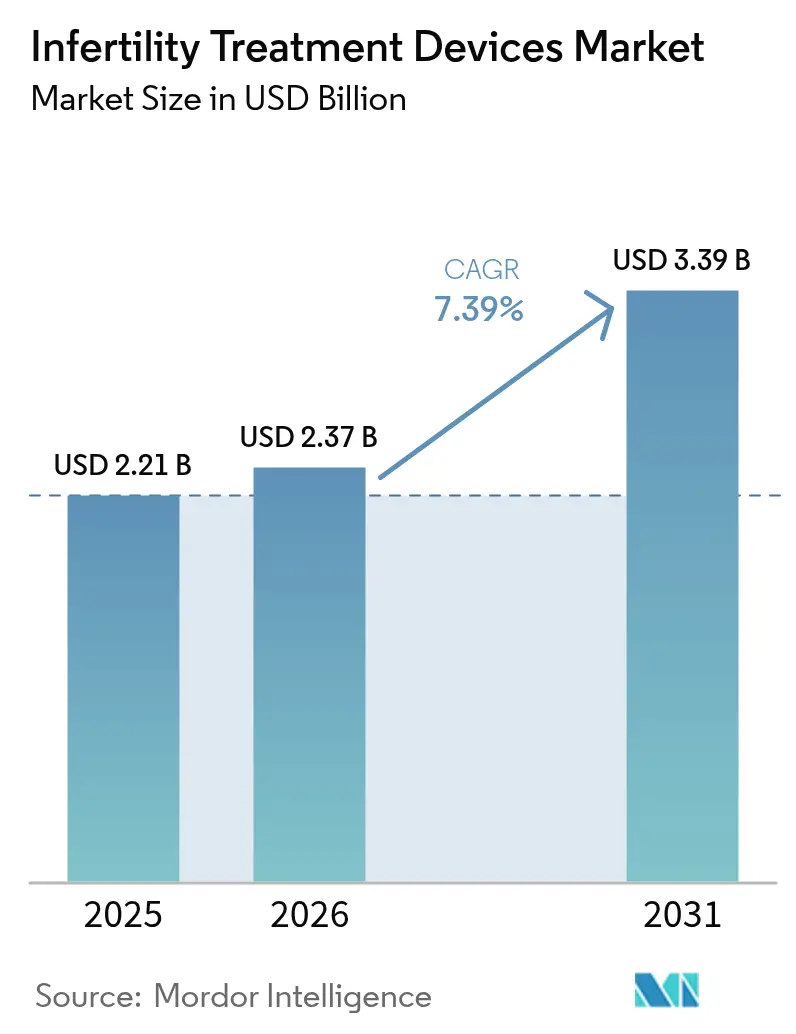
| Market Size (2026) | USD 2.37 Billion |
| Market Size (2031) | USD 3.39 Billion |
| Growth Rate (2026 - 2031) | 7.39% CAGR |
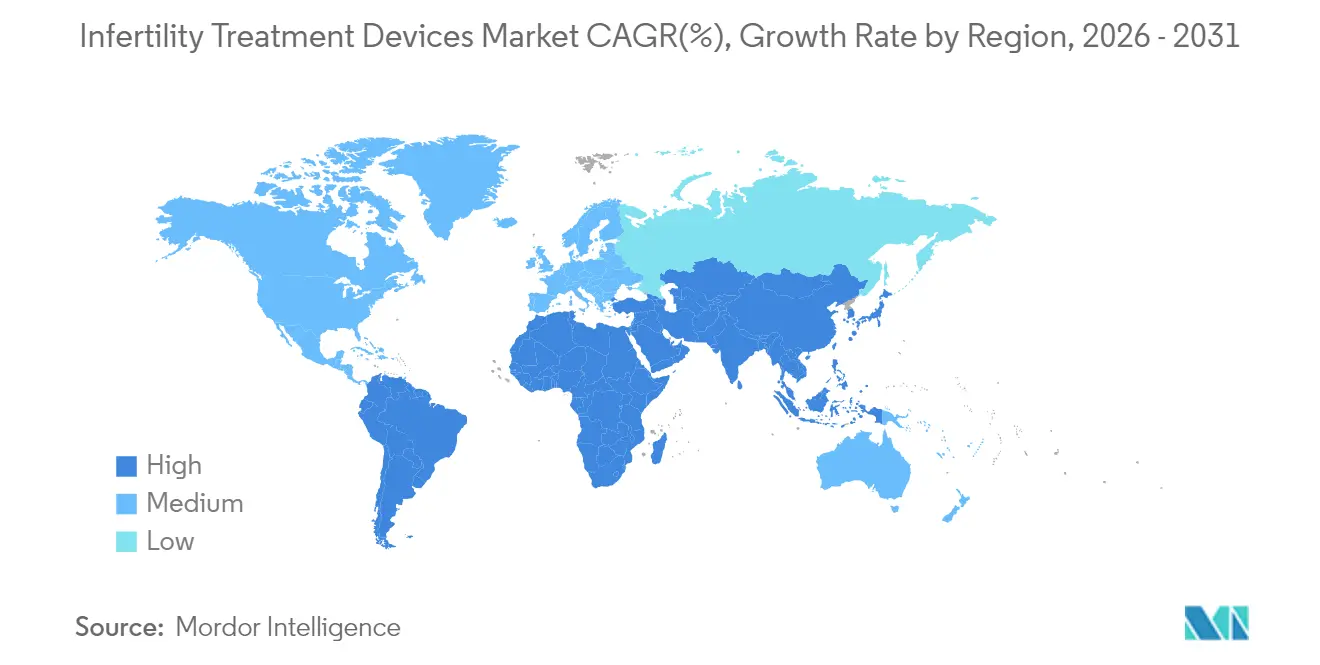
| Fastest Growing Market | Asia Pacific |
| Largest Market | North America |
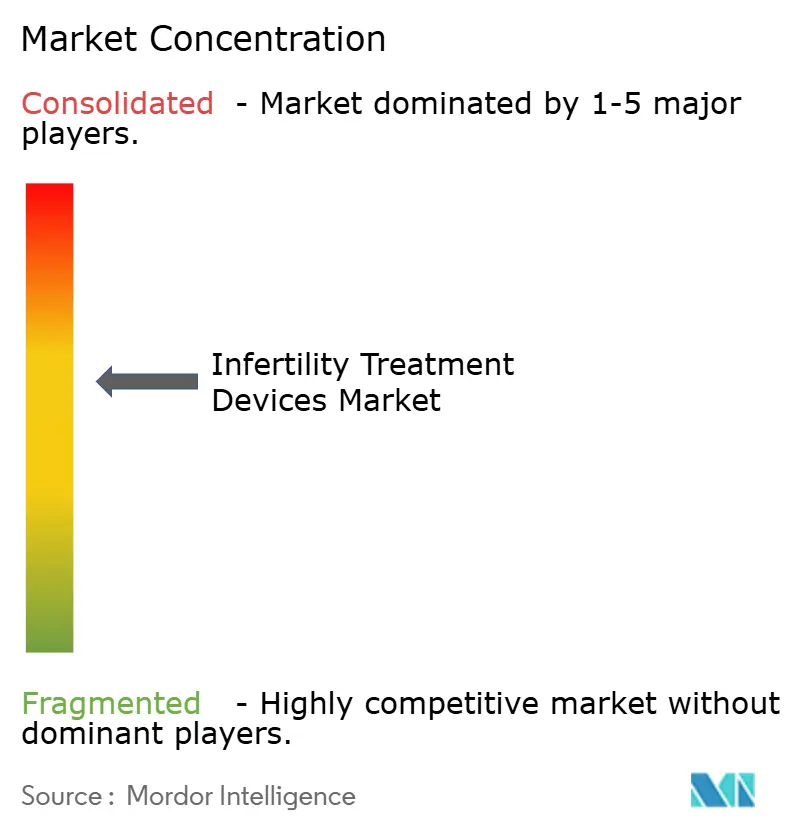
| Market Concentration | Medium |
Major Players *Disclaimer: Major Players sorted in no particular order Image © Mordor Intelligence. Reuse requires attribution under CC BY 4.0. | |
Infertility Treatment Devices Market Analysis by Mordor Intelligence
The infertility treatment devices market size is expected to grow from USD 2.21 billion in 2025 to USD 2.37 billion in 2026 and is forecast to reach USD 3.39 billion by 2031 at 7.39% CAGR over 2026-2031. Consistent global infertility prevalence, the rapid rollout of AI-enabled embryo-selection tools, and broader reimbursement in high-income nations underpin this expansion. Automation has become the core theme, with robotics streamlining in-vitro fertilization (IVF) workflows and driving down per-cycle labor costs while boosting laboratory throughput. Premium centers in North America and Western Europe prioritize fully integrated AI platforms, whereas clinics in Asia-Pacific focus on affordable modular upgrades that bridge manual and automated steps. Industry consolidation has accelerated because scale and software talent increasingly dictate product development velocity and regulatory readiness.
Key Report Takeaways
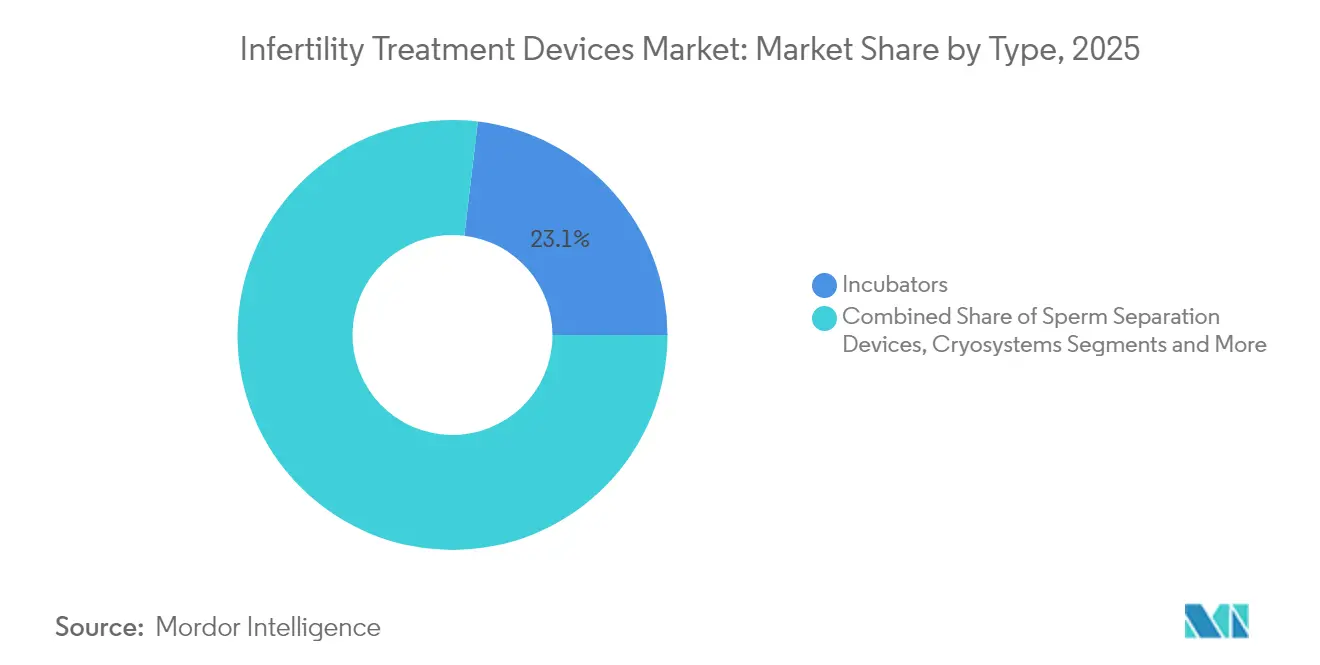
- By device type, incubators led with 23.12% of infertility treatment devices market share in 2025, while microfluidic sperm-sorting chips are advancing at a 11.78% CAGR to 2031.
- By ART procedure, in-vitro fertilization accounted for 70.61% of the infertility treatment devices market size in 2025, whereas pre-implantation genetic testing support is rising at a 10.05% CAGR.
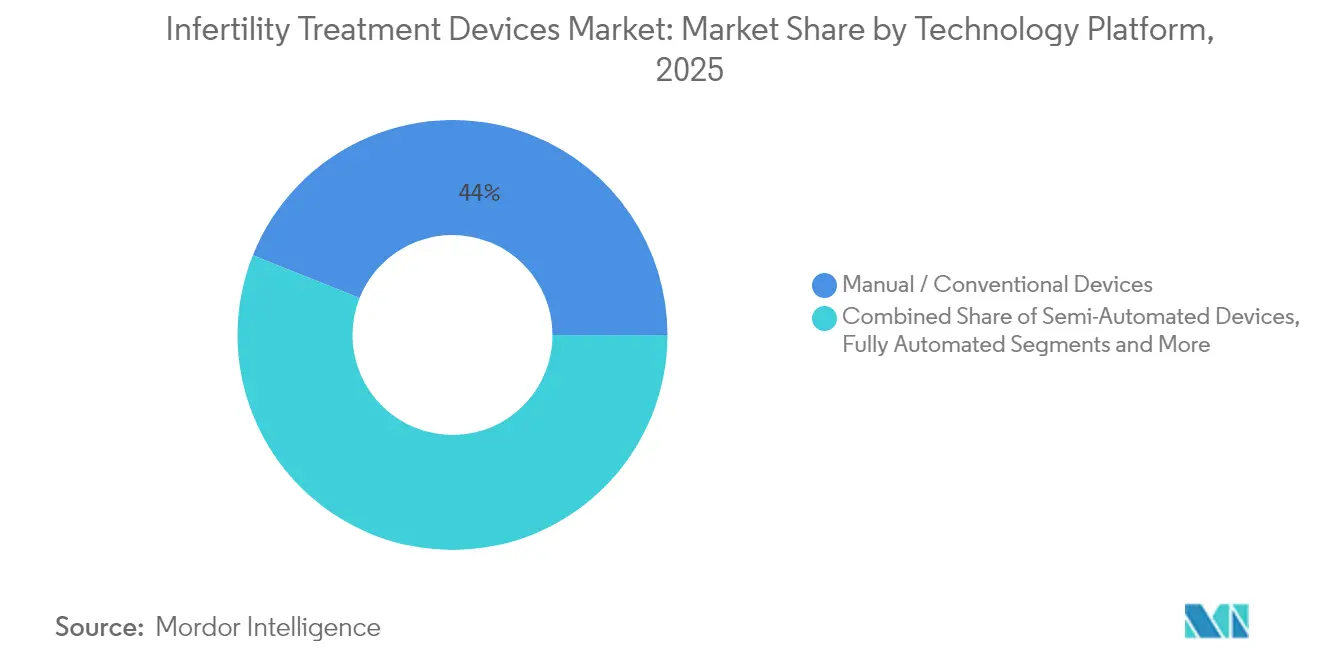
- By technology platform, manual and conventional devices contributed 43.95% of 2025 revenue, yet AI-enabled imaging and analytics platforms are expanding at an 11.42% CAGR.
- By end user, fertility clinics held 59.12% of 2025 revenue, while clinical research institutes exhibit the highest 10.39% CAGR through 2031.
- By geography, North America secured 32.15% revenue share in 2025; Asia-Pacific posts the strongest 9.23% regional CAGR through 2031.
Note: Market size and forecast figures in this report are generated using Mordor Intelligence’s proprietary estimation framework, updated with the latest available data and insights as of 2026.
Global Infertility Treatment Devices Market Trends and Insights
Drivers Impact Analysis*
| Driver | (~) % Impact on CAGR Forecast | Geographic Relevance | Impact Timeline |
|---|---|---|---|
| Escalating global infertility prevalence | +1.2% | Global, highest in developed markets | Long term (≥ 4 years) |
| Rising maternal age & delayed parenthood | +1.0% | North America & EU, expanding to urban APAC | Medium term (2-4 years) |
| Wider reimbursement for ART | +0.8% | North America & EU core, selective APAC markets | Medium term (2-4 years) |
| AI-enabled embryo-selection breakthroughs | +1.5% | Global, early adoption in North America & EU | Short term (≤ 2 years) |
| Launch of advanced products and their uptake | +1.1% | Global, concentrated in tier-1 fertility centers | Short term (≤ 2 years) |
| Surge in home-based fertility hardware | +0.7% | North America & EU, emerging in APAC | Medium term (2-4 years) |
| Source: Mordor Intelligence | |||


Escalating Global Infertility Prevalence
Roughly 17.5% of adults now face fertility challenges, a figure that has elevated demand for assisted reproductive technologies in every region. Lifestyle stressors, environmental toxins, and occupational hazards have widened male-factor diagnoses, and protein-specific defects such as CFAP47 mutations are now directly linked to asthenozoospermia, spotlighting new diagnostic frontiers.[1]Cell Research, “In situ structure of the mouse sperm central apparatus reveals mechanistic insights into asthenozoospermia,” nature.comAs fertility status grows into a broader health marker, primary-care providers add baseline reproductive assessments, enlarging the infertility treatment devices market beyond traditional IVF clinics. This mainstreaming fuels procurement budgets for connected analyzers and automated lab modules even in hospital settings. Continuous monitoring technologies also support early intervention, fostering preventive care that ultimately enlarges the patient funnel.
Rising Maternal Age & Delayed Parenthood
Women aged 35 and older represent the fastest-growing treatment cohort, requiring sophisticated egg-quality metrics to offset chromosomal risks inherent to advanced maternal age. Non-invasive AI tools such as STORK-A now predict aneuploidy with 70% accuracy, shrinking reliance on invasive genetic tests.[2]NewYork-Presbyterian, “AI-Based Technology Emerges as New Tool for Embryo Evaluation and Selection,” nyp.org Handheld estradiol testers from the University of Chicago deliver lab-grade results in 10 minutes at USD 0.55 per test, supporting at-home cycle tracking.[3] University of Chicago, “At-home hormone testing aims to transform fertility care,” uchicago.edu Emergency oocyte cryopreservation protocols have improved but still depend heavily on how long patients have attempted conception, magnifying the timing challenge tied to delayed childbearing. Together, these dynamics push clinics to invest in AI-assisted imaging systems and hormone analyzers that extend laboratory insight beyond brick-and-mortar walls.
Wider Reimbursement for ART
The U.S. Federal Employee Program introduced ART benefits in 2024 with annual limits of USD 25,000, marking a policy shift that frames infertility as a medical necessity rather than an elective choice. Coverage expansion improves patient affordability and encourages volume purchasing of advanced lab systems. Reimbursement disparities persist—Singapore averages USD 10,200 per IVF cycle, whereas India offers comparable care at USD 2,700—stimulating fertility tourism within Asia-Pacific. Corporate benefit programs also standardize prior authorizations for IVF medications, providing predictable demand signals that attract device manufacturers. Predictability, in turn, drives capital investment into hardware that delivers measurable, reimbursable outcome improvements.
AI-Enabled Embryo-Selection & Imaging Breakthroughs
Artificial intelligence has shifted embryo grading from visual heuristics to data-driven scoring models, improving implantation odds and reducing subjective variation. Columbia University’s STAR platform captured 8 million sperm images in under an hour, facilitating conception in azoospermic cases once deemed untreatable. Time-lapse algorithms now forecast blastocyst viability by embryonic day 3 with ROC AUC levels of 0.87 or higher. The first live birth from a fully automated, remote ICSI system shows all 23 injection steps can be standardized without lowering success. Genetic optimization software ranks up to 20 embryos against 900 hereditary conditions, broadening pre-transfer risk management. Collectively, these gains redefine clinical best practice and accelerate adoption of connected imaging workstations.
Restraints Impact Analysis*
| Restraint | (~) % Impact on CAGR Forecast | Geographic Relevance | Impact Timeline |
|---|---|---|---|
| High procedure & equipment costs | -1.8% | Global, most severe in emerging markets | Long term (≥ 4 years) |
| Stringent ethical/regulatory hurdles | -1.2% | Variable by region, strictest in conservative markets | Medium term (2-4 years) |
| Shortage of skilled embryologists & technicians | -0.9% | Global, acute in emerging markets | Short term (≤ 2 years) |
| Supply-chain fragility for critical consumables | -0.7% | Global, concentrated in specialized materials | Short term (≤ 2 years) |
| Source: Mordor Intelligence | |||
High Procedure & Equipment Costs
An IVF cycle in developed markets often exceeds USD 20,000, pricing out households lacking robust insurance coverage. Setting up a modern IVF laboratory demands clean-room build-outs and capital-intensive robotics, investments smaller hospitals struggle to justify. Material shortages in 2024 raised PTFE catheter costs, forcing vendors to pass increases to end users and squeezing clinic margins. Automation promises lower per-cycle expenses long term, yet paradoxically requires the highest upfront capital outlay today. Consequently, adoption lags in cost-sensitive regions, reinforcing a two-tier global care model.
Stringent Ethical / Regulatory Hurdles in Many Countries
Europe’s Medical Device Regulation 2017/745 can delay product launches by up to 18 months, and the U.S. FDA’s Class II designation for IVF hardware necessitates extensive 510(k) submissions. Policymakers also debate AI-led embryo ranking amid worries about commodification, creating uncertain oversight frameworks. Brazil’s acceptance of foreign regulatory approvals offers relief, but many emerging markets still impose fragmented pathways. Compliance costs slow innovation cycles and reduce smaller firms’ ability to scale rapidly.
*Our forecasts treat driver/restraint impacts as directional, not additive. The impact forecasts reflect baseline growth, mix effects, and variable interactions.
Segment Analysis
By Type: Automation Drives Microfluidic Innovation
Incubators generated 23.12% of 2025 revenue and remain indispensable for optimal embryo culture. High-end models feature integrated cameras and AI scoring modules that synchronize developmental events with environmental logs, refining protocol adjustments in real time. Microfluidic sperm-sorting chips post a 11.78% CAGR because they isolate motile sperm with minimal shear stress, enhancing fertilization probabilities. Sperm analyzers exploit AI image recognition to classify morphology more consistently than manual microscopy, boosting diagnostic confidence. Ovum aspiration pumps now integrate pressure sensors that safeguard oocyte integrity during retrieval, an upgrade that reduces procedural complications. Cryosystems grow steadily, supported by rising oncofertility and elective egg freezing demand that rewards robust vitrification performance. Imaging systems evolve toward time-lapse modalities; Vitrolife’s EmbryoScope+ embeds iDAScore algorithms for autonomous ranking, standardizing lab performance. Compact hybrid microscopes such as Opto’s DualStation free bench space while enhancing ergonomics. Robotic micromanipulators facilitate fully automated intracytoplasmic sperm injection, minimizing operator fatigue and error. Adjacent innovations, including medical microrobots for gamete transport and RFID-tagged cryostorage racks, broaden the infertility treatment devices market by solving workflow bottlenecks.
The second-mechanism growth narrative hinges on precision and cost efficiency. Clinics that deploy microfluidic chips report shorter processing times and reduced reagent use, enabling higher cycle throughput without expanding lab footprints. Automated incubators equipped with predictive maintenance dashboards cut downtime and extend service intervals, a key benefit for high-volume urban centers. Imaging-rich incubators also supply datasets that retrain local AI models, helping centers tailor scoring criteria to demographic nuances. Together, these upgrades advance standardization, unlock economies of scale, and reinforce the competitive edge of early adopters.


By ART Procedure: PGT Drives Genetic Screening Adoption
In-vitro fertilization dominates with 70.61% revenue share, reflecting its versatility across male-factor, female-factor, and unexplained infertility cases. The infertility treatment devices market size for IVF-centric hardware is forecast to expand steadily as clinics integrate AI-assisted micromanipulation and embryo culture modules. Pre-implantation genetic testing support is the fastest-growing procedure group at 10.05% CAGR. Whole-genome approaches now screen over 3,200 genes, extending utility beyond aneuploidy to polygenic risk reduction. Intracytoplasmic sperm injection benefits from robotics that standardize needle penetration depth, elevating fertilization rates in severe oligozoospermia. Intrauterine insemination retains relevance as a low-cost entry, aided by automated sperm processors that recover 86% motile cells, well above manual methods. Cryopreservation and vitrification protocols grow alongside societal acceptance of elective fertility preservation, especially among cancer survivors and career-focused professionals.
Emergency oocyte cryopreservation shows 29.2% cumulative live-birth rates, with outcomes linked to male-factor severity and age, reinforcing the need for rapid decision support tools. AI-driven treatment planners integrate hormonal, morphological, and genetic inputs to propose individualized stimulation regimens, improving cumulative success without raising medication doses. These advancements broaden patient confidence and position genetic testing services as a standard adjunct, embedding additional device revenue in each cycle.
By Technology Platform: AI Platforms Lead Digital Transformation
Manual and conventional devices still command 43.95% revenue, underscoring cautious adoption curves in risk-averse clinical environments. Nonetheless, the highest growth vector comes from AI-enabled imaging and analytics, advancing at 11.42% CAGR as outcome data validate their superiority. Semi-automated workstations bridge existing staff skills with hardware precision, easing the transition and safeguarding cash flows. Fully automated systems promise virtually hands-free labs; Conceivable Life Sciences has demonstrated 200+ sequential steps executed by coordinated robots without human intervention. Microfluidic lab-on-chip devices shrink workflows onto disposable cartridges, slashing reagent volumes and enhancing sterility.
Data integration shapes procurement. AI platforms capable of aggregating hormone assays, embryo images, and genetic readouts into single dashboards save embryologists several hours per cycle. Predictive maintenance functions also lower service outages, elevating uptime targets to near-continuous operation. As regulators refine guidance for adaptive algorithms, clinics increasingly select vendors with transparent model governance, accelerating platform consolidation.
By End User: Research Institutes Drive Innovation Adoption
Fertility clinics amassed 59.12% of 2025 revenue because they execute most ART cycles and directly influence purchasing decisions. Yet clinical research institutes lead in growth at 10.39% CAGR, reflecting the surge in grant funding for reproductive longevity and embryo biology. Philanthropic backers like Bia-Echo channel millions into translational programs, elevating demand for specialized incubators and imaging systems. Hospitals diversify into reproductive medicine to retain patients who historically traveled to standalone IVF centers. Integrated health systems bundle infertility work-ups with broader women’s health services, helping capture downstream obstetric revenue streams.
Academic centers forge co-development deals with device makers, supplying trial sites that accelerate regulatory submissions. Partnering companies gain early feedback to refine user interfaces and interoperability features. As automation reduces reliance on individual operator skill, end-user purchasing criteria shift toward data analytics, cybersecurity compliance, and remote support quality. These factors collectively widen the infertility treatment devices market scope within teaching and research ecosystems.
Geography Analysis
North America held 32.15% of 2025 revenue thanks to advanced insurance networks, consolidated clinic chains, and early uptake of premium AI modules. Market competition revolves around differentiating patient experience through zero-contact lab tours and transparent outcome dashboards. State mandates covering infertility procedures continue to spread, sustaining steady equipment upgrade cycles in private and academic centers. The infertility treatment devices market therefore remains firmly entrenched in North American strategic planning, even as regional growth moderates.
Asia-Pacific posts the fastest 9.23% CAGR, propelled by massive population bases, rising disposable income, and cultural emphasis on parenthood. China’s removal of birth caps intersects with higher infertility rates, spurring a boom in clinics outfitting mid-range automation that balances throughput and cost. India positions itself as the fertility treatment capital, attracting medical tourists who benefit from price advantages while still accessing AI-enabled imaging systems.Southeast Asian operators, such as Thomson Medical, expand regionally to capture a share of outbound Chinese demand, further enlarging the infertility treatment devices market.
Europe displays steady adoption, aided by robust reimbursement and harmonized quality standards. Clinics allocate capital toward compliance with MDR 2017/745, favoring vendors capable of supplying complete technical documentation. Middle East and Africa witness greenfield projects in Gulf Cooperation Council states, where public–private partnerships finance world-class IVF centers. Qatar’s Sidra Medicine installed advanced embryo imaging systems, signaling a shift from outbound to domestic care. South America benefits from Brazil’s regulatory recognition of foreign approvals, trimming time-to-market for imported hardware and inviting multinationals to pilot lower-cost automation modules. Collectively, geographic dynamics ensure the infertility treatment devices market remains truly global in both demand and competitive rivalry.

Competitive Landscape
The market remains moderately fragmented, yet consolidation momentum is undeniable. Astorg’s USD 228 million acquisition of Hamilton Thorne and Cooper Companies’ USD 875 million purchase of Cook Medical’s reproductive health unit underscore the strategic value of scale and integrated distribution. Large platforms can amortize regulatory costs across wider portfolios and attract top AI talent. Vertical integration trends see incumbents bundling hardware, consumables, and cloud analytics in subscription packages, anchoring customer relationships while smoothing revenue recognition.
Technology differentiation drives positioning. Conceivable Life Sciences raised USD 18 million to commercialize automated laboratories that claim to halve cycle costs while tripling throughput. Overture Life secured an additional USD 20.6 million to scale its microfluidic-based vitrification, carving a niche in cryopreservation excellence. Emerging players specialize rather than compete on breadth; examples include firms focused solely on RFID cryostorage or on AI for sperm morphology. Regulatory clarity, exemplified by the FDA’s Class II classification of anti-mullerian hormone test systems, offers a blueprint for other novel diagnostics to navigate approval pathways.
Partnerships flourish as device makers seek data to refine algorithms. Academic alliances provide clinical datasets, while cloud providers offer scalable infrastructure that meets HIPAA and GDPR obligations. Competitive intensity now pivots around who can deliver end-to-end, regulatory-ready solutions that embed continuous learning models. The infertility treatment devices industry therefore rewards enterprises combining robust balance sheets, software prowess, and agile commercial execution.
Infertility Treatment Devices Industry Leaders
CooperSurgical Inc
Hamilton Thorne Inc
Cook Medical Inc
Vitrolife
Merck KGaA
- *Disclaimer: Major Players sorted in no particular order

Recent Industry Developments
- June 2025: Columbia University Fertility Center achieved the first pregnancy using the STAR AI system, enabling conception for an azoospermic patient after 18 years of infertility.
- May 2025: FDA classified anti-mullerian hormone test systems as Class II devices with special controls, clarifying the regulatory path for ovarian reserve diagnostics.
- April 2025: Overture Life raised USD 20.6 million, taking total funding to USD 57 million to accelerate IVF automation rollouts.
- January 2025: Conceivable Life Sciences closed USD 18 million Series A financing led by ARTIS Ventures to launch the world’s first AI-powered automated IVF laboratory in the United States.


Research Methodology Framework and Report Scope
Market Definitions and Key Coverage
Our study defines the infertility treatment devices market as every new piece of equipment used to diagnose, handle, or support gametes and embryos during assisted reproductive procedures. Items range from ovum-aspiration pumps and sperm-analyzer systems to micromanipulators, incubators, imaging modules, cryosystems, and emerging micro-fluidic chips.
Scope exclusion: Pharmaceuticals, hormonal therapies, and laboratory culture media are not counted, keeping the focus strictly on capital equipment and single-use hardware.
Segmentation Overview
- By Type
- Sperm Separation Devices
- Ovum Aspiration Pumps
- Sperm Analyzer Systems
- Micromanipulator Systems
- Incubators
- Cryosystems
- Imaging Systems
- Microscopes
- Others
- By Assisted Reproductive Technology (ART) Procedure
- In-Vitro Fertilization (IVF)
- Intracytoplasmic Sperm Injection (ICSI)
- Intrauterine Insemination (IUI)
- Cryopreservation / Vitrification Support
- Pre-implantation Genetic Testing (PGT) Support
- By Technology Platform
- Manual / Conventional Devices
- Semi-Automated Devices
- Fully Automated / Robotic Systems
- AI-Enabled Imaging & Analytics Platforms
- Micro-fluidic Lab-on-Chip Devices
- By End-user
- Fertility Clinics
- Hospitals & Other Healthcare Facilities
- Clinical Research Institutes
- By Geography
- North America
- United States
- Canada
- Mexico
- Europe
- Germany
- United Kingdom
- France
- Italy
- Spain
- Rest of Europe
- Asia-Pacific
- China
- Japan
- India
- Australia
- South Korea
- Rest of Asia-Pacific
- Middle East and Africa
- GCC
- South Africa
- Rest of Middle East and Africa
- South America
- Brazil
- Argentina
- Rest of South America
- North America
Detailed Research Methodology and Data Validation
Primary Research
We interviewed embryologists, fertility-clinic procurement leads, and device distributors across North America, Europe, Asia-Pacific, and the Gulf to validate utilization rates, price dispersion, and upgrade triggers. Follow-up surveys with clinic managers filled blind spots around stock-keeping units and capacity expansion plans, letting us align theoretical demand with practical purchase behavior.
Desk Research
Analysts first gathered quantitative clues from respected open sources such as the World Health Organization infertility registries, United Nations demographic yearbooks, OECD health-care utilization datasets, and national ART surveillance reports. Industry-specific associations, including the European Society of Human Reproduction and the American Society for Reproductive Medicine, supplied clinic counts and procedural success statistics. Annual filings, prospectuses, and tender databases (e.g., D&B Hoovers, Dow Jones Factiva) helped benchmark average selling prices and shipment volumes. This list is illustrative; many other references supported evidence collection and sense-checking.
A second pass explored patent libraries via Questel and shipment logs in Volza to gauge technology diffusion and trade flows, while peer-reviewed journals clarified device lifecycles and replacement patterns.
Market-Sizing & Forecasting
A top-down reconstruction started with documented ART procedure counts by country, then applied equipment intensity coefficients (for example, average incubators per 1,000 IVF cycles). Results were cross-checked through selective bottom-up roll-ups of leading suppliers' revenues sampled in public filings. Key variables like average IVF cycles per clinic, clinic expansion pipelines, typical device service life, replacement ratios, and regulator-reported success rates shaped historical baselines.
For forecasting, we employed multivariate regression, pairing projected IVF cycle growth with macro drivers such as female median child-bearing age and private insurance coverage penetration. Scenario reviews with primary experts adjusted outliers and bridged data gaps where bottom-up evidence was thin.
Data Validation & Update Cycle
Every model iteration undergoes variance screens against external benchmarks, senior analyst peer review, and anomaly re-checks with original respondents. Reports are refreshed annually, with interim updates when material regulatory or technology shifts occur, ensuring clients receive the most current view.
Why Mordor's Infertility Treatment Devices Baseline Commands Confidence
Published estimates often diverge because firms choose different product baskets, geographic spreads, and refresh cadences.
Key gap drivers include inclusion of consumables, omission of imaging hardware, or the bundling of services alongside devices.
By locking scope to tangible equipment, using country-level procedure counts, and revisiting models every twelve months, Mordor delivers a balanced, transparent baseline that decision-makers can retrace.
Benchmark comparison
| Market Size | Anonymized source | Primary gap driver |
|---|---|---|
| USD 2.21 B | Mordor Intelligence | |
| USD 3.33 B | Global Consultancy A | Adds consumables such as culture media and reagents that our study allocates to a separate chemicals domain |
| USD 0.34 B | Industry Association B | Restricts scope to high-value hardware in two regions, omitting imaging and disposables |
| USD 11.97 B | Trade Journal C | Combines devices with drugs, surgical fees, and cryobank services, inflating totals |
In summary, our disciplined variable selection, dual-track validation, and timely refresh cycles mean Mordor's numbers sit squarely between overly narrow counts and broad, blended valuations, making them the dependable point of reference for strategic planning.


Key Questions Answered in the Report
What is the current size of the infertility treatment devices market?
The market stands at USD 2.37 billion in 2026 and is forecast to rise to USD 3.39 billion by 2031 at a 7.39% CAGR.
Which device category is growing fastest?
Microfluidic sperm-sorting chips show the highest 11.78% CAGR as clinics prioritize precision and gentler sperm preparation.
How significant is AI in fertility laboratories today?
AI-enabled imaging and analytics platforms represent the fastest-growing technology group, expanding at 11.42% CAGR due to their ability to standardize embryo assessment.
Which region leads the market in revenue terms?
North America holds 32.15% of 2025 revenue, driven by strong insurance coverage and early adoption of premium automation technologies.
Why is Asia-Pacific considered the most attractive growth market?
The region posts a 9.23% CAGR because large population bases, rising incomes, and fertility tourism converge with expanding clinic networks.
Page last updated on:


