
Market Overview
| Study Period | 2020 - 2031 |
|---|---|
| Forecast Data Period | 2026 - 2031 |
| Historical Data Period | 2020 - 2024 |
| Market Size (2026) | USD 21.58 Billion |
| Market Size (2031) | USD 28.70 Billion |
| Growth Rate (2026 - 2031) | 5.87% CAGR |
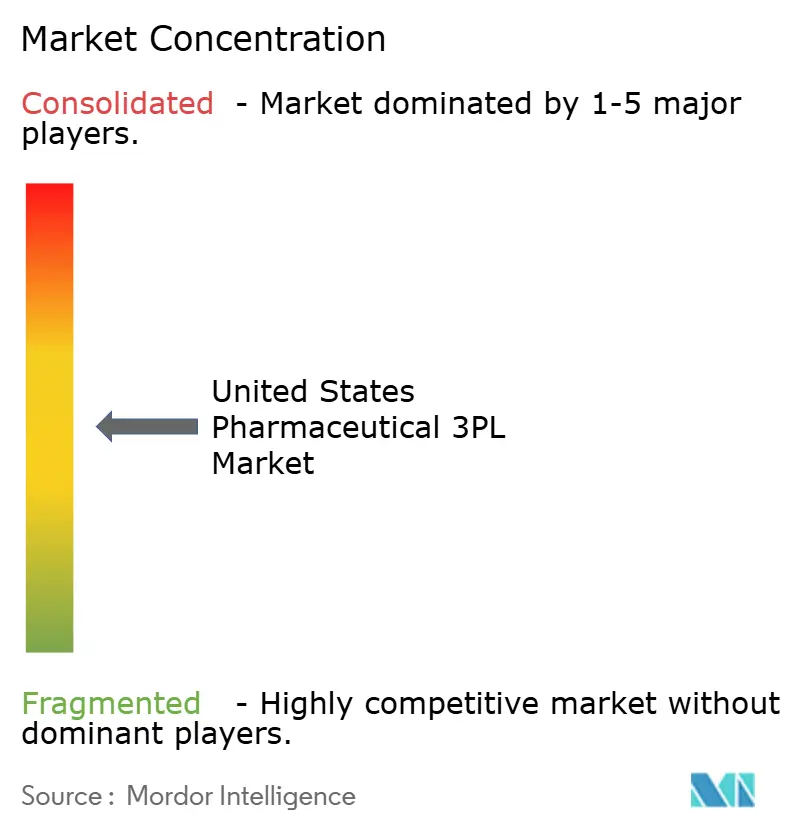
| Market Concentration | Medium |
Major Players *Disclaimer: Major Players sorted in no particular order Image © Mordor Intelligence. Reuse requires attribution under CC BY 4.0. | |
United States Pharmaceutical 3PL Market Analysis by Mordor Intelligence
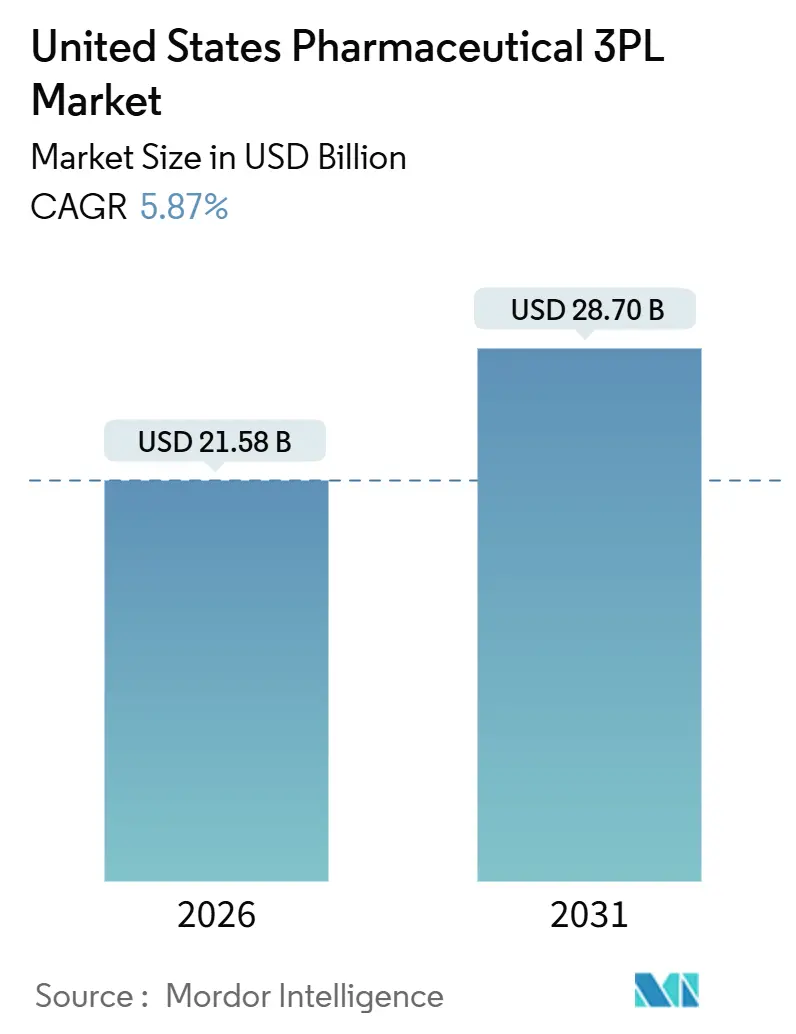
The United States pharmaceutical 3PL market size is estimated at USD 21.58 billion in 2026, and is expected to reach USD 28.70 billion by 2031, at a CAGR of 5.87% during the forecast period (2026-2031). This outlook reflects rising demand for high-integrity distribution of specialty biologics, cell and gene therapies, and temperature-sensitive vaccines that require granular traceability and real-time monitoring. Tight refrigerant regulations under the AIM Act are accelerating consolidation because retrofitting legacy warehouses compresses margins for regional operators while favoring global integrators with balance-sheet scale. Parcel-scale e-pharmacy growth is fragmenting shipment sizes, pushing 3PLs to deploy insulated shippers that maintain 2 °C to 8 °C up to 72 hours and optimize dense, time-definite delivery routes. Simultaneously, Drug Supply Chain Security Act (DSCSA) serialization milestones are shifting value creation upstream into warehouses that can aggregate unit-level barcodes and feed interoperable EPCIS data into manufacturers’ ERP platforms. Labor scarcity in GDP-trained warehousing and refrigerated trucking is lifting wage bills, motivating larger providers to automate picking tunnels, adopt autonomous mobile robots, and integrate AI-powered demand forecasting to sustain service levels during peak inflows.
Key Report Takeaways
- By service type, domestic transportation management led with a 42.2% revenue share in 2025, while value-added warehousing and distribution is projected to expand at an 8.1% CAGR between 2026-2031.
- By temperature type, non-cold-chain activities commanded 63.5% of the United States pharmaceutical 3PL market share in 2025, whereas cold-chain logistics is forecast to grow at a 9.8% CAGR between 2026-2031.
- By end user, pharmaceutical manufacturers accounted for 51.4% of the United States pharmaceutical 3PL market size in 2025; e-pharmacies and direct-to-patient services are advancing at a 10.4% CAGR between 2026-2031.
- By product type, prescription drugs contributed 56.1% of 2025 revenue, but cell and gene therapies are poised for an 11.5% CAGR between 2026-2031.
- By geography, the Northeast held 26.6% share in 2025, while the Southwest is set to climb at a 7.7% CAGR between 2026-2031.
Note: Market size and forecast figures in this report are generated using Mordor Intelligence’s proprietary estimation framework, updated with the latest available data and insights as of January 2026.
United States Pharmaceutical 3PL Market Trends and Insights
Drivers Impact Analysis*
| Driver | (~) % Impact on CAGR Forecast | Geographic Relevance | Impact Timeline |
|---|---|---|---|
| Rise of specialty biologics requiring strict cold-chain compliance | +1.2% | National, with concentration in Northeast and West biotech hubs | Medium term (2-4 years) |
| E-pharmacy parcelization boosting last-mile temperature-control needs | +0.9% | National, with early adoption in urban Northeast, West, and Southeast metros | Short term (≤ 2 years) |
| Stringent GDP and DSCSA regulations driving real-time monitoring investments | +0.8% | National, with compliance infrastructure concentrated in major distribution corridors | Medium term (2-4 years) |
| United States' refrigerant phase-down (AIM Act) forcing rapid retrofit of cold warehouses | +0.6% | National, with acute impact in states with large cold-storage footprints (California, Texas, Pennsylvania) | Short term (≤ 2 years) |
| VC-funded cell and gene therapy start-ups locating in Midwest biohubs | +0.7% | Midwest core (Indiana, Ohio, Illinois), with spillover to adjacent states | Long term (≥ 4 years) |
| Integrated RTSM-3PL platforms slashing clinical trial delays for SME sponsors | +0.5% | National, with early gains in Northeast and West clinical-trial-dense regions | Medium term (2-4 years) |
| Source: Mordor Intelligence | |||
Rise of Specialty Biologics Requiring Strict Cold-Chain Compliance
Specialty biologics already represent more than half of new drug approvals, and most degrade within minutes of temperature excursion, so 3PLs now deploy sensors that record data every 15 seconds and feed alerts into control towers for immediate corrective action. Facilities in Louisville and Dallas operated by UPS Healthcare keep redundant chillers and generators on standby, ensuring 2 °C to 8 °C integrity even during grid outages. Autologous cell therapies add a time constraint because patient-derived cells must reach infusion sites within 48 hours. These dynamics shorten allowable transit windows, spur demand for dedicated couriers, and elevate the strategic importance of the United States pharmaceutical 3PL market for hospital oncology centers. Providers that document temperature history in immutable ledgers using blockchain gain an audit advantage when FDA inspectors review chain-of-custody records. As biologic launch pipelines remain robust, cold-chain growth outpaces ambient services, sustaining above-market pricing power for compliant operators across the United States pharmaceutical 3PL market[1]“Cold Chain Management for Biologics,” U.S. Food and Drug Administration, fda.gov .
E-Pharmacy Parcelization Boosting Last-Mile Temperature-Control Needs
Relaxed post-pandemic regulations triggered double-digit prescription mail-order growth, and Amazon Pharmacy’s 2024 move into cooled residential delivery further expanded demand. Average parcel weight fell from 3.2 kg in 2020 to 1.8 kg in 2025, pushing per-unit logistics costs higher even as volumes surged. FedEx Healthcare’s SenseAware ID devices now travel inside every specialty-drug parcel, broadcasting GPS and temperature telemetry in real time. Routing algorithms recombine hundreds of small orders into densely scheduled micro-routes that meet two-hour delivery promises, a capability that large 3PLs leverage to win exclusive mail-order contracts. The trend positions e-pharmacy traffic as a structural growth engine for the United States pharmaceutical 3PL market through the forecast horizon. Nevertheless, soaring residential mileage raises sustainability concerns, prompting carriers to experiment with electric vans and reusable insulated packs to satisfy shippers’ ESG targets[2]“AIM Act Program Overview,” U.S. Environmental Protection Agency, epa.gov.
Stringent GDP and DSCSA Regulations Driving Real-Time Monitoring Investments
The November 2024 DSCSA stabilization milestone obligated every handler to exchange interoperable product codes at the package level. Mid-tier 3PLs spent USD 5 million–USD 15 million on scanners, aggregation software, and ERP connectors, materially altering cost structures. Kuehne+Nagel’s blockchain-enabled platform integrates serialization data with temperature logs, which cuts audit prep time by 40% and delivers a clear value proposition to biotech sponsors. Good Distribution Practice rules also force annual re-mapping of storage zones and documented deviation analyses, rewarding firms that maintain dedicated quality-assurance teams. Compliance complexities accelerate mergers because non-compliant warehouses risk contract loss, reinforcing a flight-to-quality narrative inside the United States pharmaceutical 3PL market. Carriers that provide turnkey data feeds into manufacturer systems convert regulation into stickier customer relationships.
United States Refrigerant Phase-Down Forcing Rapid Cold-Warehouse Retrofit
The AIM Act requires an 85% cut in high-GWP refrigerants such as R-404A by 2028, and retrofit bills for a 100,000 ft² site can surpass USD 4 million. DHL Supply Chain committed USD 200 million to shift United States sites to ammonia and CO₂ solutions by 2027, projecting 15% energy savings and a lower emissions footprint. Smaller operators often lack the capital to finance conversion and therefore exit the cold-chain niche or sell into roll-up platforms. Reclaimed refrigerant prices have tripled since 2023, so delaying upgrades further erodes margins. Clients, meanwhile, add sustainability clauses to bid documents, pushing demand toward certified low-GWP facilities. The policy thus embeds an infrastructure moat that advantages well-capitalized incumbents and intensifies consolidation inside the United States pharmaceutical 3PL market over the medium term.
Restraints Impact Analysis*
| Restraint | (~) % Impact on CAGR Forecast | Geographic Relevance | Impact Timeline |
|---|---|---|---|
| Intense cost-pressure from pharma tendering models | -0.7% | National, with acute pressure in high-volume generic and biosimilar distribution | Short term (≤ 2 years) |
| GDP-trained labor shortage across warehousing and trucking | -0.6% | National, with critical shortages in Midwest and Southeast distribution corridors | Medium term (2-4 years) |
| Scarcity of sustainable packaging meeting both ESG and USP 659 standards | -0.4% | National, with early adoption pressure in West Coast and Northeast markets | Long term (≥ 4 years) |
| Airport cool-room congestion at tier-2 cargo hubs causing spoilage risk | -0.3% | Midwest and Southwest tier-2 airports (Indianapolis, Phoenix, Austin) | Short term (≤ 2 years) |
| Source: Mordor Intelligence | |||
Intense Cost Pressure from Pharma Tendering Models
Pharmaceutical producers increasingly award multiyear logistics contracts through reverse auctions that demand annual unit-cost cuts even when diesel and labor expenses climb. Generic-drug distribution margins slipped below 3% in 2025, down more than 100 basis points in five years, and biosimilar shippers benchmark rates against cheaper small-molecule corridors, limiting cold-chain cost recovery. Fixed-price clauses stifle innovation because 3PLs hesitate to propose serialization upgrades without cost-pass-through certainty. Some sponsors trial gain-sharing schemes, yet procurement teams still prioritize budget certainty. For cash-constrained carriers, tighter pricing reduces available funds for DSCSA or refrigerant compliance, risking future contract eligibility. This pressure slows capital refresh cycles, restraining the potential CAGR for the United States pharmaceutical 3PL market despite healthy volume growth[3]“Drug Supply Chain Security Act Resources,” U.S. Food and Drug Administration, fda.gov.
GDP-Trained Labor Shortage Across Warehousing and Trucking
A persistent shortage of technicians who understand temperature zoning, contamination prevention, and deviation documentation inflates warehouse wages by 20%-30% above general fulfillment jobs. The gap is wider for CDL-A drivers holding hazmat endorsements and reefer experience, where signing bonuses top USD 10,000 and annual earnings exceed USD 85,000. Labor scarcity is most acute in the Midwest and Southeast, where rapid plant construction outpaces vocational training pipelines. Automation helps, though capital barriers are high: autonomous mobile robots cost USD 5 million-USD 10 million per building and still require skilled supervisors. Rising payroll outlays compress operating margins, especially for mid-size 3PLs locked into multiyear fixed-price contracts. Until workforce pipelines expand, talent shortages will cap throughput gains in the United States pharmaceutical 3PL market and could prolong tender cycles as shippers vet contingency plans[4]“Life Sciences Cluster Data,” Massachusetts Biotechnology Council, massbio.org.
*Our forecasts treat driver/restraint impacts as directional, not additive. The impact forecasts reflect baseline growth, mix effects, and variable interactions.
Segment Analysis
By Service Type: Value-Added Warehousing Outpaces Transportation Growth
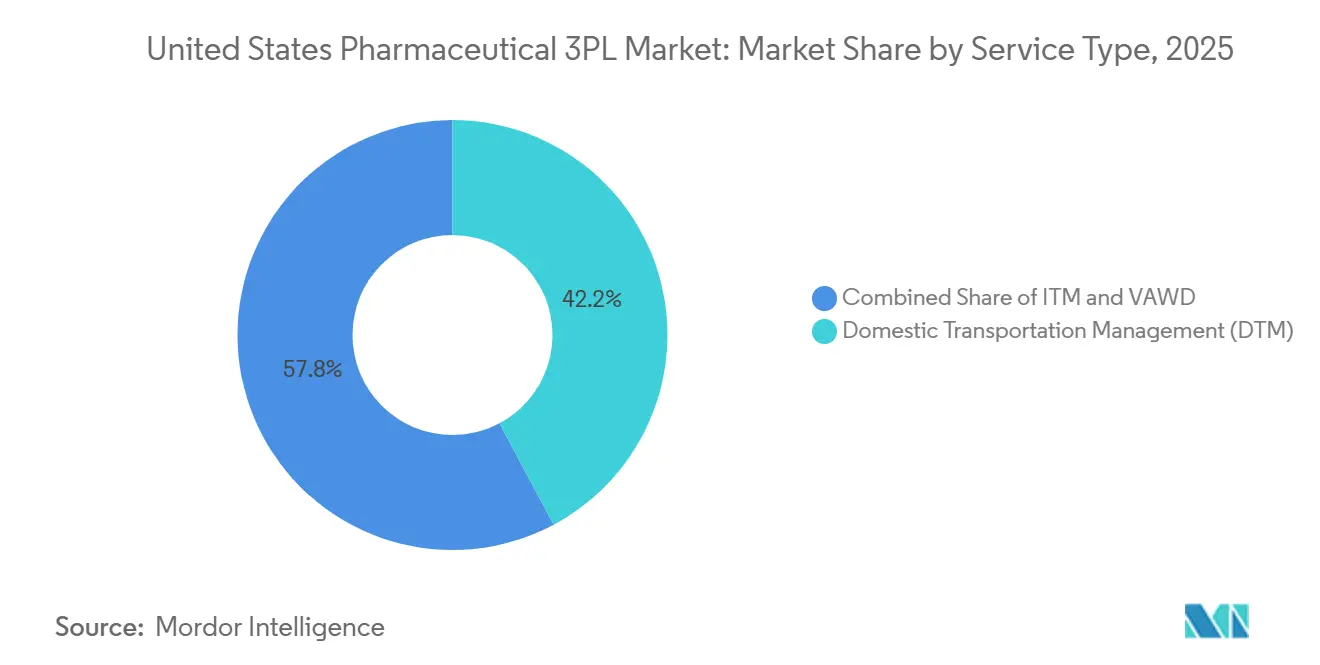
In 2025, domestic transportation management contributed 42.2% of total revenue, but value-added warehousing and distribution is on track for an 8.1% CAGR between 2026-2031 as DSCSA mandates push serialization, aggregation, and kitting tasks closer to inventory nodes. Facility operators installing automated case-packing arms tie barcode aggregation into warehouse-execution systems, allowing manufacturers to outsource compliance overhead without increasing their fixed assets. Domestic trucking remains essential for door-to-door reach, yet mileage-based rates face payer pushback, nudging carriers toward drop-trailer programs and dedicated contract carriage that allow higher asset turns. International airfreight, though smaller in volume, carries a premium yield per kilo because of customs-clearance complexity and cryogenic handling needs, reinforcing multimodal diversification strategies across the United States pharmaceutical 3PL market.
Second-level value migration appears in control-tower contracts that bundle transport planning with SKU-level visibility, predictive ETA, and exception management. Providers that combine network modeling, IoT sensors, and AI routing engines can trim spoilage claims by double digits and command service premiums despite rate pressure elsewhere. The asset-light brokerage community, typified by RXO, leverages digital freight platforms to place compliant carriers into time-critical lanes at scale, demonstrating that technology parity matters as much as warehouse footprint. Competitive differentiation within the United States pharmaceutical 3PL market therefore hinges on integrated data, continuous quality assurance, and adherence to GDP metrics rather than raw trailer counts alone.



By Temperature Type: Cold-Chain Logistics Accelerates on Biologic Wave
Non-cold-chain activities still delivered 63.5% of 2025 revenue, yet cold-chain services will compound at 9.8% CAGR (2026-2031) as therapeutic pipelines tilt toward biologics, GLP-1 injectables, and mRNA vaccines. The United States pharmaceutical 3PL market size attributable to refrigerated and cryogenic handling will cross USD 12 billion by 2031. Residential demand for insulin, weight-management drugs, and specialty oncology infusions is pushing 3PLs to adopt passive-cool parcel systems with vacuum-insulated panels that keep temperatures stable for 72 hours without dry ice. Cryogenic shipments below -70 °C form a fast-growing niche because CAR-T therapies and certain viral-vector payloads require liquid nitrogen back-up systems.
Carriers that retrofit warehouses with −80 °C chambers and vapor shippers establish a protective moat because such infrastructure is expensive and subject to strict safety codes. However, a parallel effort is underway among drug makers to engineer room-temperature stable biologics that could soften cold-chain growth beyond 2030, tempering long-term expectations for the United States pharmaceutical 3PL market.
By End User: E-Pharmacies Drive Direct-to-Patient Momentum
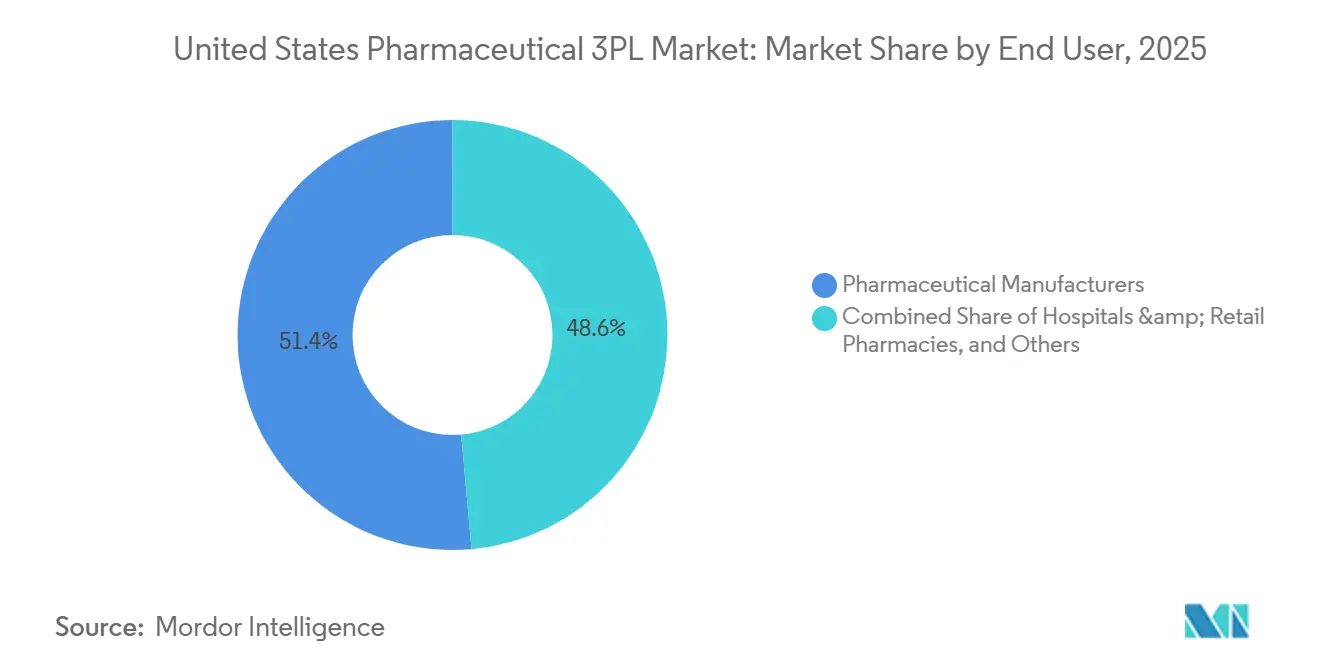
Pharmaceutical manufacturers accounted for 51.4% of 2025 revenue, yet e-pharmacies will record a 10.4% CAGR between 2026-2031, reshaping last-mile logistics economics. Shippers such as Amazon Pharmacy negotiate parcel rates closer to general e-commerce benchmarks, forcing incumbents to locate mini-hubs near population centers and adopt optical-sorting systems that batch refrigerated parcels by postal code. Hospitals, retail chains, and wholesalers together show mid-single-digit growth, stunted by the channel shift toward mail-order.
Clinical trial sponsors, especially small biotech firms, source investigational supplies under integrated RTSM-3PL models that can shave 30% off startup timelines and improve patient retention in decentralized protocols. For all user cohorts, DSCSA serialization remains a non-negotiable requirement, cementing warehouse technology investment as a critical success factor inside the United States pharmaceutical 3PL market.
By Product Type: Cell and Gene Therapies Redefine Complexity
Prescription drugs held the largest 56.1% revenue share in 2025, yet cell and gene therapies are expected to grow at 11.5% CAGR (2026-2031) and demand chain-of-identity documentation that tracks patient tissue from collection to reinfusion. The United States pharmaceutical 3PL market share linked to cell therapies will more than double by 2031, despite small volumetric footprints, because premium-priced cryogenic moves yield far higher revenue per pallet than tablets or capsules. Biopharmaceuticals and biosimilars, excluding cell therapies, compound at 8.7% as patent cliffs unlock opportunity for follow-on monoclonal antibodies that still require 2 °C to 8 °C control.
Vaccine programs maintain a 7.8% trajectory thanks to broadening immunization schedules, but capacity constraints at airport cool rooms limit surge flexibility during public-health emergencies. Over-the-counter medicines and veterinary products deliver steady, lower-margin volumes that underpin network density within the United States pharmaceutical 3PL market.
Geography Analysis
The Northeast generated USD 5.7 billion in 2025 revenue and remains the single largest regional slice of the United States pharmaceutical 3PL market because bluebird bio, Kite Pharma, and Vertex ship temperature-sensitive therapies to hundreds of infusion centers, driving premium yield lanes. However, lack of developable land near Boston Logan has pushed 3PLs to open satellite GMP warehouses as far as Manchester, New Hampshire, increasing line-haul distances. The region’s aging highway network also forces carriers to schedule pickups during off-peak windows to meet strict time-temperature profiles.
L40: By contrast, the Southwest delivered only USD 3.9 billion in 2025 revenue but will surpass USD 5.7 billion by 2031 owing to supportive tax regimes, proximity to Pacific gateways, and a pro-logistics regulatory stance in Texas and Arizona. Dallas-Fort Worth International Airport’s pharmaceutical cool-room complex expanded by 50% in 2025, adding dedicated -20 °C docks that reduce tarmac dwell time for inbound biologics. Regional policymakers offer property-tax abatements on GMP-qualified warehouses, accelerating permits relative to the coastal markets.
The Midwest posted USD 3.5 billion in 2025 revenue and is adding volume as Catalent’s Bloomington gene-therapy plant and Andelyn’s Columbus viral-vector campus begin commercial output. Yet air-freight gaps remain because Rickenbacker and Indianapolis each handle less than 5 % of the cargo tonnage processed at Los Angeles International, forcing many shippers to truck material to Chicago O’Hare before uplift. Labor supply tightens during harvest seasons when reefer drivers divert into food lanes, so several 3PLs are piloting dedicated training academies with state workforce boards to build a cold-chain talent pipeline. The Southeast and West post mid-single-digit growth, each shaped by weather-related disruptions and high compliance costs, yet both retain strategic importance because of seaport access and biotech innovation in California and North Carolina respectively.
Competitive Landscape
L42: Concentration within the United States pharmaceutical 3PL market remains moderate because the top five providers hold about 40%-45% of sector revenue, leaving ample headroom for specialized, regional, and clinical-trial-focused operators. DHL Supply Chain capitalizes on its USD 200 million refrigerant conversion program to signal ESG leadership and lock in long-term contracts with vaccine makers. UPS Healthcare leverages its Louisville Worldport campus and Dallas hub, totaling more than 17 million square feet of GDP-licensed space, enabling same-day reaches that competitors struggle to match. FedEx Logistics differentiates with SenseAware ID telemetry, which reduced spoilage claims by 25% in 2025 and secured exclusive drug-launch distribution for three top-20 pharma companies the same year.
Kuehne+Nagel’s blockchain serialization platform increases audit efficiency, attracting biotech sponsors keen to shorten FDA site inspections from weeks to days. Cencora’s World Courier expands RTSM integration across 150 countries, turning the control-tower model into a centerpiece for decentralized oncology trials. Asset-light challengers, led by RXO, pair digital freight-matching with strict carrier vetting to lower line-haul costs by 10%-15% without sacrificing GDP compliance, a proposition that resonates with generic-drug shippers sensitive to price. Automation also becomes a decisive factor, as Nippon Express trimmed manual pick hours by 35% using autonomous mobile robots in its New Jersey site, boosting throughput without adding headcount. Ongoing capital intensity fuels M&A, evidenced by Novo Holdings buying Catalent for USD 16.5 billion in 2024 to internalize clinical supply, a deal that signals strategic importance of captive logistics capacity among drug makers.
Smaller firms with niche skills such as cryogenic couriering or veterinary-pharma distribution remain acquisition targets, especially when they hold coveted airport leases or DSCSA-ready IT stacks. Conversely, operators failing to meet AIM Act retrofit deadlines or DSCSA data-exchange standards are likely to exit the market, either through distressed sales or partial divestments. Digital transparency, sustainable infrastructure, and GDP-certified labor therefore define the next competitive frontier in the United States pharmaceutical 3PL market.
United States Pharmaceutical 3PL Industry Leaders
DHL Group
FedEx
Kuehne+Nagel
United Parcel Service of America, Inc. (UPS)
Cencora
- *Disclaimer: Major Players sorted in no particular order

Recent Industry Developments
- December 2024: GEODIS opened a 150,000 ft², GDP-certified pharma warehouse in Dallas featuring zones from ambient conditions down to -80 °C cryogenic storage. The site supports Southwest manufacturers with DSCSA-ready serialization and kitting for clinical-trial material.
- October 2024: Kuehne+Nagel rolled out a blockchain platform that merges DSCSA serialization data with GDP temperature logs, giving clients a single audit trail. Early deployments in the Northeast and West Coast cut regulatory prep time by roughly 40%, with nationwide coverage completed in early 2025.
- September 2024: Nippon Express introduced autonomous mobile robots in its New Jersey pharma warehouse, cutting manual picking effort by 35% while keeping GDP standards intact through automated temperature-zone separation. The firm plans to extend the model to Midwest and West Coast sites in 2025.
- May 2024: FedEx Healthcare introduced a residential cold-chain option featuring SenseAware ID sensors embedded in each shipper. The devices feed live GPS and temperature data as shipments move through the FedEx Custom Critical network, which offers same-day delivery in select cities for high-value specialty drugs


United States Pharmaceutical 3PL Market Report Scope
Pharmaceutical 3PL refers to the safe and efficient delivery of pharmaceutical drug products to benefit patient health. The US pharmaceutical 3PL market is segmented by function (domestic transportation management, international transportation management, and value-added warehousing and distribution) and supply chain (cold chain and non-cold chain). The report offers the market size and forecasts in value (USD billion) for all the above segments.
By Service Type
| Domestic Transportation Management (DTM) | Roadways |
| Railways | |
| Airways | |
| Waterways | |
| International Transportation Management (ITM) | Roadways |
| Railways | |
| Airways | |
| Waterways | |
| Value-Added Warehousing and Distribution (VAWD) |
By Temperature Type
| Cold Chain |
| Non-cold Chain |
By End User
| Pharmaceutical Manufacturers |
| Biotech and Biosimilar Manufacturers |
| Clinical Research and Trial Sponsors |
| Hospitals and Retail Pharmacies |
| Healthcare Distributors and Wholesalers |
| E-pharmacies and Direct-to-Patient Services |
By Product Type
| Prescription Drugs |
| OTC and Consumer Health Products |
| Biopharmaceuticals and Biosimilars (ex-CGT) |
| Cell and Gene Therapies |
| Vaccines and Blood-derived Products |
| Veterinary Pharmaceuticals and Animal Health Products |
| Medical Devices, Diagnostics and Combination Products |
| Clinical-trial Materials (Investigational Medicinal Products) |
| Others |
By Geography
| Northeast |
| Midwest |
| Southeast |
| Southwest |
| West |
| By Service Type | Domestic Transportation Management (DTM) | Roadways |
| Railways | ||
| Airways | ||
| Waterways | ||
| International Transportation Management (ITM) | Roadways | |
| Railways | ||
| Airways | ||
| Waterways | ||
| Value-Added Warehousing and Distribution (VAWD) | ||
| By Temperature Type | Cold Chain | |
| Non-cold Chain | ||
| By End User | Pharmaceutical Manufacturers | |
| Biotech and Biosimilar Manufacturers | ||
| Clinical Research and Trial Sponsors | ||
| Hospitals and Retail Pharmacies | ||
| Healthcare Distributors and Wholesalers | ||
| E-pharmacies and Direct-to-Patient Services | ||
| By Product Type | Prescription Drugs | |
| OTC and Consumer Health Products | ||
| Biopharmaceuticals and Biosimilars (ex-CGT) | ||
| Cell and Gene Therapies | ||
| Vaccines and Blood-derived Products | ||
| Veterinary Pharmaceuticals and Animal Health Products | ||
| Medical Devices, Diagnostics and Combination Products | ||
| Clinical-trial Materials (Investigational Medicinal Products) | ||
| Others | ||
| By Geography | Northeast | |
| Midwest | ||
| Southeast | ||
| Southwest | ||
| West | ||


Key Questions Answered in the Report
How big is the United States pharmaceutical 3PL space today and where is it headed?
L45: How big is the United States pharmaceutical 3PL space today and where is it headed?
Which service line shows the quickest upside through 2031?
L47: Which service line shows the quickest upside through 2031?
What is pushing cold-chain growth faster than other temperature segments?
L49: What is pushing cold-chain growth faster than other temperature segments?
How do AIM Act refrigerant rules affect 3PL operators?
L51: How do AIM Act refrigerant rules affect 3PL operators?
Why do e-pharmacies matter for logistics providers?
L53: Why do e-pharmacies matter for logistics providers?
Who are the leading players and how concentrated is the field?
L55: Who are the leading players and how concentrated is the field?
Page last updated on:






