Exosomes Market Size and Share
Market Overview
| Study Period | 2020 - 2031 |
|---|---|
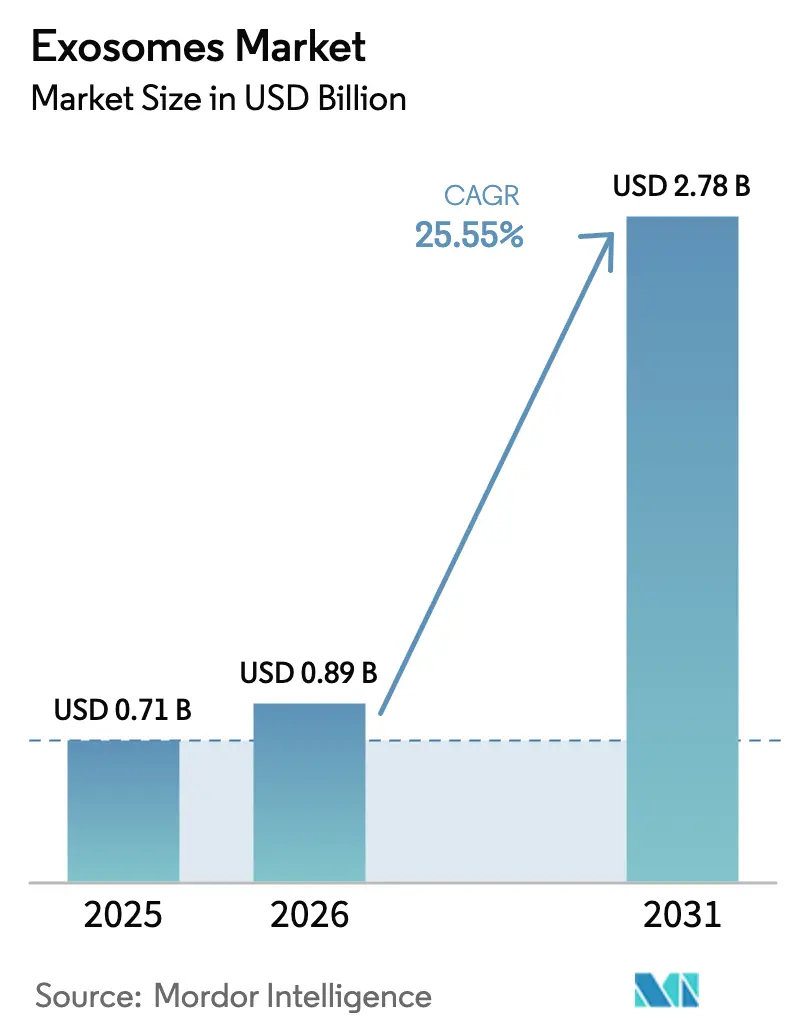
| Market Size (2026) | USD 0.89 Billion |
| Market Size (2031) | USD 2.78 Billion |
| Growth Rate (2026 - 2031) | 25.55% CAGR |
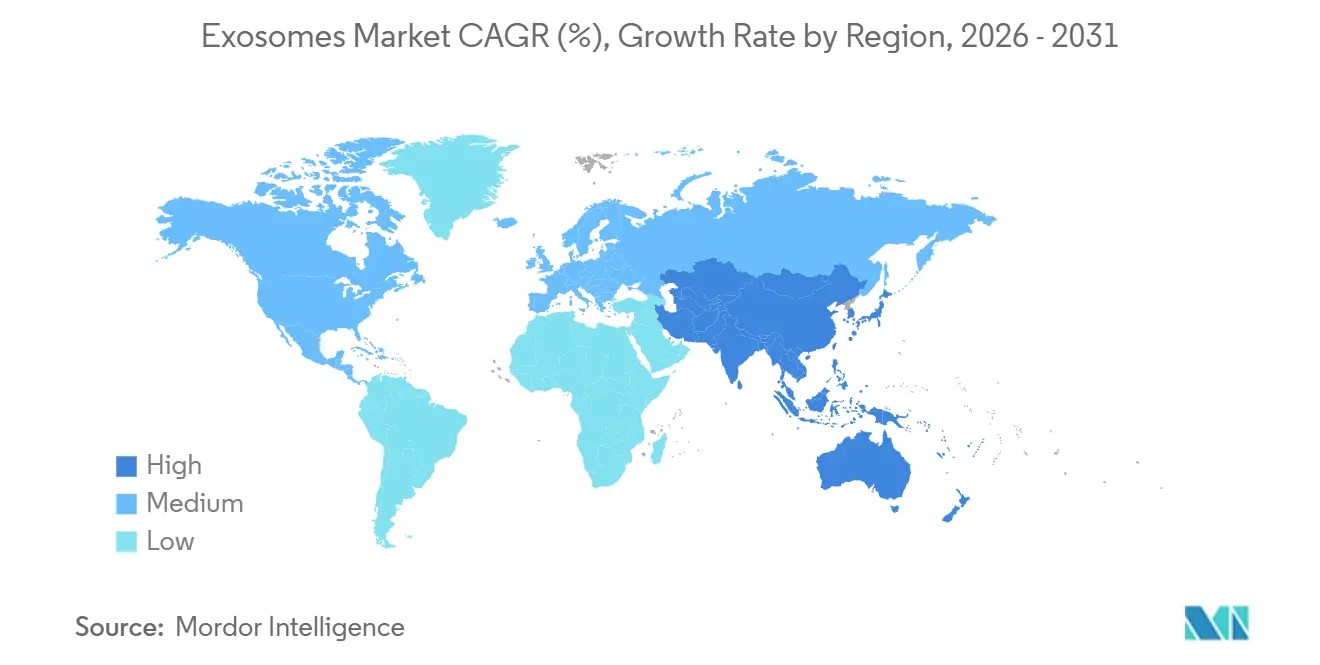
| Fastest Growing Market | Asia Pacific |
| Largest Market | North America |
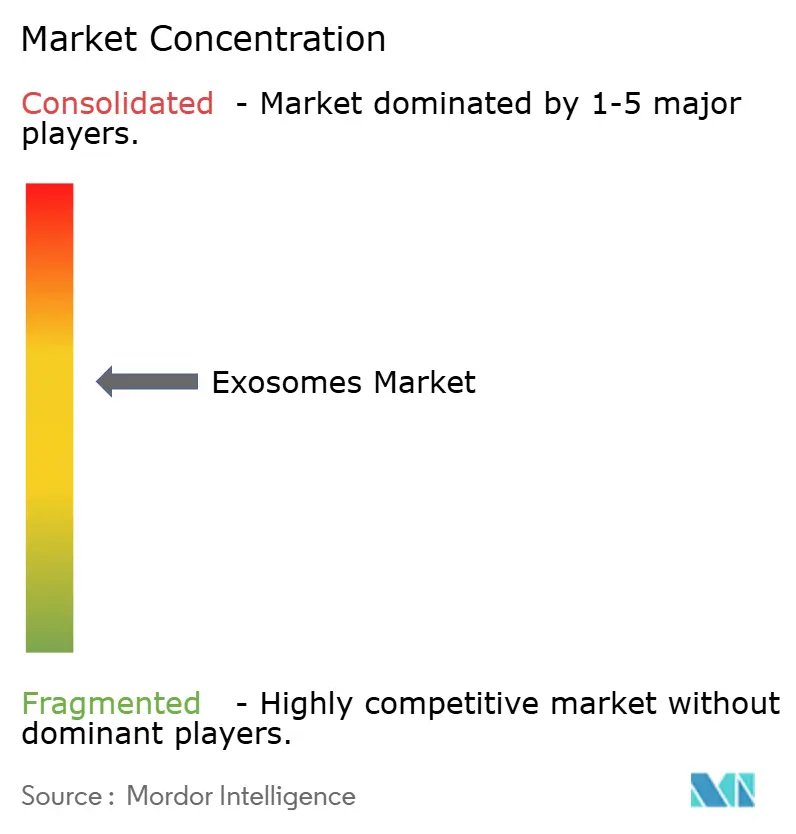
| Market Concentration | Medium |
Major Players *Disclaimer: Major Players sorted in no particular order Image © Mordor Intelligence. Reuse requires attribution under CC BY 4.0. | |
Exosomes Market Analysis by Mordor Intelligence
The Exosomes Market size is expected to increase from USD 0.71 billion in 2025 to USD 0.89 billion in 2026 and reach USD 2.78 billion by 2031, growing at a CAGR of 25.55% over 2026-2031.
Rapid clinical uptake of liquid biopsy, surging partnerships that position extracellular vesicles as modular drug-delivery vehicles, and regulatory clarity from the U.S. FDA are expanding demand across discovery, diagnostics, and therapeutics workflows. Heightened oncology incidence, improved microfluidic isolation platforms that shrink processing time to two hours, and multi-omic analytical tools that transform raw vesicle cargo into actionable clinical insights are reinforcing this momentum. Competitive intensity remains moderate because no single company controls more than 12% of revenue, yet players that combine isolation, characterization, and bioinformatics in one ecosystem are beginning to lock in switching costs. Asia-Pacific is advancing at a rapid growth, as China and Japan fast-track exosome-based diagnostics and regenerative-medicine protocols, underscoring the global exosomes market’s next wave of geographic expansion.
Key Report Takeaways
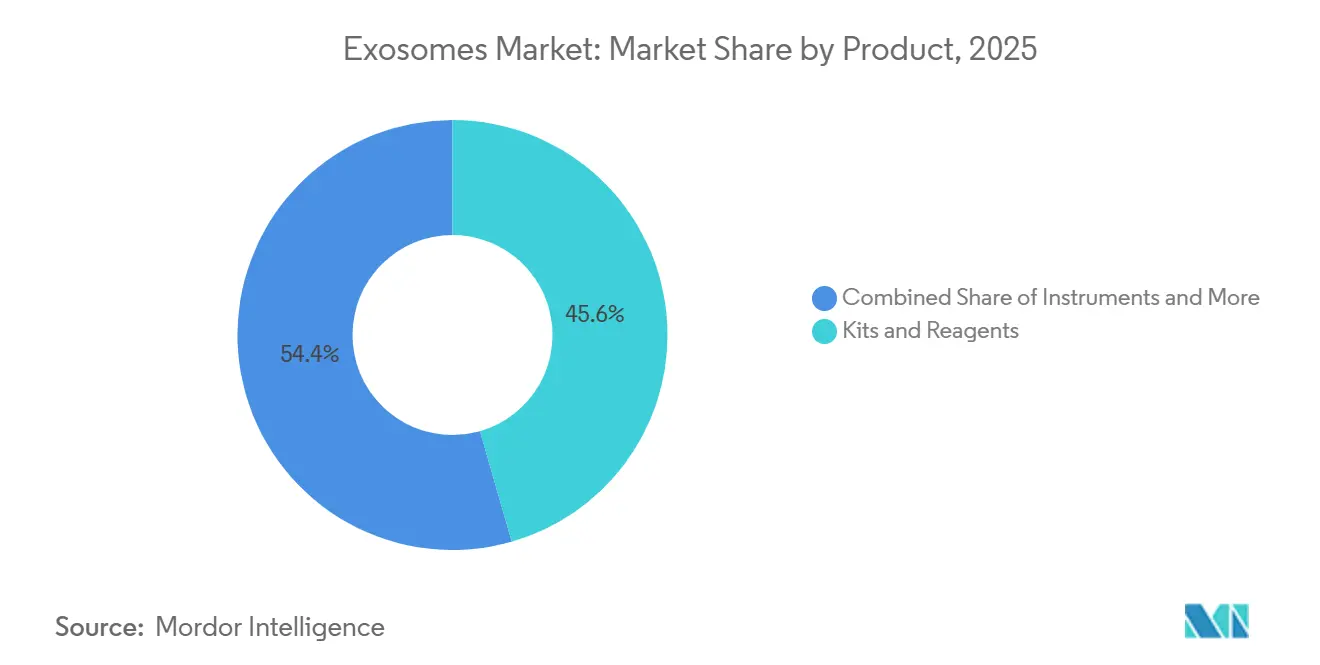
- By product category, Kits & Reagents led with 45.56% of the exosomes market share in 2025; Services & Software are projected to expand at a 39.25% CAGR to 2031.
- By workflow, Isolation Methods accounted for 55.53% revenue share in 2025, while Downstream Analysis is forecast to grow at a 38.85% CAGR through 2031.
- By biomolecule type, non-coding RNA held 34.63% share of the exosomes market size in 2025; proteins & peptides are advancing at a 35.87% CAGR between 2026 and 2031.
- By application, Diagnostics captured 61.13% of the exosomes market size in 2025; Therapeutics is set to rise at a 39.7% CAGR through 2031.
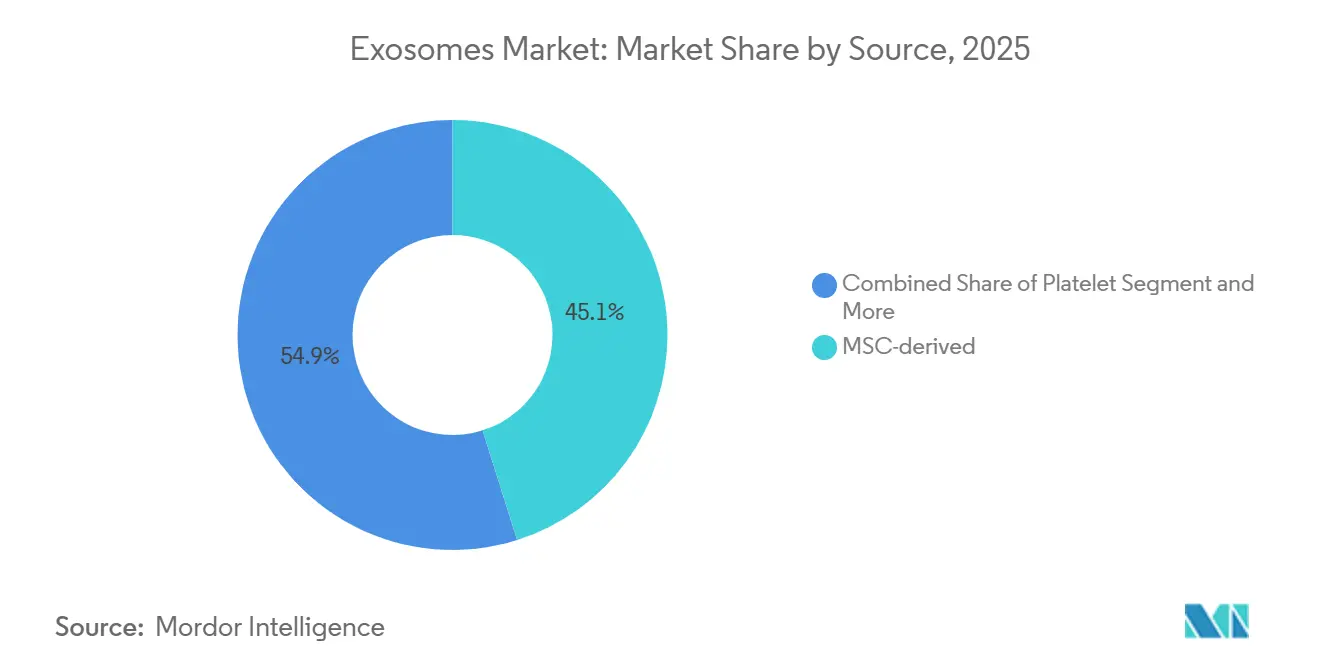
- By Source (Cell Type), MSC-derived commanded 45.13% of the exosomes market share in 2025, while Platelet-derived is accelerating at a 31.7% CAGR through 2031.
- By end-user, Pharmaceutical & Biotechnology Companies dominated with 49.13% share in 2025, while Academic & Research Institutes record the highest CAGR at 37.91% over the forecast period.
- By geography, North America led with 48.13% of the exosomes market share in 2025; Asia-Pacific is forecast to expand at a 39.51% CAGR through 2031.
Note: Market size and forecast figures in this report are generated using Mordor Intelligence’s proprietary estimation framework, updated with the latest available data and insights as of January 2026.
Global Exosomes Market Trends and Insights
Drivers Impact Analysis*
| Driver | (~) % Impact on CAGR Forecast | Geographic Relevance | Impact Timeline |
|---|---|---|---|
| Escalating oncology burden fueling demand for exosome-based liquid biopsy & therapeutics | +7.8% | Global, with peak adoption in North America & Europe | Medium term (2-4 years) |
| Rapid advances in high-yield exosome isolation technologies lowering cost of goods | +6.2% | Global, led by North America & Asia-Pacific | Short term (≤ 2 years) |
| Growing VC & Big-Pharma investments in extracellular-vesicle drug-delivery pipelines | +5.5% | North America & Europe core, spillover to Asia-Pacific | Medium term (2-4 years) |
| Expansion of companion-diagnostics partnerships in precision medicine | +3.9% | North America & Europe, early adoption in Japan & South Korea | Long term (≥ 4 years) |
| Rise of point-of-care microfluidic exosome analyzers in low-resource settings | +2.1% | Asia-Pacific, Middle East & Africa, Latin America | Long term (≥ 4 years) |
| Favorable Regulatory Initiatives Defining CMC Guidelines for Exosome Products | +1.8% | North America, Europe, with gradual adoption in Asia-Pacific | Long term (≥ 4 years) |
| Source: Mordor Intelligence | |||
Escalating Oncology Burden Fueling Demand for Exosome-Based Liquid Biopsy & Therapeutics
Worldwide cancer incidence surpassed 20 million new cases in 2024, intensifying interest in tumor-derived exosomes that carry mutation-specific DNA and oncogenic microRNAs. Liquid-biopsy platforms that isolate circulating vesicles detect EGFR mutations in non-small-cell lung cancer with 92% concordance to tissue biopsy and deliver results in 48 hours, shortening time-to-treatment. Therapeutic development is accelerating; an engineered dendritic-cell exosome achieved a 38% objective response rate in a Phase I melanoma trial completed in 2024. Regulatory clarity arrived when FDA confirmed that exosome therapeutics fall under the 351(a) biologics pathway and must demonstrate potency through functional assays[1]U.S. Food and Drug Administration, “Chemistry, Manufacturing, and Control Information for Human Gene Therapy INDs,” fda.gov. Companion-diagnostic alliances are expanding, exemplified by the 2025 Qiagen–Bio-Techne pact that bundles isolation kits with next-generation sequencing panels.
Rapid Advances in High-Yield Exosome Isolation Technologies Lowering Cost of Goods
Legacy ultracentrifugation requires 16 hours and yields fewer than 10¹⁰ particles per milliliter, limiting scalability. New microfluidic chips introduced in 2024 cut isolation time to under 2 hours and recover 10¹¹ particles by combining size-exclusion with immuno-affinity capture. Polymer-based precipitation is faster but co-isolates lipoproteins, forcing downstream filtration that erodes cost advantages. Immuno-affinity capture offers 95% purity yet remains expensive due to antibody consumption and bead regeneration challenges. Point-of-care handheld devices using acoustic trapping isolated exosomes from 50 microliters of whole blood at a per-test cost of USD 8 in a 2025 Indian pilot.
Growing VC & Big-Pharma Investments in Extracellular-Vesicle Drug-Delivery Pipelines
Investment exceeded USD 800 million in 2025 as developers recognized that vesicles can solve RNA-drug delivery hurdles. Evox Therapeutics raised USD 95.4 million in January 2025 for Phase II trials of an antisense-oligonucleotide platform that targets hepatocytes with 20-fold higher efficiency than lipid nanoparticles. Eli Lilly added another USD 200 million in March 2025 to engineer exosomes that cross the blood–brain barrier and carry CRISPR-Cas9 payloads. South Korea–based EVerZom raised EUR 10 million to advance platelet-derived vesicles for myocardial infarction after showing a 40% infarct-size reduction in porcine models. U.S. federal funding continues, with a USD 3.5 million grant supporting cardiosphere-derived vesicles as vaccine adjuvants.
Expansion of Companion-Diagnostics Partnerships in Precision Medicine
Guardant Health and Pfizer began co-developing an exosome test for HER2 amplification in 2024 to guide Enhertu usage, while Bio-Techne added a urinary-exosome prostate assay that cut unnecessary biopsies by 35%. FDA’s Breakthrough Devices Program granted designation to four exosome-based companion diagnostics in 2025, including a KRAS-G12C assay for dosing Lumakras. Payment remains a hurdle; CMS allocated a New Technology Add-on Payment to only one exosome diagnostic in 2025, awaiting cost-effectiveness evidence.
Restraints Impact Analysis*
| Restraint | (~) % Impact on CAGR Forecast | Geographic Relevance | Impact Timeline |
|---|---|---|---|
| Lack of standardized characterization protocols undermining reproducibility | -3.2% | Global, most acute in North America & Europe where regulatory scrutiny is highest | Short term (≤ 2 years) |
| Stringent GMP compliance elevating manufacturing complexity & cost | -2.8% | Global, with steepest cost escalation in North America & Europe | Medium term (2-4 years) |
| Limited long-term safety data slowing large-scale therapeutic approvals | -1.9% | Global, regulatory impact concentrated in North America & Europe | Long term (≥ 4 years) |
| Intellectual-property fragmentation creating freedom-to-operate uncertainty | -1.6% | North America & Europe, emerging in Asia-Pacific | Medium term (2-4 years) |
| Source: Mordor Intelligence | |||
Lack of Standardized Characterization Protocols Undermining Reproducibility
MISEV2023 calls for reporting particle count, size distribution, protein markers, and nucleic-acid content, yet only 28% of 320 studies met all four criteria in 2024. Nanoparticle tracking analysis cannot distinguish lipoproteins, leading to 300% overestimation of exosome counts. Electron microscopy samples fewer than 1,000 vesicles per field, introducing selection bias. FDA now asks developers to prove potency through functional assays, prompting investment in USD 500,000 high-content imaging systems. To aid harmonization, NIST released a 2025 liposome-based reference material for calibrating flow cytometers and ELISAs.
Stringent GMP Compliance Elevating Manufacturing Cost & Complexity
Closed bioreactors, aseptic filtration, and endotoxin removal together add USD 200 per gram of exosome product and stretch timelines for small developers. Donor-cell qualification takes 6 weeks of testing to confirm absence of mycoplasma and viruses. Viral-clearance studies cost USD 1.5 million per candidate and delay clinical phases by a year. Contract manufacturers are consolidating to spread infrastructure costs, illustrated by Lonza’s 2024 acquisition of HansaBioMed’s platform. EMA’s 2025 reflection paper now requires 24-month stability at -80 °C, extending real-time testing schedules.
*Our forecasts treat driver/restraint impacts as directional, not additive. The impact forecasts reflect baseline growth, mix effects, and variable interactions.
Segment Analysis
By Product: Software Growth Outstrips Consumables
Services & Software is advancing at 39.25% CAGR as laboratories need cloud platforms that transform multi-omic data into clinical insights. Kits & Reagents still delivered 45.56% of revenue in 2025, but low-cost Asian suppliers are squeezing margins. High-priced instruments such as USD 180,000 ultracentrifuges remain essential in GMP suites. Illumina’s 2025 launch of an exosome-analysis module trimmed bioinformatics time from 40 hours to 2 hours. ISO 13485 accreditation is now a default requirement, spurring consolidation among quality-assured reagent manufacturers.
Workflow automation tools that shorten sample-to-report cycles underpin the fastest growth. Software vendors bundle analytics with reagents to lock users into ecosystems, while consumables suppliers face price competition. Instruments remain strategic for large pharmaceutical clients because routine GMP release testing still mandates ultracentrifugation, nano-flow cytometry, and transmission electron microscopy.


By Workflow: Down-Stream Analysis Emerges as Differentiator
Although isolation methods generated 55.53% of 2025 revenue, nano-flow cytometry, electron microscopy, and mass spectrometry are climbing at 38.85% CAGR because regulators insist on orthogonal characterization. Ultracentrifugation use is falling as 16-hour runs and rotor maintenance make it unsuited for clinical labs. Microfluidic isolation platforms that recover 10¹¹ particles in 2 hours now dominate new clinical installations. Immuno-affinity capture secures 95% purity but remains expensive, while precipitation kits trade purity for speed.
Downstream analysis differentiates providers; nano-flow cytometry profiles single vesicles, mass spectrometry maps post-translational protein changes linked to drug resistance, and electron microscopy validates morphology albeit at low sample counts. Multi-modal data files feed machine-learning pipelines that clinicians use for treatment decisions, reinforcing demand for integrated analytics suites.
By Biomolecule Type: Protein Cargo Gains Ground
Non-coding RNA cargo supplied 34.63% of biomolecule revenue in 2025 through miRNA-based liquid biopsies, yet Proteins & Peptides are expanding at 35.87% CAGR as mass spectrometry exposes receptor phosphorylation patterns that predict drug resistance. Exosomal lipids form a small but growing slice as neurological researchers link ceramides to Alzheimer’s progression. mRNA cargo is advancing in therapeutics, allowing simultaneous delivery of CRISPR mRNA and guide sequences. DNA fragments enable minimal residual disease surveillance and are gaining diagnostic adoption.
Protein-profiling alliances with checkpoint-inhibitor drug makers highlight revenue potential: surface markers such as phosphorylated EGFR forecast response to kinase inhibitors, letting oncologists pre-empt resistance. RNA-based tests remain vital for early cancer detection, ensuring both modalities coexist.
By Source: Platelet-Derived Vesicles Lead Growth Curve
MSC-derived vesicles generated 45.13% of 2025 revenue owing to regenerative-medicine programs in orthopedics and cardiology. Platelet-derived exosomes are rising at 31.7% CAGR because their natural affinity for injured endothelium targets drug delivery to ischemic tissue. Tumor-cell-derived vesicles underpin liquid-biopsy diagnostics, while dendritic-cell vesicles progress as cancer vaccines with 38% response in early melanoma testing. Emerging plant- and milk-derived vesicles form a niche for oral delivery of anti-inflammatory compounds.
Platelet vesicles’ angiogenic factor payloads align with cardiovascular therapy needs, whereas MSC sources dominate tissue regeneration. Tumor-derived vesicles remain indispensable for mutation profiling, yet in therapeutics they pose safety concerns due to potential oncogenic cargo.
By Application: Therapeutics Accelerate Past Diagnostics
Diagnostics captured 61.13% of 2025 revenue, especially cancer liquid-biopsy platforms that find mutations weeks before imaging. Therapeutics is the fastest-growing segment at 39.7% CAGR because vesicles deliver payloads that conventional nanoparticles cannot cross biological barriers to reach. Neuro-degenerative and cardiovascular diagnostics offer strong niches as exosomal tau, amyloid-beta, or troponin outperform legacy assays. Infectious-disease tests are expanding quickly in low-resource settings through handheld devices that quantify viral RNA.
On the therapy side, oncology commands investment through engineered vesicles that present tumor antigens, while regenerative medicine relies on MSC vesicles to reduce inflammation and promote angiogenesis. Drug-delivery startups partner with big pharma for CNS and liver indications, validating commercial value.
By End-User: Academic Centers Drive Method Standardization
Pharmaceutical & Biotechnology Companies contributed 49.13% of revenue in 2025 by purchasing GMP-grade vesicles for clinical trials. Academic & Research Institutes are expanding at 37.91% CAGR because national agencies awarded USD 47 million for method-comparison studies, aiming at harmonized GMP frameworks. Hospitals are piloting same-day exosome tests for cancer, while diagnostic centers adopt value-based contracts where payers reimburse tests only if outcomes change treatment.
Academic consortia now own biobanks and share reference materials, accelerating cross-lab reproducibility. Pharmaceutical companies seek outsourced manufacturing, driving demand for ISO 13485 reagents and contract development services.
Geography Analysis
North America produced 48.13% of 2025 revenue as FDA guidance spurred new IND filings, NIH disbursed USD 47 million in grants, and venture investment surpassed USD 600 million. Despite market scale, reimbursement lags because CMS assigned only one new-technology payment code in 2025. Canada and Mexico position themselves as trial hubs, aided by accelerated Phase II approvals and fast-track diagnostics for cervical cancer.
Europe ranked second, with Germany, the United Kingdom, and France adopting EMA’s 2025 stability requirement that lengthens time-to-market but drives quality. Germany cleared a Phase I Pompe-disease trial for an exosome therapy, and U.K. regulators granted breakthrough status to three diagnostics, reducing review cycles to six months. Southern Europe funds regenerative-medicine consortia, while Switzerland and the Netherlands attract venture capital for vaccine adjuvant platforms.
Asia-Pacific is the fastest-growing region at 39.51% CAGR during 2026-2031. China approved three liquid-biopsy kits for hepatocellular carcinoma in 2025, and Beijing’s National Cancer Center rolled out a lung-cancer vesicle test for 10,000 patients, shrinking treatment-decision time from two weeks to three days. Japan’s regenerative-medicine statute permits conditional approval based on Phase II data, enabling quick market entry. India emerges as a cost-effective manufacturing base, offering isolation at USD 50 per gram and clearing two handheld tuberculosis analyzers. Australia and South Korea pursue diagnostic leadership, while Singapore and Thailand focus on dengue and liver-cancer screening.
The Middle East & Africa and South America remain smaller but attractive. A 2025 Ugandan field trial demonstrated a 45-minute HIV viral-load test using a USD 50 analyzer, and Brazil fast-tracked a Zika liquid-biopsy platform. Gulf states build precision-medicine hubs, and Argentina cleared a point-of-care analyzer for Chagas disease.

Competitive Landscape
The exosomes market shows moderate concentration; the top firms, Thermo Fisher Scientific, Qiagen, Danaher, and Lonza, hold significant revenue, leaving room for niche innovators. Thermo Fisher’s 2024 ExoChip integrates isolation hardware with analytics software, reducing sample-to-insight from 40 hours to 2 hours and locking customers into its ecosystem[2]Thermo Fisher Scientific, “ExoChip Platform,” thermofisher.com. Evox Therapeutics acquired Codiak’s gene-delivery technology to escape lipid-nanoparticle patent thickets and target CNS disorders.
Intellectual-property fragmentation persists; about 1,200 live patents exist, 40% from academia. Licensing and cross-licensing dominate deal flow, while newcomers test polymer precipitation to circumvent antibody-capture claims albeit at purity cost. Contract manufacturers consolidate; Lonza bought HansaBioMed’s platform to spread GMP overhead across multiple clients, signaling high entry barriers.
Opportunities lie in point-of-care diagnostics for underserved regions and companion diagnostics aligned with targeted therapies. Platelet- and dendritic-cell vesicle specialists such as EVerZom and Hermes Biosciences diversify application scope by leveraging innate tissue tropism, improving therapeutic indices.
Exosomes Industry Leaders
Thermo Fisher Scientific Inc.
Danaher Corp. (Beckman Coulter)
Qiagen N.V.
Lonza Group Ltd
Fujifilm Holdings Corp.
- *Disclaimer: Major Players sorted in no particular order

Recent Industry Developments
- April 2025: RoosterBio and Thermo Fisher announced a collaboration to accelerate exosome therapies for degenerative disease.
- March 2025: PranaX Corporation licensed exosome technology from the University of Texas MD Anderson Cancer Center to expand regenerative-medicine assets.


Research Methodology Framework and Report Scope
Market Definitions and Key Coverage
Our study treats the exosomes market as the value generated from commercial-scale products, tools, and services that isolate, analyze, or leverage nano-sized vesicles (30-150 nm) secreted by cells for diagnostics, therapeutics, drug delivery, and life-science research. Revenues are counted at the point of sale by manufacturers and specialized service providers across laboratory kits and reagents, instruments, and fee-based analytical or production services.
Scope exclusion: larger extracellular vesicles (e.g., micro-vesicles, apoptotic bodies) and cosmetic skin-care uses are left outside the sizing.
Segmentation Overview
- By Product
- Kits & Reagents
- Instruments
- Services & Software
- By Workflow
- Isolation Methods
- Ultracentrifugation
- Immuno-affinity Capture
- Polymer-based Precipitation
- Microfluidic Isolation
- Down-stream Analysis
- Nano-flow Cytometry
- Electron Microscopy
- Mass Spectrometry
- Isolation Methods
- By Biomolecule Type
- Non-coding RNA (miRNA, lncRNA)
- Proteins & Peptides
- Lipids
- mRNA
- DNA Fragments
- By Source (Cell Type)
- MSC-derived
- Tumour-cell-derived
- Dendritic-cell-derived
- Platelet-derived
- Others
- By Application
- Diagnostics
- Cancer
- Neuro-degenerative Diseases
- Cardiovascular Diseases
- Infectious Diseases
- Therapeutics
- Oncology
- Regenerative Medicine
- Drug-Delivery Platforms
- Diagnostics
- By End-user
- Pharmaceutical & Biotechnology Companies
- Academic & Research Institutes
- Hospitals & Clinics
- Diagnostic Centres
- Geography
- North America
- United States
- Canada
- Mexico
- Europe
- Germany
- United Kingdom
- France
- Italy
- Spain
- Rest of Europe
- Asia-Pacific
- China
- Japan
- India
- Australia
- South Korea
- Rest of Asia-Pacific
- Middle East & Africa
- GCC
- South Africa
- Rest of Middle East & Africa
- South America
- Brazil
- Argentina
- Rest of South America
- North America
Detailed Research Methodology and Data Validation
Primary Research
To close gaps, we interview kit manufacturers, CRO scientists, hospital lab managers, and biotech executives across North America, Europe, and Asia-Pacific. Conversations validate yield efficiencies, kit replacement cycles, and emerging therapeutic batches, while short online surveys with academic users confirm penetration rates in downstream analysis setups.
Desk Research
Mordor analysts first map the demand pool using publicly traceable sources such as the National Institutes of Health grant database, ClinicalTrials.gov enrolment logs, World Health Organization Cancer Observatory, and import-export shipment tallies compiled by UN Comtrade. We layer in usage norms from trade groups like the International Society for Extracellular Vesicles and regional patent trends retrieved from Questel. Company 10-Ks, investor decks, and peer-reviewed articles in journals like Nature Biotechnology provide average selling prices, workflow adoption curves, and regulatory milestones. These sources illustrate volumes, price brackets, and geographic spread, yet they seldom reveal complete end-user spending; therefore, they form only the spine of our model. The desk-research list is indicative, not exhaustive.
Market-Sizing and Forecasting
We anchor the market by applying a top-down "research and clinical workload reconstruction" that converts published cancer incidence, active trial counts, and average test panels per sample into estimated kit and service volumes; regional ASPs then yield 2024 revenue.
Bottom-up spot checks, supplier roll-ups, and sampled ASP x volume invoices calibrate each segment before final reconciliation. Key variables include: - Annual oncology biopsy volumes using liquid-biopsy protocols - Average exosome isolation yield per sample and associated kit burn rate - ASP progression for magnet-bead kits versus polymer precipitation kits - Therapeutic batch sizes entering Phase I trials.
A multivariate regression with lagged oncology incidence and R&D funding predicts demand, while ARIMA smooths short-term fluctuations in kit pricing. Where supplier data are thin, best-fit coefficients are adjusted within ranges confirmed by two independent interviewees.
Data Validation and Update Cycle
Model outputs run through variance checks against trade statistics and quarterly earnings. An internal peer review flags anomalies; figures are refreshed annually or sooner if material events, such as a major therapy approval, shift market dynamics. Before release, a final analyst pass ensures clients receive the latest view.
Why Mordor's Global Exosomes Market Research Report On Size, Share and Growth Analysis Baseline Earns Trust
Published values differ because firms apply unique scopes, price ladders, and refresh rhythms. Some restrict coverage to research kits, while others fold in early-stage therapeutics or regional roll-ups using outdated exchange rates.
Key gap drivers include differing inclusion of fee-based services, assumptions for kit replacement frequency, and whether pipeline therapy revenues are front-loaded or recognized post-approval.
Benchmark comparison
| Market Size | Anonymized source | Primary gap driver |
|---|---|---|
| USD 430 million (2024) | Mordor Intelligence | - |
| USD 177 million (2024) | Global Consultancy A | excludes fee-based analytics; uses uniform ASP across regions |
| USD 214 million (2025) | Global Consultancy B | omits therapeutic GMP services; older currency conversions |
These contrasts show that Mordor's disciplined scope selection, dual-stage validation, and annual refresh produce a balanced, reproducible baseline that decision-makers can rely on with confidence.


Key Questions Answered in the Report
What is the projected value of the exosomes market in 2031?
The sector is forecast to reach USD 2.78 billion by 2031.
Which product category is growing fastest?
Services & Software is expanding at a 39.25% CAGR through 2031.
Why are platelet-derived vesicles attracting attention?
Their natural affinity for inflamed endothelium supports targeted cardiovascular therapies and drives a 31.7% CAGR through 2031.
Which region shows the highest growth rate?
Asia-Pacific is rising at a 39.51% CAGR due to regulatory approvals in China and Japan.
What is the chief hurdle to clinical translation?
Lack of standardized characterization protocols undermines reproducibility and slows approvals.
Page last updated on:


