
Market Overview
| Study Period | 2021 - 2031 |
|---|---|
| Forecast Data Period | 2026 - 2031 |
| Base Year Market Size (2025) | USD 36.49 Billion |
| Market Size (2026) | USD 38.05 Billion |
| Market Size (2031) | USD 46.92 Billion |
| Growth Rate (2026 - 2031) | 4.28 % |
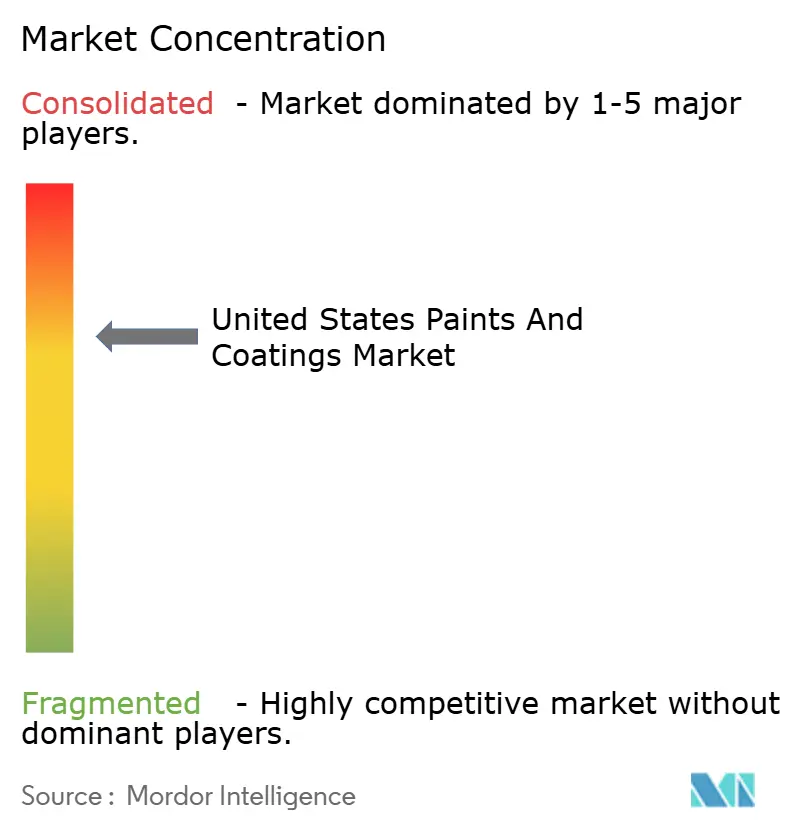
| Market Concentration | Medium |
Major Players *Disclaimer: Major Players sorted in no particular order Image © Mordor Intelligence. Reuse requires attribution under CC BY 4.0. | |
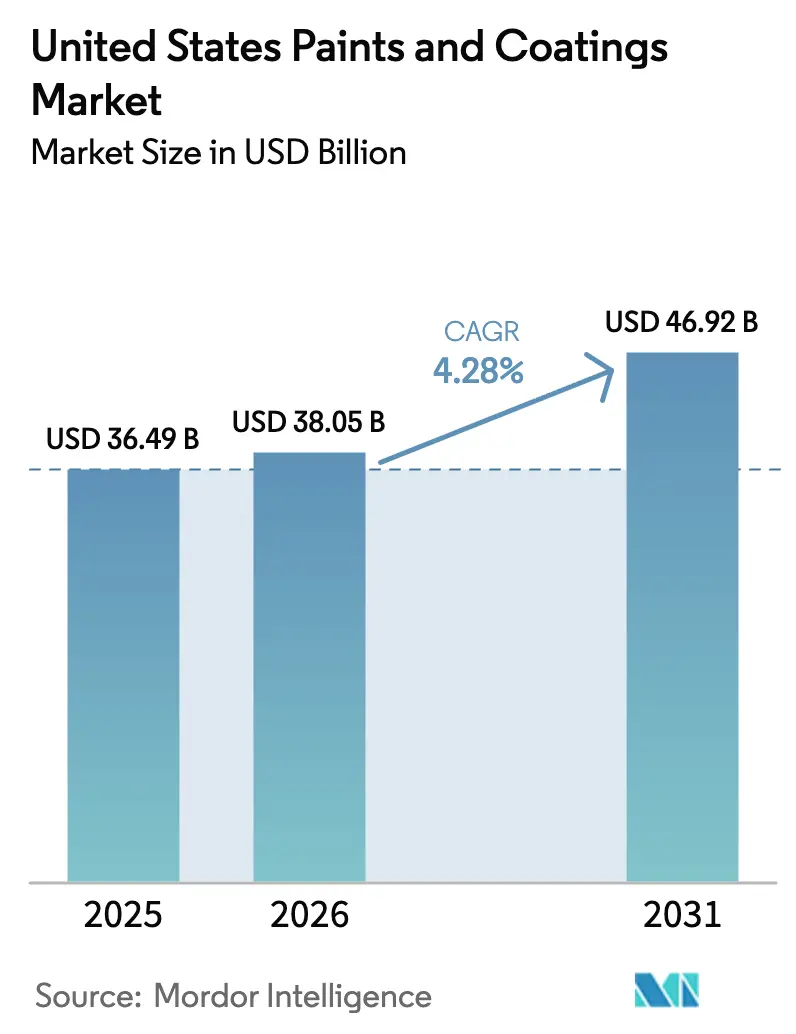
United States Paints And Coatings Market Analysis by Mordor Intelligence
The United States Paints and Coatings Market size is projected to expand from USD 36.49 billion in 2025 and USD 38.05 billion in 2026 to USD 46.92 billion by 2031, registering a CAGR of 4.28% between 2026 to 2031. Infrastructure outlays under the Infrastructure Investment and Jobs Act, consistent home-remodeling activity, and rapid diffusion of water-borne as well as UV-curable technologies are the primary engines behind this expansion. Federal bridge and highway budgets lengthen project backlogs for protective-coatings suppliers, while a buoyant residential remodeling pipeline supports architectural volumes. Technology shifts toward low-volatile-organic-compound (VOC) systems let manufacturers safeguard their share amid stricter state rules, especially in California and the Northeast. On the demand side, electric-vehicle (EV) finishes that tolerate aluminum and composite substrates lift average selling prices within automotive original equipment manufacturer (OEM) coatings. Channel dynamics are equally influential: company-owned stores still dominate professional sales, but big-box retailers are enlarging pro desks and click-and-collect options to capture contractor loyalty.
Key Report Takeaways
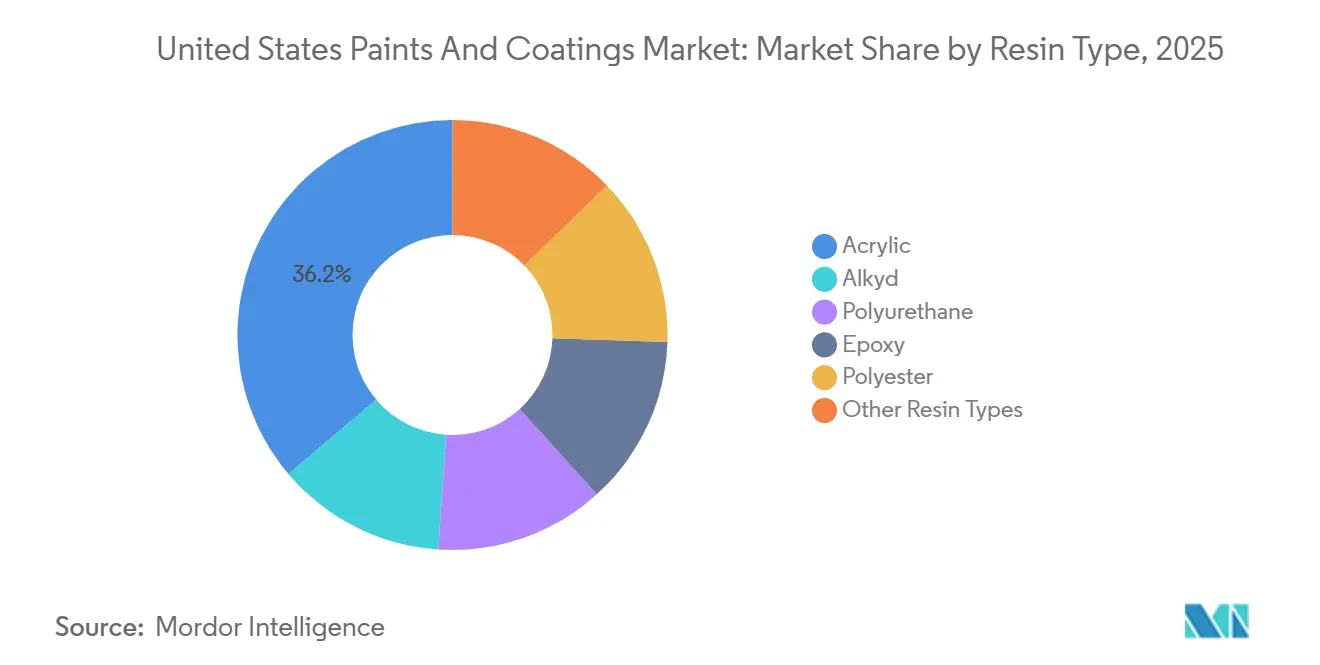
- By resin type, acrylic captured 36.18% of the United States paints and coatings market share in 2025; polyurethane is forecast to expand at a 5.16% CAGR through 2031.
- By technology, water-borne formulations accounted for 68.24% of the United States paints and coatings market size in 2025 and are advancing at a 5.36% CAGR through 2031.
- By distribution channel, company-owned stores held 40.66% revenue in 2025, while big-box retailers and home centers recorded the fastest 7.04% CAGR to 2031.
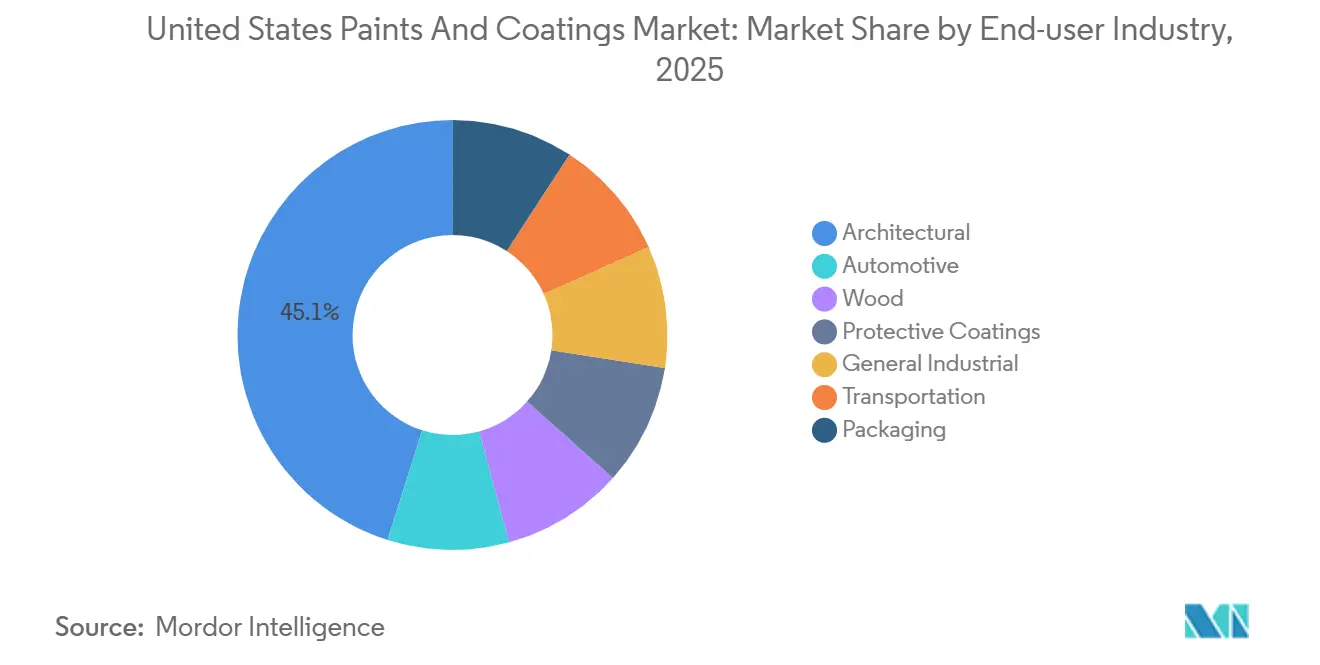
- By end-user industry, architectural coatings represented 45.12% value in 2025 and are growing at a 5.02% CAGR to 2031.
Note: Market size and forecast figures in this report are generated using Mordor Intelligence’s proprietary estimation framework, updated with the latest available data and insights as of January 2026.
United States Paints And Coatings Market Trends and Insights
Drivers Impact Analysis*
| Drivers | (~) % Impact on CAGR Forecast | Geographic Relevance | Impact Timeline |
|---|---|---|---|
| Federal Infrastructure and Jobs Act boosts bridge/highway coatings | +0.8% | National, with concentration in Midwest and Northeast corridors | Medium term (2-4 years) |
| Home-remodeling boom lifts DIY architectural demand | +1.2% | National, strongest in Sun Belt and coastal metros | Short term (≤ 2 years) |
| Shift to water-borne and UV-curable systems to meet VOC rules | +0.9% | National, California and Northeast states leading | Medium term (2-4 years) |
| Automotive production rebound raises OEM and refinish volumes | +0.6% | Midwest manufacturing belt, Southern EV assembly hubs | Short term (≤ 2 years) |
| Antimicrobial coatings adoption in healthcare facilities | +0.3% | National, urban hospital systems and long-term care facilities | Long term (≥ 4 years) |
| Source: Mordor Intelligence | |||
Federal Infrastructure Spending Propels Protective Coatings
The allocation for roads and bridges is driving demand for zinc-rich primers, epoxies, and polyurethane topcoats, all promising a 25-year service life[1]United States International Trade Commission, “USMCA Rules of Origin Economic Impact Report 2024,” usitc.gov. Contractors are leaning towards single-coat products like Sherwin-Williams' Acrolon 680, which not only reduces lane-closure time but also adheres to strict SSPC specifications. Suppliers boasting NORSOK and ISO performance records are reaping premium margins, and steel fabrication hubs in the Midwest are witnessing a boost in orders, thanks to bridge refurbishments.
Home-Remodeling Boom Bolsters Architectural Paints
By Q3 2025, Harvard’s Joint Center for Housing Studies projects residential remodeling outlays to grow steadily, underscoring the resilience of do-it-yourself (DIY) demand. In fiscal 2024, Home Depot reported strong paint sales. This surge in sales led Home Depot to bolster its pro-contractor platform, following its acquisition of SRS Distribution. In 2024, Sherwin-Williams expanded its footprint by adding more stores, optimizing its network for same-day deliveries. Meanwhile, BEHR capitalized on its exclusive partnership with Home Depot, significantly contributing to Masco's revenue. Although e-commerce accounts for a modest share of paint sales, there's a notable uptick in repeat orders through click-and-collect, particularly benefiting contractors with tight job schedules.
Low-VOC Systems Gain Share Under Stricter Rules
In January 2025, the EPA tightened VOC ceilings for aerosol coatings, pushing formulators to adopt acrylic and polyurethane dispersions with emissions below 50 g/L. Water-borne products continue to dominate the market and show strong growth potential among technologies. PPG's DuraNext line, a UV-curable product, alongside Allnex's UV powder resins, achieved near-zero emissions and rapid line speeds, aiding manufacturers in meeting ISO 14067's carbon footprint standards. California's South Coast district has set a national benchmark, prompting quicker adoption in other states.
Automotive Recovery Lifts OEM Coatings
PPG's automotive OEM division reported a sales increase in Q3 2025, driven by the growing demand for premium EV color packages and specialized conductive primers designed for aluminum bodies. While refinish volumes dipped, attributed to a decline in collisions, this was counterbalanced by robust OEM demand from Southern EV plants. As the megacasting trend gains traction, there's a heightened need for coatings that cure swiftly on larger components. This has catalyzed research and development efforts towards developing new polyurethane clear coats with expedited bake cycles.
Restraints Impact Analysis*
| Restraints | (~) % Impact on CAGR Forecast | Geographic Relevance | Impact Timeline |
|---|---|---|---|
| Volatile TiO₂ prices compress margins | -0.7% | National, acute for architectural and general industrial segments | Short term (≤ 2 years) |
| Shortage of certified industrial painters delays projects | -0.2% | National, concentrated in Gulf Coast petrochemical corridor | Medium term (2-4 years) |
| Freight-cost inflation disrupts retailer inventory cycles | -0.4% | National, most severe in West Coast and rural distribution | Short term (≤ 2 years) |
| Source: Mordor Intelligence | |||
Volatile TiO₂ Prices Pressure Margins
Chemours and Tronox control a significant portion of the global TiO₂ supply, and their chlorination-based U.S. assets expose formulators to both energy swings and stricter environmental compliance[2]Chemours Company, “Titanium Dioxide Market Update Q2 2025,” chemours.com. Pigment prices remain elevated compared to levels seen before 2020. While Masco has successfully enhanced its margins via hedging and substituting extenders, the diminished hiding power of these substitutes constrains the extent to which calcium carbonate or kaolin can replace TiO₂ in high-end interior paints.
Freight-Cost Inflation Strains Dealer Inventories
Independent dealers, facing elevated less-than-truckload (LTL) rates, are compelled to bolster their working capital to avert stock-outs. Home Depot's acquisition of SRS Distribution empowers it to promise next-day deliveries for contractors. Meanwhile, Sherwin-Williams, with its owned-store model, mitigates inbound volatility but still grapples with elevated diesel surcharges. In 2024, port congestion on the West Coast postponed specialty resin imports, extending lead times for high-performance coatings.
*Our forecasts treat driver/restraint impacts as directional, not additive. The impact forecasts reflect baseline growth, mix effects, and variable interactions.
Segment Analysis
By Resin Type: Polyurethane Extends Protective Performance
In 2025, acrylics commanded 36.18% of resin consumption within the United States paints and coatings market, thanks to low odor and quick dry in DIY applications. Polyurethane is slated for a 5.16% CAGR to 2031, outpacing all other resins as bridge, marine, and industrial users prioritize abrasion and chemical resistance. Alkyd demand keeps shrinking under VOC curbs, yet remains relevant for penetrating wood stains. Epoxy dominates heavy-duty primers and floor coatings, benefiting from bridge and offshore wind investments. Polyester, integral to powder coatings, gains from appliance and furniture output, aided by BASF’s new neopentyl glycol supply that lowers product carbon footprints.
Other chemistries, such as vinyl, silicone, and fluoropolymers, fill niche roles. Arkema’s PVDF capacity addition in Kentucky supports high-rise facades that need ultraviolet durability. Silicone resins from Dow and Wacker enable heat-stable finishes on exhaust systems, while fluoropolymer topcoats protect EV battery casings against electrolyte spills. Tailored polymer architectures therefore multiply formulation complexity, discouraging commoditization and raising switching costs.



By Technology: Water-Borne Coatings Dominate Low-Emission Shift
Water-borne systems accounted for 68.24% of the 2025 volume in the United States paints and coatings market and exhibit the swiftest 5.36% CAGR outlook to 2031. Solvent-borne coatings still serve aerospace, marine, and heavy-equipment niches where humidity tolerance and cold-spray properties outweigh emission penalties. Powder coatings, free of solvents and offering 95% transfer efficiency, advance in metal furniture and appliances, while UV-curable coatings penetrate wood flooring and packaging thanks to instant cure and minimal energy use.
End-use variation is stark: architectural interiors are nearly all latex, automotive OEM uses hybrid film stacks, and industrial maintenance leans on high-solids epoxies. Regulatory clamp-downs by the EPA and state air-quality boards continue to push research and development funds toward water-borne and UV chemistries that can match solvent-borne gloss and mar resistance. Manufacturers that master these conversions secure brand equity in sustainability-driven procurement.
By Distribution Channel: Big-Box Retailers Accelerate Contractor Capture
Company-owned outlets represented 40.66% of 2025 sales, anchored by Sherwin-Williams’ 4,800-store network. However, big-box retailers post a 7.04% CAGR through 2031, the quickest among channels, after investing in pro desks, volume pricing, and same-day fulfillment. Home Depot’s SRS buy adds roofing and drywall supply lines that naturally bundle paint, stretching the retailer’s contractor relevance. Independent dealers guard their share with custom tinting, credit, and technical advice, but freight inflation squeezes their thin margins.
Digital commerce remains modest in the United States paints and coatings market, held back by color-match complexity and hazmat shipping restrictions. Nonetheless, contractors appreciate click-and-collect for repeat SKUs, encouraging manufacturers to refine online configurators that sync with store tinting systems.
By End-User Industry: Architectural Coatings Retain Primacy
Architectural applications delivered 45.12% of 2025 revenue and carry a 5.02% CAGR, hinging on remodeling and multifamily construction. Automotive coatings benefit from EV lineups that raise coat counts and introduce conductive primers, even as collision-repair volumes slip. Wood-finish demand rises with furniture and cabinetry orders, where water-borne and UV lacquers reduce plant fire risk. Protective coatings growth accelerates under infrastructure outlays and offshore wind towers needing 25-year corrosion guarantees.
General industrial and transportation coatings adopt powder and high-solids polyurethane for machinery, rail cars, and buses, balancing quick turnarounds with durability demands. Packaging leads the shift to bisphenol-A-free can linings, where PPG’s Innovel enables major beverage brands to meet new food-contact limits. AkzoNobel has launched its Accelshield range, bolstered by a dedicated plant in Spain, focusing on non-epoxy chemistries.
Geography Analysis
The United States paints and coatings market reflects distinct regional rhythms. Sun Belt states such as Texas, Florida, and the Carolinas command architectural volumes through robust single-family starts and remodeling. Midwest manufacturing hubs in Michigan and Ohio fuel OEM and industrial demand, though EV investment volatility clouds long-range forecasts. The Northeast, with aging bridges and tight VOC caps below 50 g/L, prefers low-emission water-borne systems. California’s South Coast Air Quality Management District remains the bellwether for future national standards, nudging nationwide innovation.
Pacific Northwest aerospace clusters around Seattle generate steady orders for high-performance primers and sealants; PPG’s forthcoming Shelby, North Carolina plant targets just-in-time supply for these programs. The Gulf Coast petrochemical belt depends on multi-layer epoxies and polyurethanes that resist saltwater and hydrogen sulfide, making it the largest pocket for protective coatings. Independent dealers here often bundle coatings with abrasive-blasting services, deepening local ecosystems.
Mountain West and Great Plains territories face long freight hauls, raising landed costs and prompting cooperatives to stock multipurpose farm-equipment paints. Offshore wind projects from Massachusetts to Virginia unlock a fresh niche for NORSOK-compliant systems rated for 25-year immersion, positioning suppliers capable of on-site technical audits to capture price premiums. Federal infrastructure grants further tilt coatings shipments toward states with the densest bridge-rehabilitation schedules.
Value Chain Analysis
The United States paints and coatings value chain begins with upstream feedstocks and intermediates, where petrochemical derivatives (monomers and solvents), pigments (notably TiO2), and specialty additives feed into resin and dispersion manufacturing before being formulated into architectural, industrial, protective, and OEM coatings. Cost and availability at the input stage remain a key lever for formulators because energy and crude-linked chemicals pass through multiple layers of the bill of materials, and concentrated pigment supply heightens sensitivity to price moves.
Midstream value creation is concentrated in formulation, color-matching, and compliance-driven reformulation, including low-VOC water-borne, UV-curable, and powder systems. Downstream, go-to-market splits across company-owned store networks serving professional contractors, big-box retailers and home centers that strengthen pro fulfillment, and direct-to-OEM and industrial accounts supported by technical service, specification support for infrastructure and protective work, and contractor training. Logistics reliability and lead times are shaped by distribution footprints and working-capital capacity, with investments in regional production and distribution, and retailer-focused delivery platforms, used to reduce freight friction and improve jobsite availability.
Competitive Landscape
The United States paints and coatings market studied is moderately consolidated. Innovation centers on sustainability and performance. Machine-learning-aided formulation, exemplified by PPG’s Deltron Premium Glamour Speed clear coat, cuts cycle times on luxury vehicles. Self-healing polymers, UV powder resins, and antimicrobial additives occupy current patent pipelines, though commercialization relies on complex regulatory clearances. Raw-material integration, especially in resins and pigments, offers cost buffers against TiO₂ and monomer volatility, giving scale players a durable edge over regional specialists.
United States Paints And Coatings Industry Leaders
The Sherwin-Williams Company
PPG Industries, Inc.
RPM International Inc.
Axalta Coating Systems, LLC
Masco Corporation
- *Disclaimer: Major Players sorted in no particular order

Market Opportunities and Future Outlook
Capacity additions and network optimization create near-term whitespace in higher-performance segments where lead times, qualification, and technical service matter as much as price. In 2026, multiple players moved to expand or modernize US manufacturing and distribution, including AkzoNobel launching an investment program to upgrade its Waukegan, Illinois aerospace coatings operations (paired with warehousing relocation), Sherwin-Williams completing a major expansion at its Bowling Green, Kentucky coil coatings plant, and WEG inaugurating new North American coatings manufacturing and distribution sites tied to its Heresite Protective Coatings assets. These actions point to competition for faster supply to aerospace, coil, and heavy-duty protective demand centers, and they create openings for suppliers that can offer qualified, spec-ready systems alongside responsive logistics.
Input security and regulatory-driven reformulation continue to influence product and procurement choices, which supports opportunities for localized pigment and resin supply and for low-emission technologies that reduce compliance complexity for customers. Sun Chemical announced a USD 10 million expansion of quinacridone pigment capacity in Newport, Delaware (2026), highlighting renewed investment in color and performance inputs used across industrial and architectural applications. At the same time, the market continues to emphasize water-borne, UV-curable, and powder routes as manufacturers and end users align product portfolios with tighter VOC requirements and sustainability-driven specifications in construction, infrastructure maintenance, and OEM finishing.
Recent Industry Developments
- June 2026: The Pittsburgh Paints Co. introduced PITTSBURGH PAINTS Protective Coatings as the new identity for PPG HIGH PERFORMANCE COATINGS. The rebrand consolidates a major protective portfolio under a dedicated label, supporting specification pull-through in infrastructure and industrial maintenance channels while sharpening go-to-market separation across PPG-aligned brands.
- May 2025: PPG announced plans to invest USD 380 million to build a new aerospace coatings and sealants manufacturing facility in Shelby, North Carolina. The project strengthens US-based supply for aerospace programs and adds domestic capacity for high-spec coatings and sealants where qualification and on-time delivery are critical.
- May 2024: PPG outlined a USD 300 million investment plan for advanced manufacturing across North America to support demand for automotive paints and coatings. The program targets manufacturing modernization and capacity readiness, reinforcing the companys ability to serve OEM production requirements and evolving finish technologies.


Research Methodology Framework and Report Scope
Market Definition and Coverage
For this study, the market covers paints and coatings sold in the United States that form a protective or decorative film on a surface after application. It includes solvent-borne, water-borne, powder, and UV-cured coating systems used across common building and industrial applications.
Scope exclusions: Printing inks, adhesives, and raw resin sales are excluded from the market value.
Segmentation Overview
- By Resin Type
- Acrylic
- Alkyd
- Polyurethane
- Epoxy
- Polyester
- Other Resin Types
- By Technology
- Water-borne
- Solvent-borne
- Powder Coating
- UV Technology
- By Distribution Channel
- Company-Owned Stores
- Independent Paint Dealers
- Big-Box Retailers and Home Centers
- Direct to Industrial OEM
- E-Commerce
- By End-user Industry
- Architectural
- Automotive
- Wood
- Protective Coatings
- General Industrial
- Transportation
- Packaging
Data Sources, Market Sizing, and Validation
Desk Research
Desk work starts with building a clean demand context for coatings in the United States, and then translating that context into measurable inputs. Public sources such as US Census Bureau construction spending and manufacturing data, the Bureau of Labor Statistics price series, the US International Trade Commission trade statistics, and EPA VOC related rules and technical documents help set realistic trends for volume, mix shifts, and compliance driven formulation changes.
We also reference company annual reports and investor presentations, product technical data sheets, and credible industry press to understand technology adoption like water-borne and UV-cured systems, plus end-use exposure like housing repair and remodeling and industrial activity. In parallel, we use paid subscriptions for company financials and intelligence, patents coverage, and shipment level import and export checks to validate directional moves that are hard to see in one public dataset. The sources listed here are illustrative only, and many other public and paid references were used for collection, cross-checking, and clarification.
Primary Interviews and Surveys
Field validation is done through expert discussions and structured surveys across the value chain, including raw material focused contacts, formulators, distributors, and large buyer groups like contractors and industrial maintenance teams. For a US market, coverage is balanced across major consuming regions, and we revisit key assumptions when interview feedback shows a mismatch in pricing, technology mix, or end-use activity signals.
Distribution of primary research fieldwork respondents
| Company type | Respondent position |
|---|---|
| Top tier: 27% | CXOs: 14% |
| Mid tier: 55% | Functional/Unit leaders: 39% |
| Smaller Players: 18% | Managers: 47% |
Market-Sizing & Forecasting
Sizing begins with a top-down build that ties coatings demand to visible end-use pools, and then converts those pools into value using realistic pricing and mix. For the United States paints and coatings market, we anchor the model on construction and renovation activity, industrial production indicators, automotive build and refinish intensity, and packaging output signals, which are then adjusted for technology shifts between water-borne, solvent-borne, powder, and UV-cured coatings.
To keep the total grounded, we corroborate the result with selective bottom-up approximations like supplier and channel roll-ups, sampled average selling price checks by major coating families, and import and export movements for relevant coating products. Where direct data is thin, gaps are handled through proxy relationships, such as linking maintenance repaint cycles to housing stock trends, and then stress-testing the implied volumes against known capacity and utilization commentary shared by interviewees.
Forecasting is performed using scenario analysis supported by trend lines from the key drivers, followed by regression style checks on the strongest variables (for example construction activity and industrial output). Assumptions on price progression and mix are refreshed using primary inputs so the forecast reflects how low-VOC rules and performance upgrades can change value even when volumes move slowly.
Data Validation & Update Cycle
Before finalizing results, outputs are checked against independent signals like coatings related trade flows, published macro indicators tied to construction and manufacturing, and the implied pricing path from public inflation series. Any large variances are investigated, then the model is reviewed across multiple analyst steps so definitions, arithmetic, and assumptions remain consistent.
Reports are refreshed annually, and interim updates are triggered when material events occur (for example sharp shifts in construction activity, regulatory changes affecting solvent systems, or major pricing resets). Right before delivery, we do a fresh pass on the key inputs and narratives so clients receive an updated view that matches the latest available evidence.
Mordor Intelligence's United States Paints Coatings Market Estimate Compared With Other Published Estimates
Published market values for US paints and coatings do not always match, and this usually comes from differences in what is counted and how pricing is translated into revenue. Timing also matters because base years, inflation handling, and currency treatment can shift totals even when the same industry is being discussed.
Some estimates stay closer to architectural and a limited set of industrial uses, and they also tend to rely more on broad revenue splits by product type. Mordor Intelligence counts film-forming paints and coatings across architectural, automotive OEM and refinish, wood, general industrial, protective, transportation, and packaging uses, and it also excludes printing inks, adhesives, and raw resin sales, which changes the summed revenue pool and the implied mix.
Benchmark comparison
| Source | Market Size | Gaps in Research Methodology |
|---|---|---|
| Mordor Intelligence | USD 36.49 B (2025) | |
| Global Consultancy A | USD 32.94 B (2025) | Often presented with a narrower end-use lens that leans toward building and a few industrial categories, which can undercount protective, transportation, and packaging coatings. Base-year conversion from a 2024 anchor can also dampen the 2025 value if pricing escalation is smoothed. |
| Industry Publisher B | USD 33.40 B (2024) | Uses a different base year and may apply a single growth path across resin or technology groupings, which can miss mix shifts toward higher value systems. Limited visibility on explicit exclusions can also lead to different treatment of adjacent products that are not always coatings revenue. |
Overall, the spread across sources is explained mostly by scope and timing, followed by how price and mix are carried forward. By keeping the included uses explicit and tying the model to observable construction, industrial, and automotive signals, we get a market value that can be repeated and audited with clear inputs.


Key Questions Answered in the Report
How large will the United States paints and coatings market be by 2031?
It is forecast to reach USD 46.92 billion by 2031, growing at a 4.28% CAGR from USD 38.05 billion in 2026.
Which resin type is growing the fastest?
Polyurethane leads with a projected 5.16% CAGR through 2031 due to its superior durability in protective uses.
Why are water-borne coatings gaining share?
Stricter VOC regulations and corporate carbon targets push formulators and buyers toward low-emission water-borne systems, which already hold 68.24% volume in 2025.
What is driving sales through big-box retailers?
Expanded pro-contractor programs, job-site delivery, and click-and-collect services underpin the segment’s 7.04% CAGR outlook.
How does federal infrastructure funding influence demand?
The allocation for roads and bridges extends to order pipelines for high-performance protective coatings with 25-year life requirements.
Page last updated on:





