
Market Overview
| Study Period | 2020 - 2031 |
|---|---|
| Market Size (2026) | USD 117.5 Billion |
| Market Size (2031) | USD 146.08 Billion |
| Growth Rate (2026 - 2031) | 4.45 % |
| Fastest Growing Market | Asia Pacific |
| Largest Market | Asia Pacific |
| Market Concentration | Medium |
Major Players *Disclaimer: Major Players sorted in no particular order Image © Mordor Intelligence. Reuse requires attribution under CC BY 4.0. | |
Metal Finishing Market Analysis by Mordor Intelligence
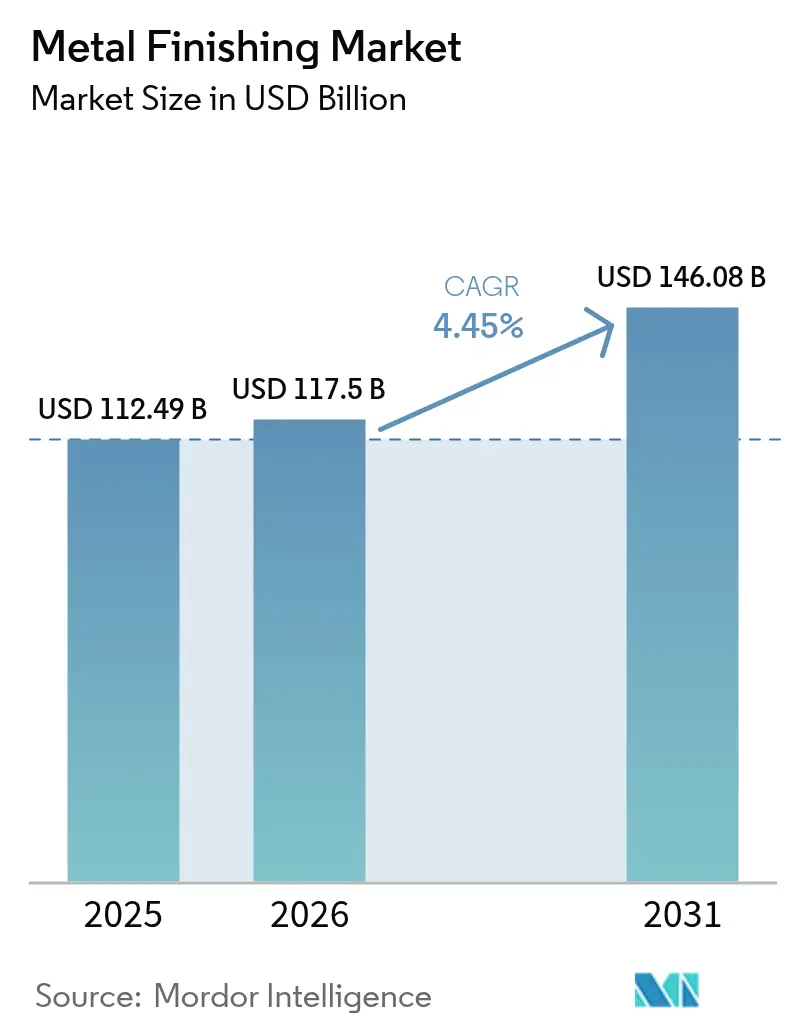
Metal Finishing Market size in 2026 is estimated at USD 117.5 billion, growing from 2025 value of USD 112.49 billion with 2031 projections showing USD 146.08 billion, growing at 4.45% CAGR over 2026-2031. The growing demand for longer-lasting components in automotive, electronics, aerospace, and renewable energy systems drives this expansion, while lightweighting strategies in electric vehicles intensify the need for corrosion-resistant treatments on mixed-material assemblies. Manufacturers integrate AI-driven process controls that cut metal and chemical consumption, helping offset rising nickel and chromium costs tied to supply-chain pressures. Environmental policies restricting PFAS and hexavalent chromium are accelerating the shift to trivalent and bio-based alternatives, prompting high investment in research and development by vertically integrated suppliers. Consolidation continues as global leaders acquire regional specialists to secure technology portfolios and local distribution, sharpening competition around sustainable chemistry platforms.
Key Report Takeaways
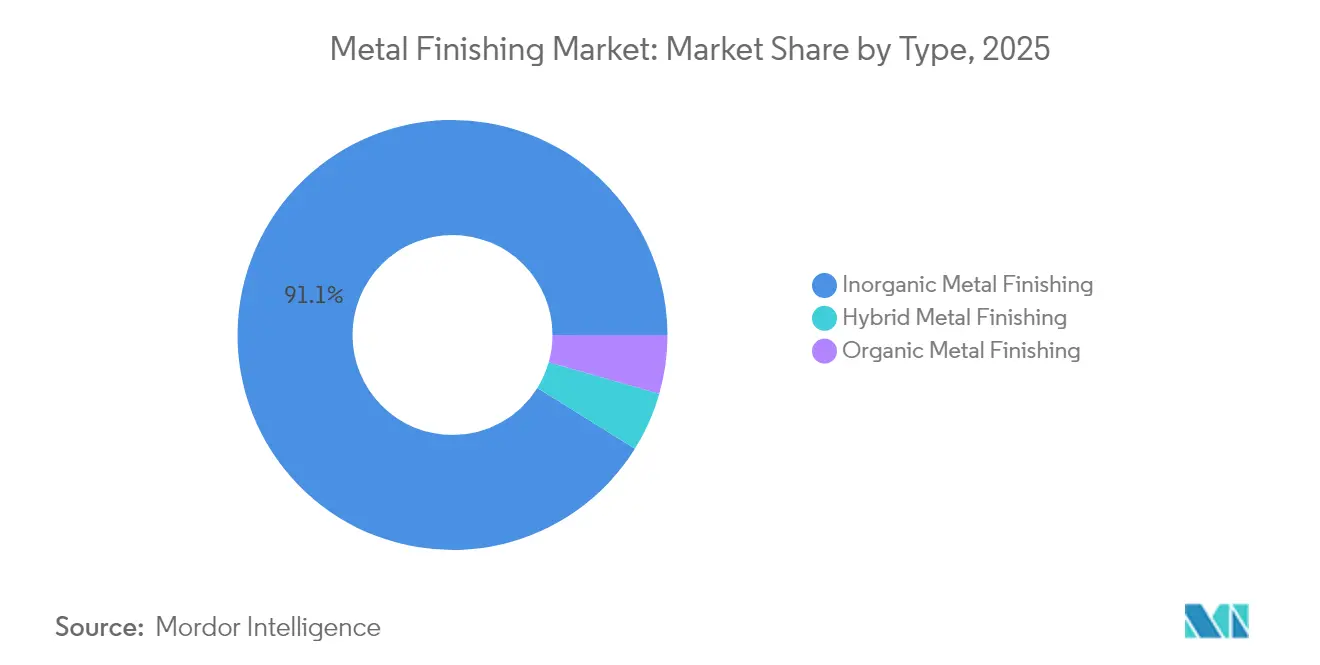
- By type, inorganic processes led with a 91.12% share of the metal finishing market in 2025 and are also projected to register the fastest CAGR of 4.74% through 2031.
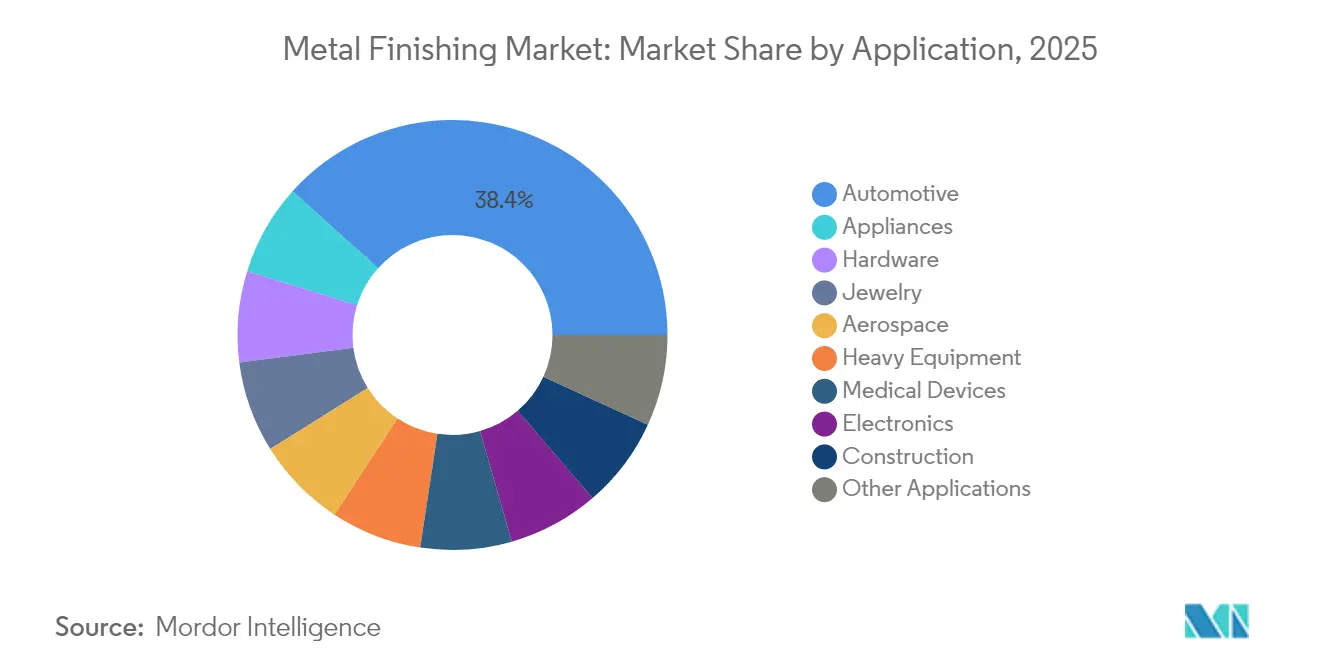
- By application, automotive captured 38.35% of the metal finishing market share in 2025. Medical devices are poised to grow at a 5.22% CAGR to 2031.
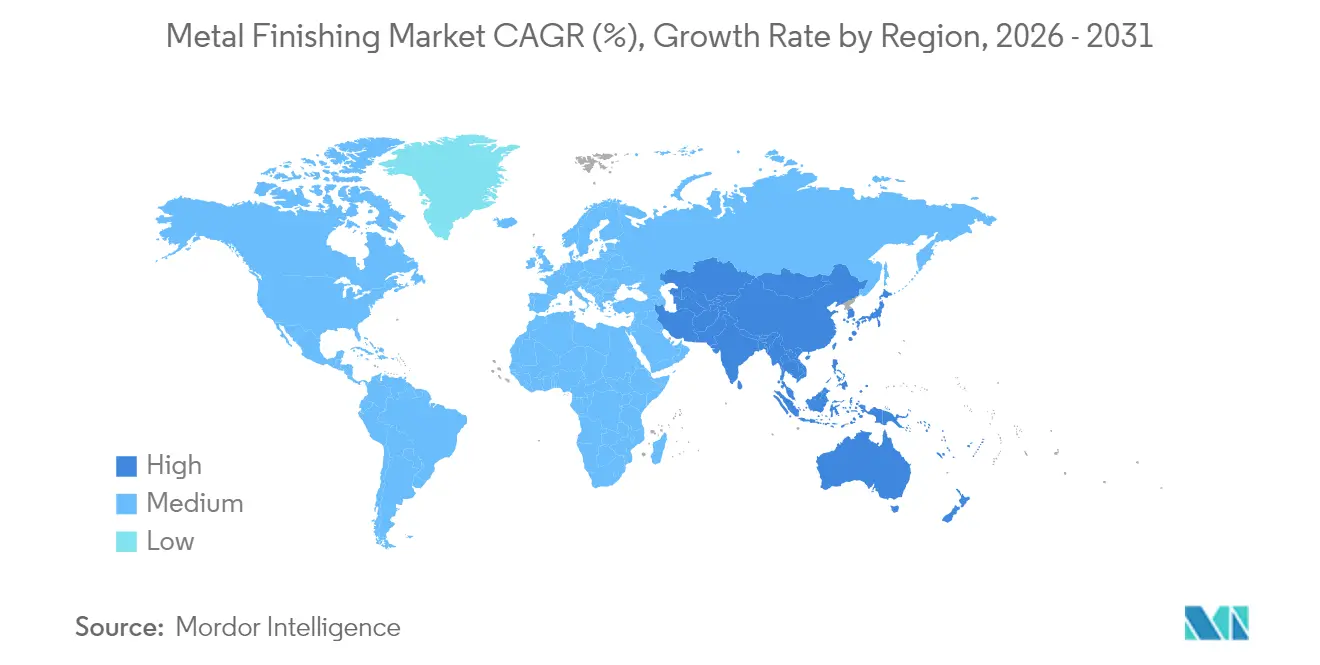
- By geography, the Asia Pacific held 41.05% of the metal finishing market size in 2025 and also records the quickest regional CAGR at 5.18% through 2031.
Note: Market size and forecast figures in this report are generated using Mordor Intelligence’s proprietary estimation framework, updated with the latest available data and insights as of 2026.
Market Trends and Insights
Drivers Impact Analysis of Metal Finishing Market*
| Drivers | (~) % Impact on CAGR Forecast | Geographic Relevance | Impact Timeline |
|---|---|---|---|
| Durable, wear-resistant and long-life product demand | +1.2% | Global, with concentration in North America and Europe | Medium term (2-4 years) |
| Expanding automotive production | +1.5% | APAC core, spill-over to North America | Short term (≤ 2 years) |
| Rapid growth of electronics and PCB manufacturing | +1.1% | APAC dominance, secondary gains in North America | Medium term (2-4 years) |
| OEM shift to eco-chemistries | +0.8% | North America and EU regulatory leadership, APAC adoption following | Long term (≥ 4 years) |
| AI-driven automation boosting plating yields | +0.7% | Advanced manufacturing regions globally | Long term (≥ 4 years) |
| Source: Mordor Intelligence | |||
Durable, Wear-Resistant and Long-Life Product Demand
Industries specifying 25-year service lives in harsh marine and wind-energy settings adopt advanced coatings that extend equipment operating cycles, trimming maintenance budgets and energy use in heavy machinery. Aerospace OEMs pay premiums for hybrid organic-inorganic layers that pair weight reduction with superior abrasion resistance. Renewable-energy component manufacturers incorporate bio-based additives to achieve circular economy goals without compromising performance. Regulatory scrutiny of lifecycle emissions further heightens demand for high-durability finishes.
Expanding Automotive Production
China produces more than 30 million vehicles, with battery electric models accounting for a significant portion of output, fueling orders for aluminum finishing and mixed-material joining solutions. Global OEM investments in finishing-line retrofits in 2024 aim to integrate 800 V architectures that require high-voltage insulation coatings. Gigacasting of large aluminum structures requires tighter surface-treatment tolerances to ensure dimensional accuracy and corrosion resistance for structural components. Domestic content rules in the USMCA economies add near-term capacity expansion in North America.
Rapid Growth of Electronics and PCB Manufacturing
Pulse plating and additive-selective deposition in PCB factories lower metal use, supporting the proliferation of 5G devices. Flexible circuit makers require coatings that can withstand millions of bending cycles without compromising conductivity. Data-center operators seek enhanced heat-sink finishes to optimize liquid-cooling thermal transfer for high-density servers.
OEM Shift to Eco-Chemistries
European REACH rules limit the use of hexavalent chromium, compelling automotive OEMs to qualify trivalent alternatives that offer comparable corrosion protection at a comparable cost[1]European Chemicals Agency, “REACH Regulation Guidelines,” echa.europa.eu . Boeing and Ford supplier mandates aim to eliminate PFAS, creating space for fluorine-free surfactants. Early adopters face cost uplifts, yet long-run savings arise from reduced hazardous-waste disposal fees and favorable ESG disclosures.
Restraints Impact Analysis of Metal Finishing Market*
| Restraints | (~) % Impact on CAGR Forecast | Geographic Relevance | Impact Timeline |
|---|---|---|---|
| Environmental curbs on hazardous chemistries | -1.1% | Global, with the strictest enforcement in the EU and North America | Short term (≤ 2 years) |
| Substitution of metals by plastics and composites | -0.8% | Advanced manufacturing regions, automotive, and aerospace focus | Medium term (2-4 years) |
| Supply-chain volatility for Ni and Cr salts | -0.6% | Global impact, most severe in import-dependent regions | Short term (≤ 2 years) |
| Source: Mordor Intelligence | |||
Environmental Curbs on Hazardous Chemistries
EPA proposals targeting PFAS and Cr (VI) drive compliance expenditures, diverting capital from capacity expansion[2]U.S. Environmental Protection Agency, “Persistent, Bioaccumulative, and Toxic Chemicals under TSCA,” epa.gov. Limited numbers of REACH-authorized chromium suppliers tighten feedstock availability, leading to temporary price premiums. Smaller shops exit the market rather than investing in new wastewater systems, thereby concentrating demand among larger players with robust environmental infrastructure.
Substitution of Metals by Plastics and Composites
Structural battery packs and composite fuselages reduce metallic content, shrinking legacy finishing volumes. Tesla’s 370-part consolidation, achieved through composite structures, highlights this shift. Nevertheless, composite-metal interfaces create galvanic corrosion challenges that spawn new finishing niches focused on specialized primers and sealants that bond dissimilar substrates.
*Our forecasts treat driver/restraint impacts as directional, not additive. The impact forecasts reflect baseline growth, mix effects, and variable interactions.
Metal Finishing Market Segment Analysis
By Type:
Inorganic Dominance Drives Process InnovationInorganic processes accounted for 91.12% of the metal finishing market share in 2025, positioning them as the backbone of high-volume automotive, electronics, and heavy-equipment lines. The metal finishing market size associated with inorganic chemistries is projected to expand at a 4.74% CAGR to 2031, as pulse-plating and alloy-galvanizing technologies improve deposit quality and reduce resource use. Zinc-aluminum coatings are gaining favor in automotive underbody protection due to their enhanced stone-chip resistance and compatibility with mixed-metal substrates. Conversion coatings are shifting toward trivalent chromium, and proprietary sealers are extending corrosion cycles in marine and off-highway machinery.
Appliance producers prefer thin-film powder layers that deliver consistent gloss and color while meeting VOC caps. Hybrid stacks, combining zinc-nickel electroplated bases with polyurethane topcoats, are being used in aerospace landing-gear programs, increasing functional diversity without extending takt time.



By Application:
Performance Diversity Spurs Growth PathsThe automotive sector contributed 38.35% of the metal finishing market share in 2025, and electrification trends are expected to add further volumes in battery collectors, busbars, and thermal plates. AI-optimized spray booths and reel-to-reel plating lines cut cycle time, allowing OEMs to meet rising throughput targets tied to annual EV output increases. Integrated multifunctional coatings embed EMI shielding and thermal dissipation, streamlining part counts in compact drivetrain compartments.
Medical devices represent the fastest-growing end-use, projected at a 5.22% CAGR. The metal finishing market size for medical devices gains from stringent FDA validation rules that favor suppliers with proven process control. Titanium plasma-sprayed surfaces promote bone integration, while antimicrobial silver-ion topcoats reduce the risk of infection on surgical instruments. Contract finishers expand ISO-class clean-room capacity to support next-generation implantable electronics incorporating micro-scale gold and palladium features.
Geography Analysis
APAC Metal Finishing Market
The Asia Pacific controlled 41.05% of the metal finishing market size in 2025 and also recorded the fastest regional CAGR at 5.18% through 2031, buoyed by China’s vehicle output and India’s electronics PLI investments. Regional suppliers incorporate trivalent and fluorine-free chemistries to meet the requirements of their export customers. Japanese OEMs refine zinc-magnesium coatings for long-service vehicles in coastal regions, while South Korean fabs deploy AI-driven plating cells to serve 5nm chip packaging.
North America Metal Finishing Market
North America is also a significant market. USMCA rules push parts sourcing within the bloc, fueling the development of new finishing plants clustered near Mexico-U.S. border assembly hubs. Tesla’s Texas and Nevada expansions consume large volumes of eco-friendly aluminum coatings tuned for gigacasting geometries. Aerospace primes elevate supplier standards around PFAS-free systems, catalyzing research and development spending and capital upgrades.
Europe Metal Finishing Market
Europe maintains its heft through German electric-vehicle programs, aerospace tier-one companies, and stringent green-deal objectives that reward low-carbon processes. The Nordic marine and offshore sectors are seeking ultra-thick zinc-aluminum-magnesium layers that provide sustained corrosion resistance in Arctic conditions. EU circular-economy policies spur innovations in bath recycling and powder reclaim.

Value Chain Analysis
The metal finishing value chain starts with upstream metals and functional chemistry inputs (nickel and chromium salts, zinc and aluminum alloys, acids and alkalis, trivalent conversion chemistries, surfactants and mist suppressants, sealers, and process additives), then moves through equipment and consumables suppliers (rectifiers, anodes, filtration, membrane systems, automation and metrology, racks and fixtures) into job shops and captive finishing lines in automotive, electronics/PCB, aerospace, heavy equipment, medical devices, and construction. Downstream, the chain includes OEM qualification and audit programs, distribution of specialty chemicals and spares, and waste management partners for wastewater treatment, sludge handling, and bath reclamation, with compliance obligations shaped by point-source rules such as the US EPA Metal Finishing Effluent Guidelines (40 CFR Part 433) covering electroplating, anodizing, coating, chemical milling, and PCB manufacturing.
Bottlenecks and cost drivers increasingly sit at the intersection of materials and compliance. Supply-chain volatility in nickel and chromium salts pushes finishers toward tighter process controls, yield improvements, and alloy or chemistry substitution where specifications allow, while PFAS and hexavalent chromium scrutiny changes the availability and acceptable use of legacy mist suppressants in chrome operations. Regulatory fragmentation also affects network design and investment planning, for example Colorado Air Quality Control Commission revisions to Regulation 30 in 2026 that restrict new hexavalent chromium finishing lines and add control and housekeeping requirements for existing facilities, which can shift work toward larger operators with robust containment and wastewater infrastructure.
Competitive Landscape
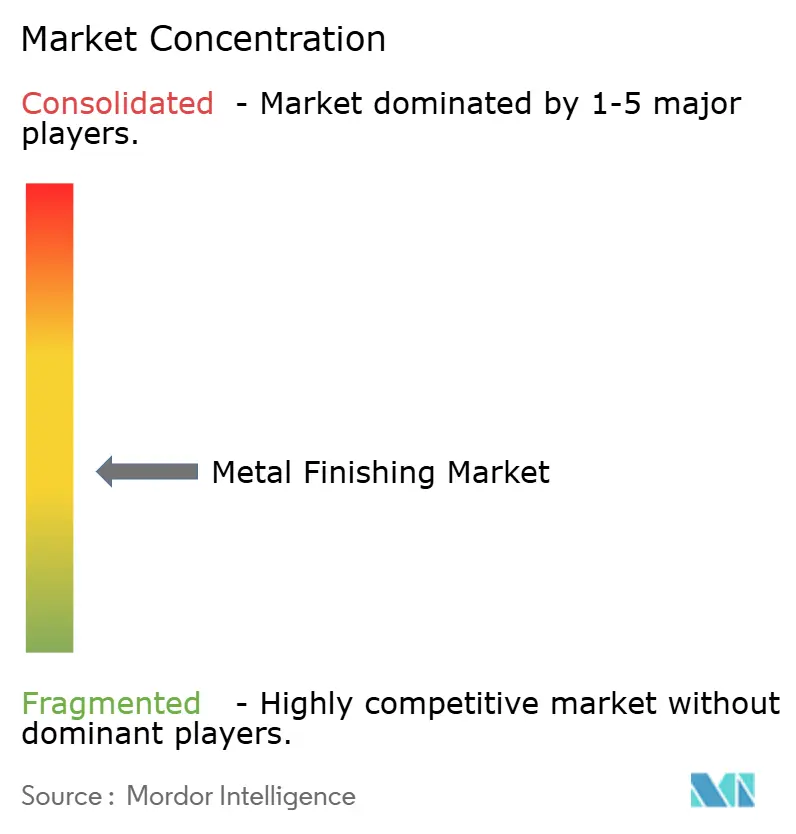
The metal finishing market is moderately fragmented, with global chemistry majors leveraging scale and vertical integration, while regional specialists supply tailored eco-platforms. Technology adoption forms a clear divide. Large OEM-aligned finishers invest in AI-enhanced quality systems and closed-loop water treatment, resulting in efficiency gains and improved ESG scores. Smaller shops concentrate on cost-effective service in local supply chains but face rising compliance hurdles and material volatility that compress margins. Vendors cultivating bio-based formulations or PFAS-free surfactants gain early-mover advantage as global brands set phased substance bans. Emerging opportunities lie in high-value medical and aerospace segments where regulatory complexity protects pricing. Firms demonstrating validated clean-room protocols, traceability, and tight-tolerance precious-metal plating secure multi-year contracts. Digital twins and predictive maintenance in plating cells enhance uptime, enabling vendors to ensure delivery schedules in just-in-time automotive programs.
Metal Finishing Industry Leaders
MKS | Atotech
Quaker Chemical Corporation d/b/a Quaker Houghton
Henkel AG & Co. KGaA
OC Oerlikon Management AG
Honeywell International Inc.
- *Disclaimer: Major Players sorted in no particular order
Metal Finishing Market Companies Covered in this Report
- A.E. Aubin Company
- ALMCO
- Auromex Co., Ltd.
- BASF SE
- C. Uyemura Co., Ltd.
- Dupont
- Grind Master
- Guyson Corporation
- Henkel AG & Co. KGaA
- Honeywell International Inc.
- Linde p.l.c.
- MacDermid Alpha Electronics Solutions
- MKS | Atotech
- Nordson Corporation
- OC Oerlikon Management AG
- OTEC Precision Finish Inc.
- Pioneer Metal Finishing
- Plating Equipment Ltd.
- POSCO
- Quaker Chemical Corporation d/b/a Quaker Houghton
- Sequa
- TIB Chemicals AG

Market Opportunities and Future Outlook
Compliance-driven chemistry replacement remains a primary whitespace, particularly around transitioning away from hexavalent chromium and PFAS-linked inputs while maintaining corrosion performance and auditability for automotive, aerospace, and electronics supply chains. A tangible near-term catalyst is the US EPA work to revise the Metal Finishing Effluent Guidelines (40 CFR Part 433) to address PFAS discharges, with a planned NPRM milestone in July 2026, which elevates demand for non-PFAS process aids, alternative mist suppression strategies, and turnkey wastewater solutions (treatment plus monitoring and documentation) that reduce discharge risk in chromium-related operations.
Investment and capacity moves highlight where suppliers are building around these needs and where end markets are pulling. In the US Midwest, Maxterial opened a 14,000-square-foot production and applications facility in Brown City, Michigan (April 2026) focused on alternatives to hazardous chrome coatings, indicating a commercialization pathway for substitute technologies that can be specified into industrial programs. In Asia, Nouryon expanded Levasil colloidal silica capacity at its Guangzhou, China, site (April 2026), supporting coatings and advanced surface-treatment formulations used to improve wear resistance and process robustness. These actions, paired with demand in high-throughput PCB and electronics manufacturing and qualification-heavy medical device finishing, reinforce opportunities for suppliers that bundle eco-chemistries with automation, traceability, and local technical service to shorten customer approval cycles.
Recent Industry Developments in Metal Finishing Market
- June 2026: MKS Inc. announced a USD 25 million investment to expand its Atotech equipment manufacturing site in Guangzhou, China, adding 323,000 square feet of space and targeting a doubling of production capacity by Q4 2027. The added equipment capacity supports higher-throughput electronics and PCB surface finishing lines and helps shorten lead times for customers scaling advanced manufacturing.
- December 2025: Henkel AG & Co. KGaA introduced a new color variant of its thin organic coating (TOC) technology for coil metal surfaces. The update adds aesthetic and anti-counterfeiting functionality while keeping a thin-film approach that can reduce downstream processing steps compared with thicker coating builds.
- July 2024: Henkel AG & Co. KGaA combined metal passivation and pretreatment into a single-step process offering aimed at improving resource efficiency in surface preparation. Integrating steps can reduce water and energy use on finishing lines and supports OEM programs that prioritize lower-emission, higher-throughput pretreatment workflows.


Metal Finishing Market Report Scope and Research Methodology
Market Definition and Coverage
For this methodology, the metal finishing market covers revenue earned from processes that change a metal part surface so it performs or looks better, for example better corrosion resistance, wear resistance, conductivity, or appearance, across industrial and consumer end uses.
Scope exclusions: We exclude in-house captive finishing that is not billed externally, and we do not count upstream raw metal production or downstream final product assembly as metal finishing revenue.
Segments Covered in This Report
- By Type
- Inorganic Metal Finishing
- Cladding
- Pretreatment/Surface Preparation
- Consumables and Spares
- Electroplating
- Galvanization
- Electroless Plating
- Conversion Coatings
- Thermal Spray and Powder Coating
- Anodizing
- Electropolishing
- Organic Metal Finishing
- Hybrid Metal Finishing
- Inorganic Metal Finishing
- By Application
- Automotive
- Appliances
- Hardware
- Jewelry
- Aerospace
- Heavy Equipment
- Medical Devices
- Electronics
- Construction
- Other Applications
- By Geography
- Asia-Pacific
- China
- India
- Japan
- South Korea
- ASEAN Countries
- Rest of Asia-Pacific
- North America
- United States
- Canada
- Mexico
- Europe
- Germany
- United Kingdom
- France
- Italy
- Spain
- NORDIC Countries
- Rest of Europe
- South America
- Brazil
- Argentina
- Rest of South America
- Middle-East and Africa
- Saudi Arabia
- South Africa
- Rest of Middle-East and Africa
- Asia-Pacific
Data Sources, Market Sizing, and Validation
Desk Research
Desk research starts with finding reliable anchors for demand drivers and activity levels that commonly lead to finishing spend. We reviewed public sources such as the US Census Bureau and Bureau of Labor Statistics, UN Comtrade trade data, OECD industrial production indicators, and environmental agency publications such as US EPA and ECHA pages that summarize surface treatment and emissions rules.
To translate those anchors into market inputs, we also used company annual reports, investor presentations, association websites for surface finishing and corrosion, and trusted technical literature such as peer-reviewed journals on coatings and electrochemistry. Where needed, we used paid subscriptions for company financials and news coverage, plus patent databases to track process and chemistry intensity changes over time. These are illustrative examples, and we also referenced other public sources for data collection, cross-checking, and clarification.
Primary Interviews and Surveys
Primary work focused on validating what share of finishing demand is tied to each major end-use, and how pricing typically moves with chemistry, energy, and compliance costs. We spoke with a mix of job shops, integrated manufacturers, chemical and equipment ecosystem participants, and procurement and quality teams across APAC, EMEA, and the Americas, so the initial end-use shares and pricing pass-through assumptions could be challenged and adjusted before finalizing totals.
Distribution of primary research fieldwork respondents
| Company type | Respondent position | Region |
|---|---|---|
| Top tier: 33% | CXOs: 14% | APAC: 44% |
| Mid tier: 49% | Functional/Unit leaders: 34% | EMEA: 37% |
| Smaller Players: 18% | Managers: 52% | Americas: 19% |
Market-Sizing & Forecasting
Sizing is built using both top-down and bottom-up logic, where industrial output and end-use manufacturing activity are first reconstructed into an addressable finishing demand pool, and then corroborated with selective supplier and channel checks. Our top-down path links indicators like automotive and aerospace production trends, electronics output, construction equipment cycles, and metal component export flows to finishing intensity assumptions, which are then translated into spend.
To keep the model realistic, a few practical variables were used as repeatable inputs, such as the share of parts that require corrosion protection, typical rework and rejection rates tied to surface quality, chemistry and consumables cost movement, energy and wastewater treatment cost pressure, and the mix shift between inorganic, organic, and hybrid finishing approaches. Bottom-up approximations were then used to sanity check totals by sampling average price per treated surface area or per part and pairing it with plausible throughput ranges, with gaps handled through conservative ranges and follow-up calls when the spread stayed wide.
For forecasting, scenario analysis is used so the outlook reflects different paths for manufacturing growth, compliance-driven process changes, and input-cost pass-through. Assumptions are aligned to what primary respondents expect for capacity utilization, pricing behavior, and substitution between finishing routes over the forecast window.
Data Validation & Update Cycle
Validation is done through triangulation across independent signals, followed by variance checks that look for mismatches across regions, end uses, and known production cycles. When an output looks off, the underlying driver is reviewed, assumptions are reworked, and experts are re-contacted if the change is material.
Before sign-off, the model and narrative go through multi-step analyst review so units, currency conversions, and year mappings stay consistent. Reports are refreshed annually, and interim updates are made when major events affect demand or pricing, after which a final pre-delivery pass is completed so clients receive the most current view.
Mordor Intelligence's Metal Finishing Market Size Measured Against Other Published Estimates
Published market sizes for metal finishing can look far apart because each publisher picks a different scope line, base year, and pricing logic, and then updates assumptions on a different schedule. Differences also show up when one study tracks finishing as a service revenue pool while another mixes it with broader treatment operations or adjacent coating categories.
The main gap comes from whether "treatment operations" like pickling and passivation and other non-coating service work are added into the spend total, and Mordor Intelligence keeps the count focused on metal finishing activity tied to applied coatings and surface improvement revenue that is repeatable across end-use industries, which pushes results away from estimates that use wider operations definitions or narrower job-shop only views.
Benchmark comparison
| Source | Market Size | Gaps in Research Methodology |
|---|---|---|
| Mordor Intelligence | USD 117.5 B (2026) | |
| Industry Publisher A | USD 110.42 B (2025) | Uses a different base year and a process list that can weight plating-heavy categories more, and it may apply a steadier price curve that smooths material and compliance cost pass-through. |
| Industry Publisher B | USD 14.1 B (2025) | Represents a narrower universe focused on finishing and treatment operations as a service segment, which can exclude captive finishing and broader coating revenue, thereby producing a much smaller total. |
The table shows that year choice and what is counted as finishing work are the two biggest drivers behind the spread. By tying the size to visible manufacturing activity, clear finishing intensity assumptions, and repeated interview checks on pricing and process mix, we keep the estimate traceable and easier to recreate when conditions change.


Key Questions Answered in the Report
What is the current value of the metal finishing market worldwide?
The metal finishing market size reached USD 117.5 billion in 2026 and is projected to climb to USD 146.08 billion by 2031.
Which region contributes the largest demand for metal finishing services?
Asia Pacific led with 41.05% of global demand in 2025, driven by robust automotive and electronics manufacturing.
Which application area is expanding fastest in metal finishing?
Medical devices post the highest CAGR at 5.22% thanks to stringent biocompatibility requirements for implants and surgical tools.
How are environmental regulations influencing surface-treatment chemistries?
EPA and EU restrictions on PFAS and hexavalent chromium accelerate the adoption of trivalent, fluorine-free, and bio-based alternatives.
What role does artificial intelligence play in modern plating lines?
AI-enabled process control enhances thickness uniformity, reduces metal consumption, and shortens payback periods to under two years.
Page last updated on:





