Market Overview
| Study Period | 2021 - 2031 |
|---|---|
| Forecast Data Period | 2026 - 2031 |
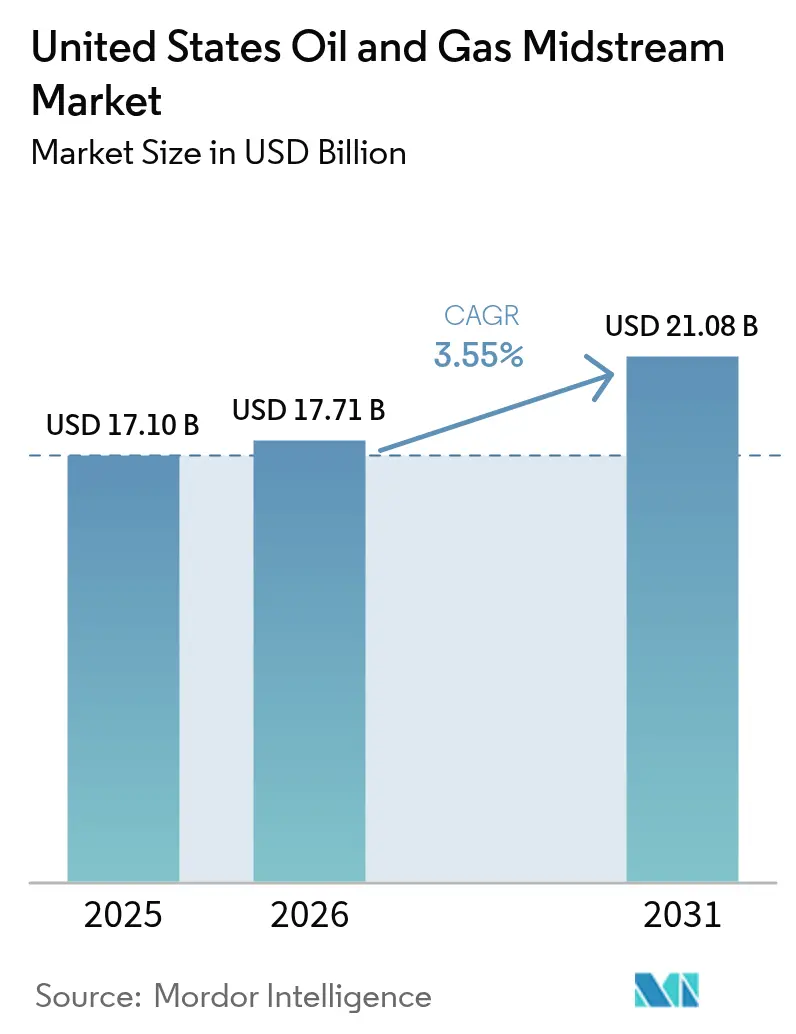
| Base Year Market Size (2025) | USD 17.10 Billion |
| Market Size (2026) | USD 17.71 Billion |
| Market Size (2031) | USD 21.08 Billion |
| Growth Rate (2026 - 2031) | 3.55% CAGR |
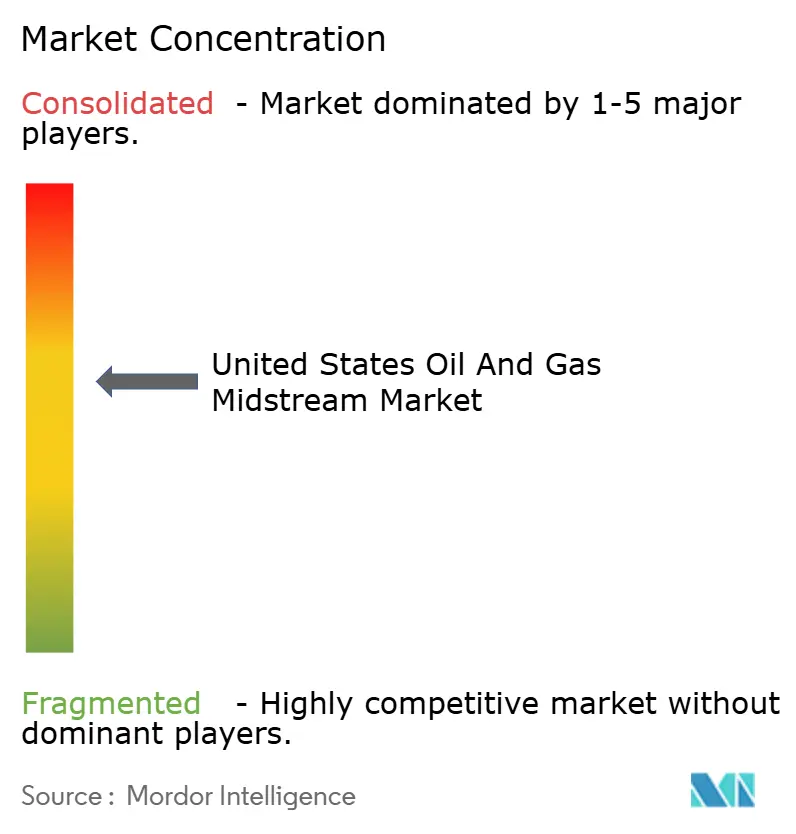
| Market Concentration | Medium |
Major Players *Disclaimer: Major Players sorted in no particular order Image © Mordor Intelligence. Reuse requires attribution under CC BY 4.0. | |
United States Oil And Gas Midstream Market Analysis by Mordor Intelligence
The United States Oil And Gas Midstream Market size was valued at USD 17.10 billion in 2025 and estimated to grow from USD 17.71 billion in 2026 to reach USD 21.08 billion by 2031, at a CAGR of 3.55% during the forecast period (2026-2031).
Growth is anchored in export-oriented infrastructure that links shale basins with Gulf Coast LNG terminals, in data center power demand that boosts natural-gas throughput, and in regulatory reforms that shorten federal reviews, yet still face courtroom tests. Consolidation among incumbents, such as ONEOK’s USD 4.3 billion EnLink purchase, creates platforms large enough to finance multi-commodity corridors in a capital-constrained environment. Digital monitoring increases the utilization of existing lines, deferring the need for new steel until demand is secured.[1]Federal Register Editors, “Pipeline Safety: Mandatory Regulatory Reviews,” federalregister.gov Export LNG capacity, slated to reach 21.2 Bcf/d by 2028, and AI-centric data center clusters together underpin the next expansion cycle for the US oil and gas midstream market.
Key Report Takeaways
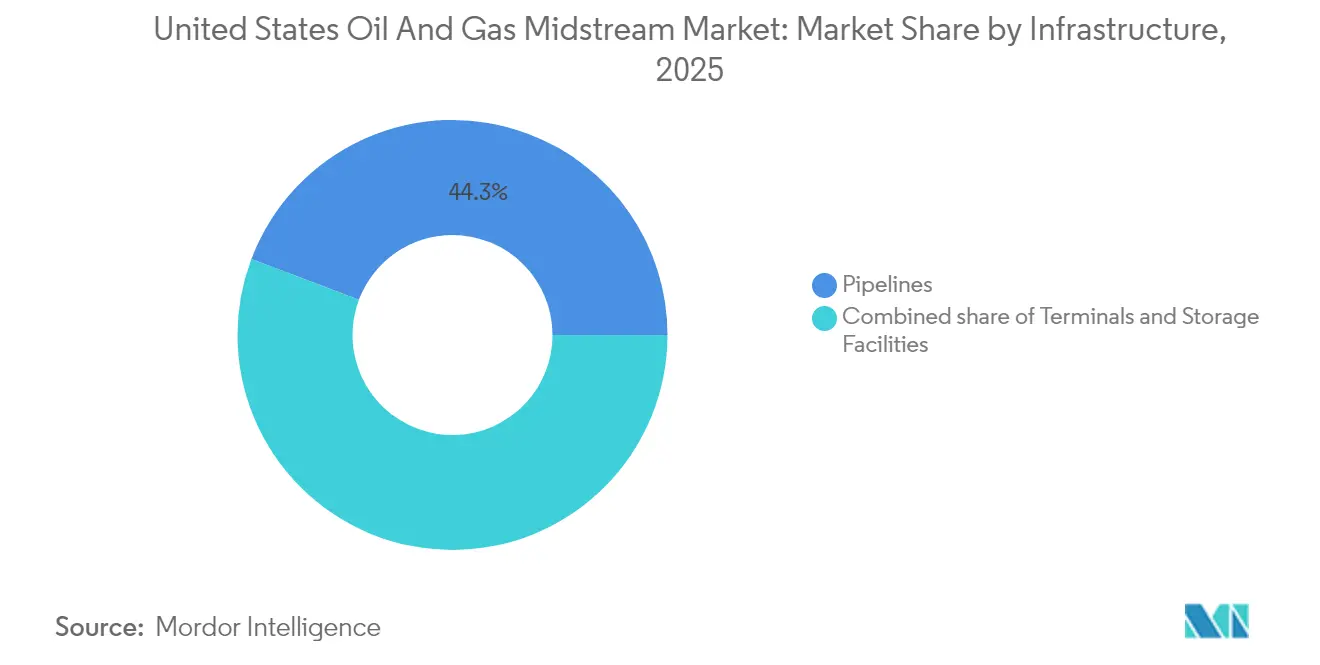
- By infrastructure type, pipelines accounted for 44.25% of the US oil and gas midstream market share in 2025. Meanwhile, terminals are projected to post the fastest growth rate of 4.95% through 2031, as LNG export docks multiply.
- By product type, crude oil transport held a 37.35% share of the US oil and gas midstream market size in 2025, whereas LNG services are forecast to grow at a 6.28% CAGR to 2031.
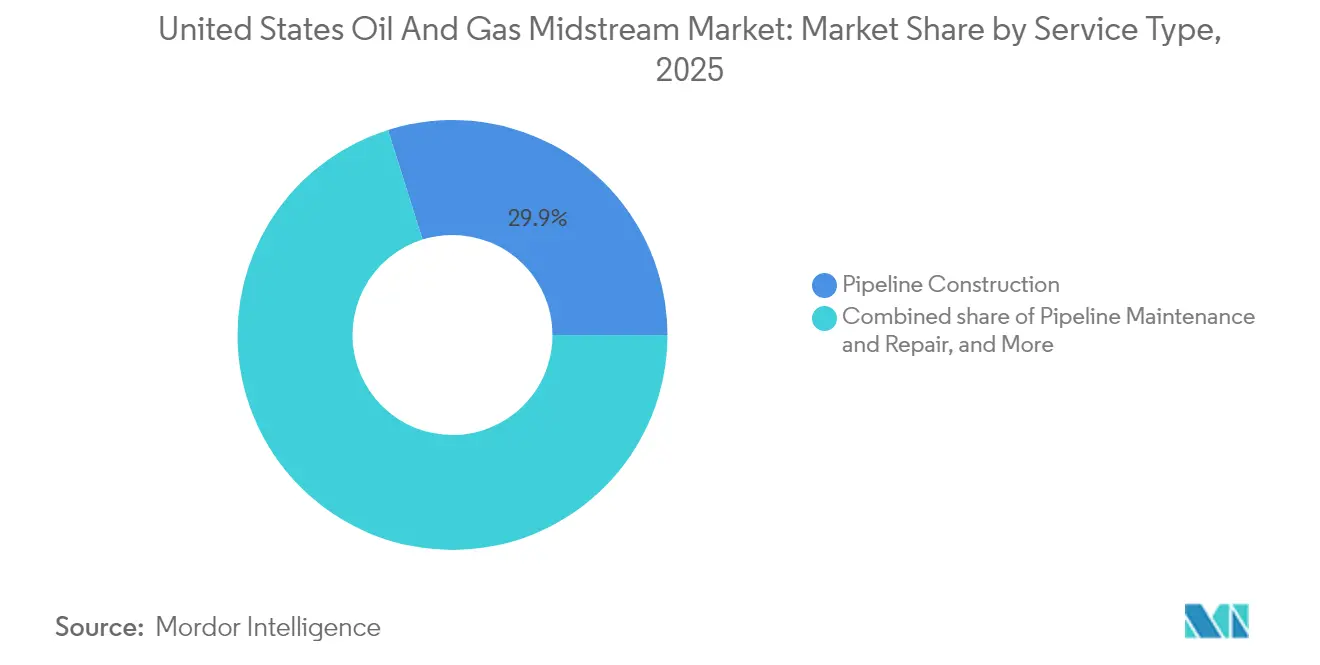
- By service type, pipeline construction captured a 29.85% revenue share in 2025 and is advancing at a 4.12% CAGR, driven by a robust greenfield build-out pipeline.
Note: Market size and forecast figures in this report are generated using Mordor Intelligence’s proprietary estimation framework, updated with the latest available data and insights as of 2026.
United States Oil And Gas Midstream Market Trends and Insights
Drivers Impact Analysis*
| Driver | (~) % Impact on CAGR Forecast | Geographic Relevance | Impact Timeline |
|---|---|---|---|
| LNG-led surge in Gulf Coast export capacity | +1.1% | Gulf Coast; spillover to Permian & Appalachian | Medium term (2-4 years) |
| Permian crude & associated-gas growth | +0.7% | Permian Basin | Short term (≤ 2 years) |
| AI-driven data-center gas demand | +0.6% | Virginia, Texas, California clusters | Long term (≥ 4 years) |
| Rising ethane recovery for petrochem feedstock | +0.4% | Gulf Coast; Marcellus | Medium term (2-4 years) |
| Digitization & predictive maintenance | +0.3% | Nationwide | Long term (≥ 4 years) |
| CCUS pipeline build-out incentives (IRA 45Q) | +0.2% | Industrial corridors; Gulf Coast CO₂ hubs | Long term (≥ 4 years) |
| Source: Mordor Intelligence | |||
LNG-led Surge in Gulf Coast Export Capacity
Operational LNG capability is expected to increase to 21.2 Bcf/d by 2028, creating the single largest draw on pipeline throughput in the US oil and gas midstream market.[2]U.S. Energy Information Administration, “The eighth U.S. liquefied natural gas export terminal, Plaquemines LNG, ships first cargo,” eia.gov Venture Global’s USD 28 billion Calcasieu Pass 2, featuring a 91-mile feeder line, demonstrates how each terminal triggers interstate pipeline builds and compression upgrades. Cheniere’s Corpus Christi Trains 8 & 9 add more than 3 Mtpa and require USD 50-100 million per interconnection for high-pressure tie-ins. Bidirectional design becomes standard, allowing lines to reverse during maintenance or hurricane disruptions, which adds cost but boosts resiliency. Concentrated Gulf activity tightens labor and specialty steel supply, elevating capital expenditures for smaller entrants.
Permian Crude & Associated-gas Production Growth
Permian output continues to outstrip takeaway, driving the need for new gathering, processing, and long-haul capacity across crude, gas, and NGL streams.[3]Oil & Gas Journal Staff, “ONEOK, MPLX form JV for LPG export terminal,” ogj.com Phillips 66’s USD 300 million Iron Mesa plant, starting in 2027, captures gas once flared, while Tallgrass’s 2.4 Bcf/d connector to Rockies Express unlocks western markets. Integrated operators switch volumes among crude, gas, and NGL pipelines based on hub spreads, maximizing system cash flow in the US oil and gas midstream market. Flow-optimization software defers the installation of new trunklines until volumes prove to be durable. Producers favor shippers that can offer multi-commodity take-or-pay contracts, tilting negotiation leverage toward large incumbents.
AI-Driven Data-Center Power Demand Boosting Gas Throughput
High-density computing clusters are expected to reduce US gas consumption by 3.3 Bcf/d by 2030, with approximately 60% of the load relying on gas-fired generation.[4]Natural Gas Intelligence Staff, “US Data Center Power Demand Could Drive Natural Gas Consumption Up 3.3 Bcf/d by 2030,” naturalgasintel.com Demand is steady year-round, encouraging firm transport contracts that raise base-load utilization. Kinder Morgan already ships 40% of the US's LNG feed gas, positioning its network to serve export plants and in-state data centers simultaneously. Redundant loops and fiber-optic monitoring become prerequisites as hyperscale clients demand “five-nines” reliability. A faster grid-decarbonization path could erode this gas demand, creating future-proofing challenges for the US oil and gas midstream market.
Rising Ethane Recovery for Petrochemical Feedstock
Ethane extraction margins outrun dry-gas transport tariffs, prompting midstream firms to expand deep-cut plants and fractionators. ONEOK and MPLX’s USD 1.4 billion LPG terminal provides flexibility to route barrels globally amid China tariff swings. Storage caverns and cooling chains add complexity but triple per-unit earnings versus basic transport. License volatility with China forces cargo redirection to Europe or India, increasing demurrage risk for terminal operators. Integrated processing-to-dock platforms hedge against single-market dependency inside the US oil and gas midstream market.
Restraints Impact Analysis*
| Restraint | (~) % Impact on CAGR Forecast | Geographic Relevance | Impact Timeline |
|---|---|---|---|
| Federal permitting bottlenecks (NEPA, Sec 401) | –0.6% | Nationwide cross-state projects | Short term (≤ 2 years) |
| Activist opposition / ESG capital limits | –0.4% | Environmentally sensitive zones | Medium term (2-4 years) |
| Long-haul oil pipeline over-capacity | –0.3% | Cushing–Houston; Bakken–Midwest | Long term (≥ 4 years) |
| China-centric ethane license uncertainty | –0.2% | Gulf Coast export docks; Marcellus | Medium term (2-4 years) |
| Source: Mordor Intelligence | |||
Federal Permitting Bottlenecks (NEPA, Sec 401)
One-year EIS targets set by Interior reduce paperwork, but lawsuits still stall rights-of-way, resulting in delay costs of up to USD 2 million per mile. Section 401 water reviews allow states to halt projects even when federal agencies approve, thereby prolonging the queue. Energy Transfer’s Lake Charles LNG extension shows how serial FERC filings become routine in the US oil and gas midstream market. Developers front-load baseline studies and community outreach, inflating pre-FID spend but safeguarding schedules. Only the largest balance sheets can absorb multi-year delays without jeopardizing credit metrics.
Activist Opposition / ESG Capital Constraints
Global banks have tightened their fossil-fuel lending under shareholder pressure; Barclays, for instance, cut its midstream exposure following protests. Higher funding costs raise hurdle returns by 150–200 basis points, pushing smaller players to private credit. Equity investors now demand payout ratios above 50%, limiting retained cash for growth in the US oil and gas midstream market. Some firms issue sustainability-linked bonds tied to methane reduction targets to tap into ESG pools. Yet capital scarcity slows build-outs and may cede market share to cash-rich majors.
*Our forecasts treat driver/restraint impacts as directional, not additive. The impact forecasts reflect baseline growth, mix effects, and variable interactions.
Segment Analysis
By Infrastructure: Pipeline Networks Anchor Market Foundation
Pipelines supplied 44.25% of 2025 revenue for the US oil and gas midstream market and form the connective backbone among basins, processors, and docks. Capital cost averages USD 4 million per mile onshore, making trunkline investments sizable yet defensible when underpinned by 20-year take-or-pay contracts. Kinder Morgan’s USD 9.3 billion backlog, two-thirds of which is dedicated to gas transmission, signals continued faith in continental grid expansion.
New builds emphasize bidirectional flow, sectionalized valves, and high-horsepower compression to swing gas between export and power-market pulls, features that older pipe lacks. Terminal infrastructure, although accounting for only 17.85% of 2025 revenue, is expected to advance at a 4.95% CAGR through 2031 as LNG and LPG docks proliferate. Calcasieu Pass 2 alone drives nearly 100 miles of new lateral pipe and twin loading berths, underscoring how each dock multiplies system spend. Storage caverns and tanks, often overlooked, yield optionality to capture shoulder-season arbitrage and to buffer ethane exports during license upheavals.


By Product Type: Crude Oil Dominance Faces LNG Growth Challenge
Crude oil transport represented 37.35% of the US oil and gas midstream market share in 2025, supplying refineries and export docks primarily along the Gulf Coast. Rates remain resilient despite high base volumes, yet face overcapacity in some corridors. LNG services, although smaller, post a 6.28% CAGR, reflecting vessel loading, boil-off management, and sub-zero pipeline specifications that command premium tolls.
Natural-gas pipeline revenue falls between oil and LNG, benefiting from the power sector's pull and feed-gas delivery. Phillips 66's Iron Mesa project demonstrates how operators can add midstream-grade gas processing to monetize NGLs before residue enters the pipeline, thereby blending income streams. Refined-product lines offer steady tariffs but limited growth opportunities. Operators hedge portfolio risk by owning assets across all four product lanes, smoothing cash flow through cycles.
By Service Type: Construction Activity Drives Market Expansion
Pipeline construction captured 29.85% of 2025 revenue and grew at a 4.12% CAGR as developers race to secure corridors ahead of tightening capital markets. Tallgrass’s Permian-to-REX project demonstrates the trend: 2.4 Bcf/d of capacity, USD 3 billion budget, late-2028 start. Engineering, environmental, and right-of-way services add layers of spend beyond steel.
Maintenance and repair generate reliable but slower growth, essential for 300,000 miles of active pipe. Storage and handling services gain importance as LNG and LPG exports need buffer capacity to manage vessel queues. Transportation logistics, including scheduling, nomination, and imbalance trading, become digital platform plays, offering fee potential without capital expenditure. Operators able to bundle construction, O&M, and logistics retain customers and defend share within the US oil and gas midstream market.
Geography Analysis
The Gulf Coast remains the gravitational center of the US oil and gas midstream market. Cheniere’s expansion to more than 60 Mtpa of liquefaction by 2028 concentrates feed-gas pulls in Texas and Louisiana. Refineries processing half of US crude depend on dense pipe grids for crude intake and product dispatch, reinforcing terminal proximity advantages. ONEOK–MPLX’s LPG venture in Texas highlights cascading investment in docks, tanks, and lateral lines.
The Permian Basin is the fastest-growing geography. Elevated associated-gas output feeds new processing trains and long-haul pipes linking to Gulf docks and western markets. Phillips 66’s Iron Mesa and Tallgrass’s connector showcase integrated build-outs that capture margin across the chain. Regulatory ease in Texas accelerates timelines compared with the Northeast, benefitting Permian projects in the US oil and gas midstream market.
Appalachia supplies rising volumes of dry gas to LNG terminals and Southeast utilities. Williams lifted contracted capacity 3.4% in 2024 by completing Regional Energy Access. Multi-state permitting hurdles necessitate persistent community engagement and route realignments, which lengthen lead times but offer resilient cash flow once in service. Continued LNG growth ensures Appalachian molecules remain essential despite complex approval pathways.
Regulatory Landscape
US midstream regulation remains split across rate oversight, safety rules, and environmental compliance. In 2026, the Federal Energy Regulatory Commission (FERC) finalized the oil pipeline index for the next five-year period, setting the ceiling index at PPI-FG minus 0.55% for July 1, 2026 through June 30, 2031, which anchors tariff escalation mechanics for indexed oil pipeline rates. At the same time, FERC finalized updates to 18 CFR 284.12 to incorporate mandatory NAESB WGQ Version 4.0 business practice standards for interstate natural gas pipelines, effective July 27, 2026, tightening communications and coordination around scheduling and nominations.
Competitive Landscape
Consolidation has lifted the combined revenue share of the five largest operators to roughly 62%, signaling moderate concentration in the US oil and gas midstream market. ONEOK’s EnLink takeover, Energy Transfer’s WTG buy, and Brookfield’s Colonial stake add scale that spreads general and administrative (G&A) costs across thousands of miles of pipe. Larger balance sheets facilitate the funding of multi-billion-dollar corridors and absorb ESG-linked financing premiums that would otherwise strain smaller firms.
Technology adoption separates leaders from laggards. Energy Transfer’s digitization project integrates metering, scheduling, and maintenance, reducing downtime by double digits and trimming headcount. Kinder Morgan deploys fiber-optic sensing on critical segments to flag leaks within minutes, satisfying PHMSA’s evolving integrity rules. Early movers in CO₂ networks, including EnLink and Navigator, aim to leverage rights-of-way and compressor shops for low-carbon molecules.
Emerging disruptors include renewable-gas aggregators and hydrogen developers who are embedding pipeline assets into green-energy value chains. Financial sponsors experiment with infrastructure-as-a-service models, charging capacity fees similar to those of cloud providers. Operators counter by offering bundled services—such as storage, fractionation, and loading—to lock in shippers for decades, thereby reinforcing entry barriers across the US oil and gas midstream market.
United States Oil And Gas Midstream Industry Leaders
Kinder Morgan Inc.
Energy Transfer LP
Enterprise Products Partners LP
Enbridge Inc. (U.S.)
Williams Companies Inc.
- *Disclaimer: Major Players sorted in no particular order

Market Opportunities and Future Outlook
Incremental capacity additions and debottlenecking across key corridors create whitespace for midstream investment tied to LNG feed gas, NGL exports, and reliability-driven gas demand. A near-term example is Sempra Infrastructure, which placed the 72-mile Port Arthur Pipeline Louisiana Connector into service in June 2026, adding 2 Bcf/d of capacity and supporting the commercial pull for Gulf Coast pipe-to-dock connectivity. In the Northeast, Williams breaking ground on the Northeast Supply Enhancement (NESE) project in April 2026, designed to add 400,000 dekatherms/day, highlights how targeted expansions can improve deliverability into constrained demand centers where firm service carries higher value than commodity-exposed volumes.
The opportunity set also depends on permitting pathways and project execution models. FERCs May 2026 NOPR on raising blanket certificate cost thresholds signals an effort to move more compression, looping, and ancillary facilities through faster authorization channels, supporting a shift toward modular expansions over high-profile greenfield routes. On the supply side, operators are pursuing basin egress and export-oriented integration, with mid-2026 build activity and expansion programs across the Permian and Gulf Coast (including projects associated with Kinder Morgan, WhiteWater, and Energy Transfer) that prioritize tie-ins, compression, and terminal-linked capacity rather than standalone long-haul steel.
Recent Industry Developments
- July 2026: Williams announced an agreement with Blackstone, alongside Apollo and KKR, for a USD 5.34 billion investment in five Power Innovation projects. The capital supports infrastructure that links gas supply and midstream deliverability to power generation needs, reinforcing the markets shift toward reliability and large-load demand centers.
- June 2026: Energy Transfer announced a fully subscribed export expansion at its Nederland NGL Export Terminal, adding 240,000 bpd of ethane export capacity and 55,000 bpd of LPG capacity. The announcement highlights how contracted export capacity is driving terminal expansions and upstream connectivity requirements for NGL gathering, fractionation, and dock logistics.
- May 2024: Williams completed its Regional Energy Access expansion, lifting contracted capacity by 3.4% and improving deliverability in Appalachia-linked corridors. The project shows how incremental expansions on existing footprints can add firm capacity in permitting-sensitive regions while strengthening long-term shipper commitments.


Research Methodology Framework and Report Scope
Market Definition and Coverage
This market covers the United States midstream value chain for oil and gas, measured as revenues earned from transporting, storing, and terminaling hydrocarbons between production areas and downstream demand centers.
Scope exclusions: Upstream production and downstream refining and retail fuel distribution are not counted in this market.
Segmentation Overview
- By Infrastructure
- Pipelines
- Terminals
- Storage Facilities (Underground and Above-ground)
- By Product Type
- Crude Oil
- Natural Gas
- Refined Products
- LNG
- By Service Type
- Pipeline Construction
- Pipeline Maintenance and Repair
- Storage and Handling Services
- Transportation and Logistics
Data Sources, Market Sizing, and Validation
Desk Research
Desk research started by mapping what midstream activities generate measurable revenue in the United States, and then tying those activities back to observable flow and capacity signals. We first used public datasets to understand where volumes are moving, where storage is building, and which infrastructure additions are actually entering service.
Core public sources used include, for example, the U.S. Energy Information Administration for crude, natural gas, storage, and trade indicators, and the Federal Energy Regulatory Commission for pipeline tariff context and regulatory filings. We also referred to the Pipeline and Hazardous Materials Safety Administration for pipeline mileage and integrity related datapoints, the Bureau of Labor Statistics for cost inflation proxies, and state level energy or oil and gas commission publications where they help explain basin driven constraints. Company 10-K filings, earnings materials, and reputable trade press were used to interpret utilization commentary and project timing. A paid subscription covering company financials and news intelligence was used to speed up cross checks on service exposure and recent asset changes. These desk sources are not exhaustive, and many other public documents were referred to for data collection, validation, and research clarification.
Primary Interviews and Surveys
Primary interviews and short surveys were used to pressure test the desk assumptions that are hardest to infer from public releases, especially utilization, tariff resets, contract mix, and service revenue recognition for terminals and storage. We spoke with a mix of operators, contractors, shippers, and industry advisers across major producing and consuming corridors in the United States so model inputs could be corrected where desk signals were lagging or too generalized.
Distribution of primary research fieldwork respondents
| Company type | Respondent position | Region |
|---|---|---|
| Top tier: 29% | CXOs: 14% | |
| Mid tier: 50% | Functional/Unit leaders: 29% | |
| Smaller Players: 21% | Managers: 57% |
Market-Sizing & Forecasting
Sizing is built mainly through a top-down reconstruction, where U.S. midstream demand pools are formed from hydrocarbons moved and stored, and then monetized using fee and tariff style revenue factors. To keep totals realistic, the outputs are corroborated with selective bottom-up approximations, such as sampled operator revenue roll ups by service exposure and channel checks on implied revenue per barrel or per Mcf.
Inputs that shaped the model include, for example, crude and natural gas throughput trends, pipeline and storage capacity additions and utilization, regional basis differentials that influence routing, export activity (including LNG related volumes), and construction and maintenance cost inflation. For the forecast, we used scenario analysis tied to expected throughput growth, project start-ups, and fee escalation patterns, and then scenario weights were tuned using expert feedback on permitting risk, producer activity, and contract renewals. Where a bottom-up check could not fully cover a smaller service pocket, a conservative revenue intensity assumption was applied using comparable assets, followed by a validation pass with interview guidance.
Data Validation & Update Cycle
Model outputs are validated by triangulating across independent signals, including checking implied revenues per unit moved against public tariff ranges and interview guided ranges, and then testing whether growth matches what capacity and volume trends can support. Large variances are flagged, reviewed, and corrected through multiple analyst reviews, and a re-contact is triggered when a key assumption shifts the total materially or conflicts with a reliable public indicator.
Reports are refreshed annually, with interim updates when material events occur such as major asset transactions, regulatory changes, or sharp shifts in U.S. production and export flows. Before delivery, a final update pass is completed so clients receive a current view that still traces back to clear variables and repeatable steps.
Mordor Intelligence's United States Oil and Gas Midstream Market Size Compared Against Other Published Estimates
Published market values for U.S. oil and gas midstream often diverge because the scope boundary and revenue counting rules differ, and those differences are not always visible from a headline number alone. The spread usually comes from what services are bundled, which year is treated as the current market, and whether fee and tariff progression is linked to real operating signals.
Key gap drivers here include whether wholesale marketing and broader energy logistics are added into the total, how LNG terminals and related services are treated, and whether construction and maintenance revenues are counted as part of the market. Differences also show up when utilization ramps are assumed too quickly, when tariff escalation is applied without linking it to reset cycles, or when inflation timing is handled differently across the same calendar year.
Benchmark comparison
| Source | Market Size | Gaps in Research Methodology |
|---|---|---|
| Mordor Intelligence | USD 17.10 B (2025) | |
| Global Consultancy A | USD 10.00 B (2024) | Uses an earlier base year and a tighter service bundle that commonly emphasizes core transportation and storage, which can exclude terminaling and related service revenues when they are disclosed separately. |
| Industry Publisher B | USD 20.78 B (2025) | Often presented as a broader midstream bundle that can include wholesale marketing and extra logistics or processing related revenues, which lifts the total even if the underlying throughput assumptions are similar. |
Wholesale marketing revenues sit outside Mordor Intelligence's scope, which is the main reason a broader midstream bundle can land above the 2025 value shown in the table. At the lower end, a 2024 base and narrower service coverage compress the number before any growth math is applied. With totals anchored to throughput, capacity use, and fee based revenue logic that can be rechecked, the final value stays practical for planning and comparison.


Key Questions Answered in the Report
What is the current value of the US oil and gas midstream market?
It stands at USD 17.71 billion in 2026 and is projected to reach USD 21.08 billion by 2031.
Which infrastructure segment is growing fastest?
Terminals, mainly LNG and LPG docks, are expanding at a 4.95% CAGR through 2031.
How will data-center expansion influence midstream demand?
AI-driven data centers could add 3.3 Bcf/d of gas load by 2030, boosting firm pipeline contracts.
What is the main regulatory hurdle for new pipelines?
Federal permitting under NEPA and Section 401 water reviews continues to delay cross-state projects.
Which product type shows the highest forecast growth?
LNG services are expected to grow at 6.28% CAGR, reflecting rising export volumes.
How concentrated is competition in the sector?
Recent mergers give the five largest operators about 62% of total revenue, indicating moderate concentration.
Page last updated on:


