United States Invisible Orthodontics Market Size and Share
Market Overview
| Study Period | 2020 - 2031 |
|---|---|
| Forecast Data Period | 2026 - 2031 |
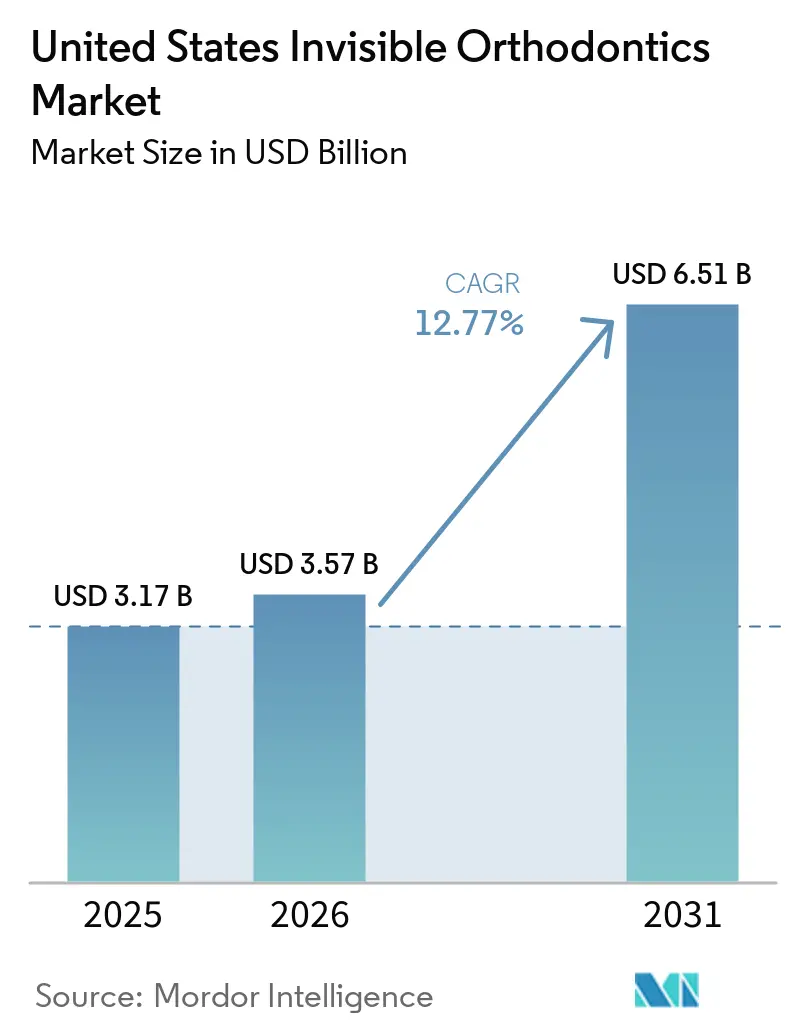
| Base Year Market Size (2025) | USD 3.17 Billion |
| Market Size (2026) | USD 3.57 Billion |
| Market Size (2031) | USD 6.51 Billion |
| Growth Rate (2026 - 2031) | 12.77% CAGR |
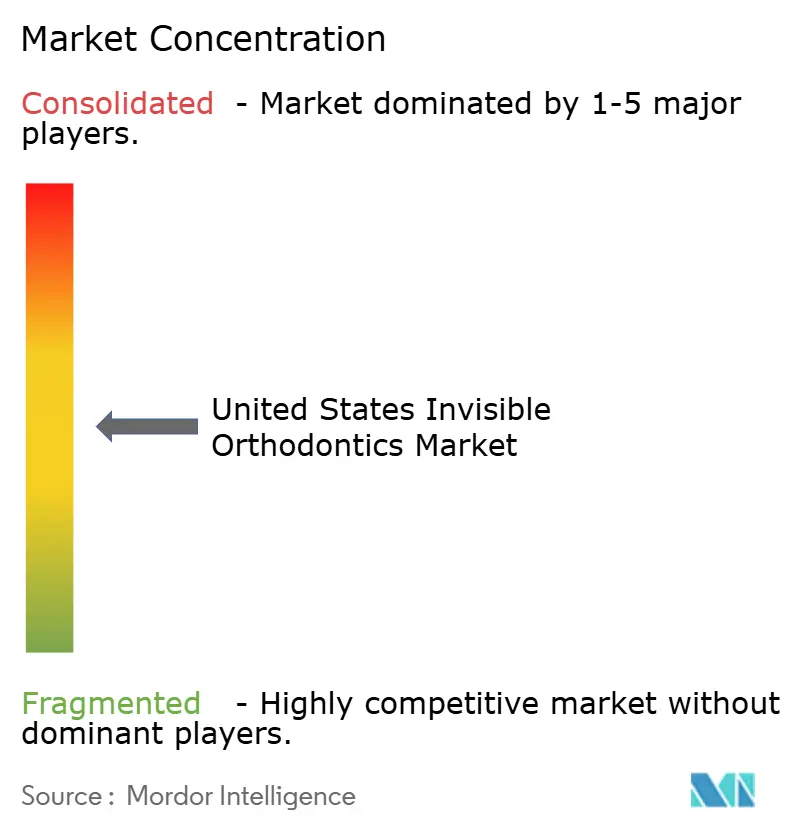
| Market Concentration | Medium |
Major Players *Disclaimer: Major Players sorted in no particular order Image © Mordor Intelligence. Reuse requires attribution under CC BY 4.0. | |
United States Invisible Orthodontics Market Analysis by Mordor Intelligence
The United States Invisible Orthodontics Market size was valued at USD 3.17 billion in 2025 and is estimated to grow from USD 3.57 billion in 2026 to reach USD 6.51 billion by 2031, at a CAGR of 12.77% during the forecast period (2026-2031).
The base of treated patients is already expanding, with the American Association of Orthodontists recording 696 active patients per member in 2024, the highest reading in its survey history, and estimating 1.91 million adults in treatment through AAO members in the United States. Demand is being supported by adults who want discreet correction, patients returning after relapse, and care pathways that fit more easily into work and family routines. Digital planning, intraoral scanning, and hybrid remote monitoring are reducing setup time and unnecessary office visits, which lets practices carry more active cases without matching increases in staff or chair time. The provider channel is also widening, because DSOs and OSOs are scaling quickly and general dentists are taking a larger role in mild-to-moderate cases inside integrated dental groups. Even with strong demand, the United States invisible orthodontics market continues to face a clear affordability limit and tighter oversight of mail-order aligners, which favors established brands that sell through licensed providers and have stronger regulatory infrastructure.
Key Report Takeaways
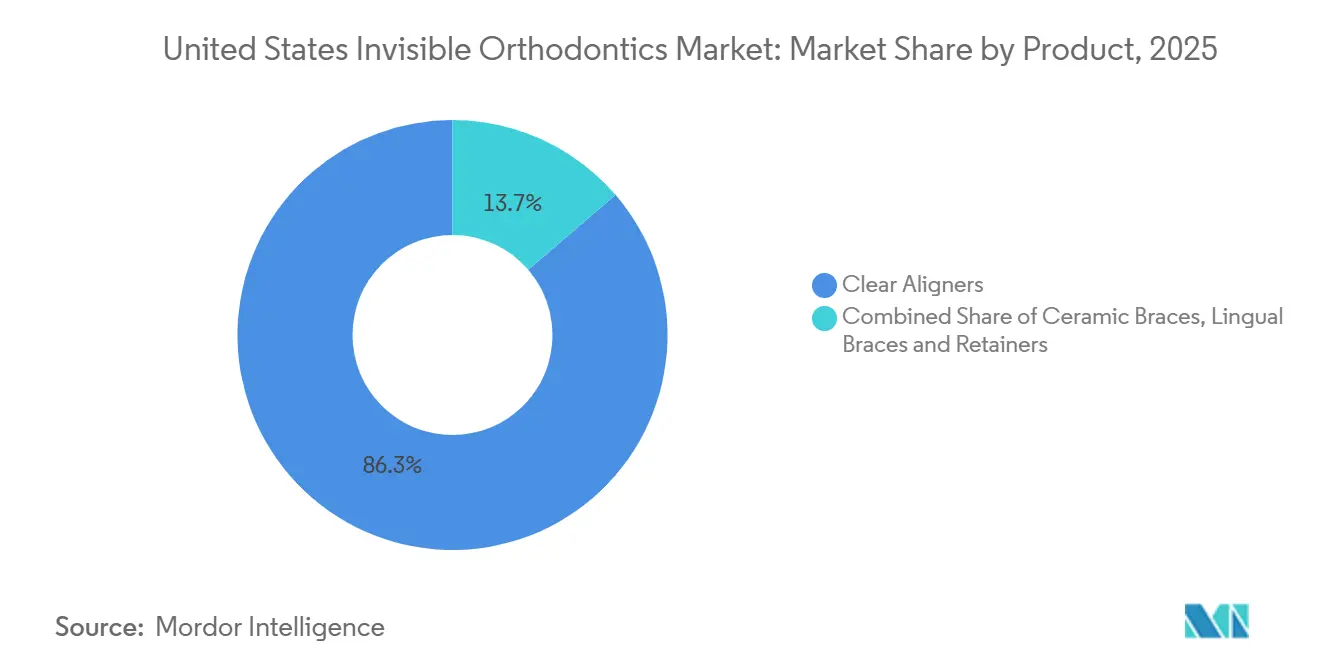
- By product, clear aligners held 86.31% of revenue in 2025, while ceramic braces are projected to expand at a 15.38% CAGR through 2031.
- By age group, adults held 59.52% of revenue in 2025, while teens are projected to advance at a 14.25% CAGR through 2031.
- By material, polyurethane and co-polyester multilayer films accounted for 75.24% of revenue in 2025, while PETG is projected to grow at a 15.52% CAGR through 2031.
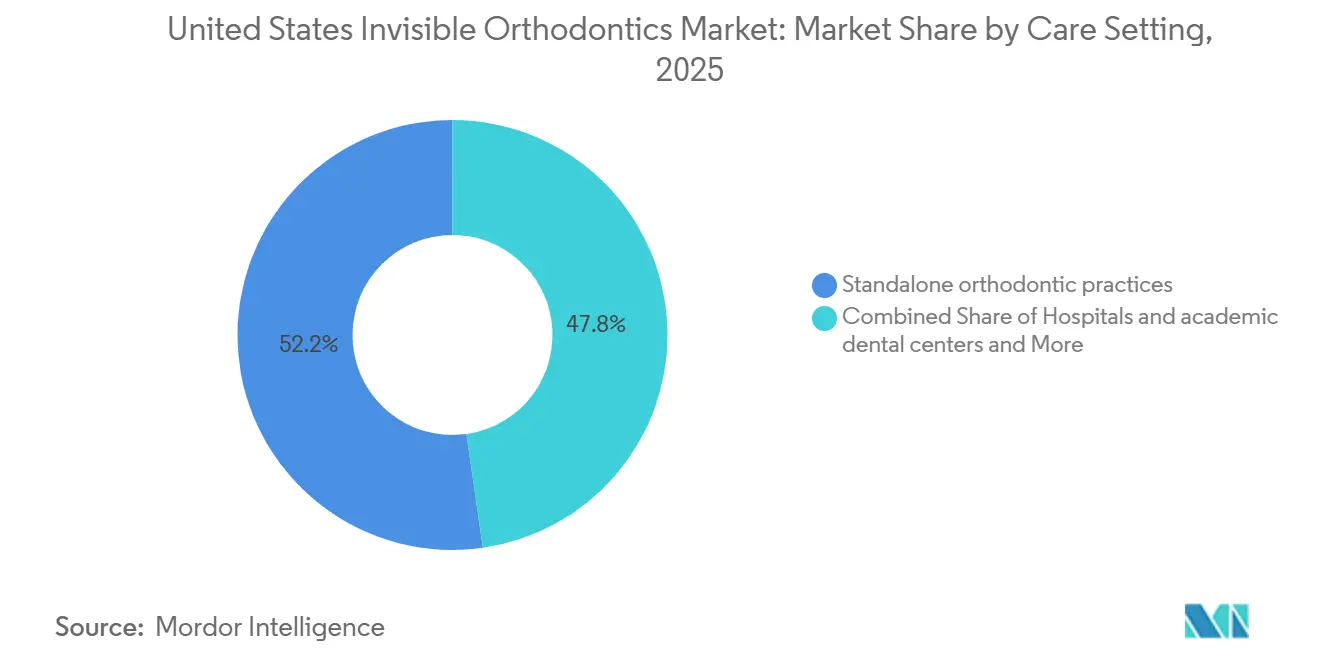
- By care setting, standalone orthodontic practices held 52.24% of revenue in 2025, while group practices, DSOs, and OSOs are projected to grow at a 15.83% CAGR through 2031.
- By provider type, orthodontists held 65.44% of revenue in 2025, while general dentists are projected to grow at a 15.53% CAGR through 2031.
- By sales channel, offline channels held 74.44% of revenue in 2025, while online channels are projected to grow at a 14.53% CAGR through 2031.
Note: Market size and forecast figures in this report are generated using Mordor Intelligence’s proprietary estimation framework, updated with the latest available data and insights as of January 2026.
United States Invisible Orthodontics Market Trends and Insights
Drivers Impact Analysis*
| Driver | (~) % Impact on CAGR Forecast | Geographic Relevance | Impact Timeline |
|---|---|---|---|
| Adult Malocclusion Burden And Aesthetics Led Demand | +3.5% | National, strongest in urban metros including New York, Los Angeles, Chicago, and Miami | Short term (≤ 2 years) |
| AI Planning, Intraoral Scanning, And Digital Workflows | +2.8% | National, with early gains in DSO-dense markets including Texas, Florida, and California | Medium term (2-4 years) |
| Hybrid Remote Monitoring Improves Case Throughput | +1.9% | National, with added benefits for suburban and rural practices | Medium term (2-4 years) |
| Selective Expansion Of Adult Orthodontic Benefits And Financing Access | +1.5% | National, with higher uptake in states adopting 2027 EHB benchmark updates | Long term (≥ 4 years) |
| DSO And Group Practice Scaling Accelerates Aligner Penetration | +2.2% | National, with OSO-dense clusters in Texas, the Southeast, and the Mid-Atlantic | Short term (≤ 2 years) |
| Reduced Wear Time And Pediatric Interceptive Innovations Expand Candidacy | +1.4% | National, strongest in suburban family-practice markets | Medium term (2-4 years) |
| Source: Mordor Intelligence | |||
Adult Malocclusion Burden and Aesthetics-Led Demand
The addressable patient base in the United States invisible orthodontics market is much larger than current treatment volumes. The AAO estimated 1.91 million adults were treated by AAO members in the United States in 2024, which confirms that adult care is already a large and active revenue pool. The AAO’s 2024 Orthodontic Landscape Consumer Study also showed that orthodontists treated 64% of adult orthodontic patients, dentists treated 22%, and mail-order channels treated 14%, which points to continued strength in supervised care[1]American Association of Orthodontists, “Orthodontic Landscape Consumer Study Examines Patient Marketplace,” AAO, aaoinfo.org. Working adults are increasingly choosing less visible treatment, because appearance concerns now sit alongside convenience, schedule flexibility, and willingness to self-finance. A meaningful share of case starts is also coming from relapse patients who stopped retainer wear and later returned to treatment. That recurring pool supports steady case replenishment inside the United States invisible orthodontics market even when first-time patient acquisition becomes harder.
AI Planning, Intraoral Scanning, and Digital Workflows
Artificial intelligence is reducing one of the slowest steps in orthodontic care, which is the time required to build and review case setups. Align Technology stated that ClinCheck Live Plan can generate initial doctor-ready plans in as little as 15 minutes for eligible cases, which shortens the gap between scan capture and clinician review. A randomized controlled trial published in PLOS One in May 2026 found superior PAR score reductions for AI-assisted digital workflows versus conventional fixed appliances in 140 patients with Angle Class I malocclusion. Faster setup reduces the marginal labor required per case, and that matters most for multi-location groups trying to raise utilization without adding equal numbers of technicians and coordinators. Digital workflows also improve consistency across locations, which is valuable for DSOs that want repeatable treatment protocols. In the United States invisible orthodontics market, vendors with stronger software, scanner integration, and quality control are gaining an advantage that extends beyond the appliance itself.
Hybrid Remote Monitoring Improves Case Throughput
Remote monitoring is changing treatment economics because it cuts avoidable appointments and keeps oversight in place. A DentalMonitoring clinical white paper reported 24.5% fewer in-office visits, 80.8% fewer unscheduled emergencies, and 312% more hygiene instructions for remotely monitored patients. A 2025 prospective analysis in the Journal of Pharmacy and Bioallied Sciences also found higher satisfaction and compliance in digitally monitored groups, with shorter overall treatment duration than traditional monitoring. That combination improves capacity because clinicians can manage more active cases without extending clinic hours at the same pace. The operating model remains provider-led, since the software flags issues while licensed orthodontists make the clinical decisions. Ormco reinforced that structure in April 2025 by partnering with DentalMonitoring for newly started Spark clear aligner cases, linking product adoption to a clear productivity benefit in the United States invisible orthodontics market.
DSO and Group-Practice Scaling Accelerates Aligner Penetration
Large practice groups are becoming one of the main distribution engines for the United States invisible orthodontics market. Smile Doctors acquired myOrthos in March 2025 and expanded its affiliated network to more than 550 locations across 36 states, which showed how far provider consolidation has advanced. Scale gives these networks standardized scanning, procurement leverage, centralized training, and shared treatment protocols that smaller practices often cannot match. That makes aligner adoption easier across a broad provider base and gives manufacturers steadier case flow than independent practice demand alone can provide. Group structures also support financing, marketing, and longer operating hours, which matter for adults who want treatment but have limited weekday flexibility. The commercial result is wider penetration, higher provider productivity, and stronger channel control for brands that secure preferred positions inside OSO and DSO systems.
Restraints Impact Analysis*
| Restraint | (~) % Impact on CAGR Forecast | Geographic Relevance | Impact Timeline |
|---|---|---|---|
| High Out Of Pocket Cost And Adult Coverage Gaps | -1.8% | National, with greater severity in low-income and uninsured populations | Short term (≤ 2 years) |
| Tighter Scrutiny Of Mail Order Aligners And In Person Exam Requirements | -0.9% | National, particularly affecting DTC-heavy Sunbelt and suburban markets | Short term (≤ 2 years) |
| Challenger Brand Churn Undermines Trust And Channel Stability | -0.7% | National, concentrated in online and direct-to-consumer segments | Medium term (2-4 years) |
| Staffing And Training Bottlenecks In In House Digital Production | -0.6% | National, most acute in non-metro areas with limited dental workforce depth | Medium term (2-4 years) |
| Source: Mordor Intelligence | |||
High Out-of-Pocket Cost and Adult Coverage Gaps
Affordability remains the clearest demand constraint in the United States invisible orthodontics market. CMS finalized a rule that allows states to include adult dental services in 2027 EHB benchmark plans, but orthodontic coverage was not explicitly added to the benchmark categories, which leaves real uncertainty around future benefit design[2]Centers for Medicare and Medicaid Services, “HHS Finalizes Policies to Make Marketplace Coverage More Accessible and Expand Essential Health Benefits,” CMS, cms.gov. Clear aligner treatment still routinely costs USD 3,000 to USD 8,000 out of pocket, which is far above the support offered by many supplemental dental plans. Lifetime orthodontic maximums of USD 1,000 to USD 2,000 leave most of the treatment bill with the patient, so financing often becomes the deciding factor rather than clinical need. That cost profile skews utilization toward households with stronger income and credit access, even though the addressable pool is much wider. Third-party financing and in-house installment plans help close some of the gap, but they do not remove the price barrier and can add repayment risk for both patients and practices.
Tighter Scrutiny of Mail-Order Aligners and In-Person Exam Requirements
Regulatory pressure on mail-order aligners is changing how patients enter the United States invisible orthodontics market. The AAO met with FDA leadership in 2025 and urged patients to report aligner issues through the FDA process, which signaled that adverse event reporting is becoming central to future oversight. That shift became more visible when the FDA issued a Class 2 recall for the BYTE Aligner System in late 2024. Pure DTC models are losing trust and regulatory room, while supervised teleorthodontic models are moving closer to traditional provider-led care. Patients who once entered through mail-order channels are increasingly being redirected to licensed professionals for examination, records, and treatment management. Established manufacturers benefit from this correction because their business models already sit inside compliant clinical networks.
*Our forecasts treat driver/restraint impacts as directional, not additive. The impact forecasts reflect baseline growth, mix effects, and variable interactions.
Segment Analysis
By Product: Clear Aligner Dominance Masks Ceramic’s Strategic Ascent
Clear aligners held 86.31% of the United States invisible orthodontics market share in 2025, which kept the category tightly centered on removable transparent appliances. Align Technology reported USD 3.2 billion in clear aligner revenue in 2025 and 2.6 million global case shipments, which confirmed the scale and maturity of the leading platform. In Q1 2026, Align shipped 685.7 thousand cases, up 6.7% year over year, while North American volumes remained stable[3]Align Technology, Inc., “Align Technology Announces First Quarter 2026 Financial Results,” Align Technology Investor Relations, investor.aligntech.com. That pattern shows that U.S. expansion is now leaning more on deeper provider utilization and stronger case conversion than on simple network expansion. Across the United States invisible orthodontics market, the product story still begins with clear aligners because they define both patient expectations and competitive positioning.
Ceramic braces are projected to grow at a 15.38% CAGR from 2026 to 2031, which makes them the fastest-growing product sub-segment. Their role remains important in cases where clinicians want more direct torque control or force levels that fall outside predictable aligner performance. Ormco expanded digital bonding to more orthodontic bracket systems at AAO 2026, which showed that bracket manufacturers are modernizing workflow rather than giving ground to aligners. Lingual braces remain a small but premium option for adults who want maximum discretion and accept a higher cost and narrower provider base. Retainers also remain strategically important because every finished case can convert into repeat post-treatment revenue, which keeps product lifetime value higher than initial treatment revenue alone suggests.


By Material: Multilayer Polyurethane Holds Structural Lead While PETG Gains Clinical Ground
Polyurethane and co-polyester multilayer films accounted for 75.24% of revenue in 2025, which kept the material base of the United States invisible orthodontics market tilted toward premium multilayer performance. Align Technology’s SmartTrack platform helped establish that benchmark, and related multilayer polymer sheet constructions remain protected by patent coverage. Research published in Orthodontics and Craniofacial Research showed that PETG and thermoplastic polyurethane differ in stiffness behavior by tooth region and aligner thickness. That evidence supports the view that material selection is a treatment-performance decision rather than a simple sourcing choice. As a result, established multilayer systems still hold the clinical lead in the United States invisible orthodontics market.
PETG is projected to grow at a 15.52% CAGR from 2026 to 2031, driven by broader use among challenger brands that want a performance-value position. PETG offers a practical balance of transparency, processability, and cost, which makes it attractive for brands trying to widen access without moving fully downmarket. Direct-print resin materials are also starting to enter the discussion, because they could eventually remove the thermoforming step and support on-demand in-office production. FDA clearance for Primeprint Direct Aligner under K250739 in October 2025 and subsequent clinical evaluation activity in 2026 moved that concept closer to real use, even though it is still early. The United States invisible orthodontics industry is therefore moving toward a layered material structure with premium multilayer films at the top, PETG in the middle, and printed resins as a future in-house production option.
By Age Group: Adult Volume Anchors Revenue While Teens Drive Forward Growth
Adults accounted for 59.52% of revenue in 2025, which made them the largest age cohort in the United States invisible orthodontics market. The AAO stated that roughly 1 in 3 current orthodontic patients is now an adult, and its member census estimated 1.91 million adults in active treatment through AAO members in 2024. Adults keep revenue weighted higher because they often choose premium appliances, self-initiate treatment, and seek correction that fits visible professional settings. A growing share of adult demand also comes from relapse and retreatment, which gives this cohort a recurring element that is different from first-time adolescent care. That keeps adult case flow central to revenue stability even as younger cohorts grow faster.
Teens are projected to expand at a 14.25% CAGR from 2026 to 2031, which makes them the fastest-growing age group. Align Technology reported that close to 1 million teens and kids started Invisalign treatment globally in 2025, supported by products aimed at both comprehensive and earlier-stage care. The children and mixed dentition segment remains smaller in current revenue terms, but it is widening the future candidate base. The Invisalign Palatal Expander System and its evolving design support a less metal-intensive path for early intervention, which can pull invisible treatment further into Phase 1 care. Ormco’s Spark Junior launch in September 2025 added another pediatric-focused option, which shows that younger patients are becoming a more active competitive battleground.
By Care Setting: Independent Practices Anchor Volume as OSOs Redefine the Growth Curve
Standalone orthodontic practices held 52.24% of revenue in 2025, which kept specialist-led offices as the largest care setting. That position reflects established referral ties with general dentists and a long-standing patient preference for specialist oversight in orthodontic treatment. Group practices, DSOs, and OSOs are projected to grow at a 15.83% CAGR from 2026 to 2031, which gives them the fastest expansion rate in the United States invisible orthodontics market size. Smile Doctors’ acquisition of myOrthos pushed its affiliated network to more than 550 locations across 36 states, which showed how far the group-practice model had scaled by 2025. Hospitals and academic dental centers remain a smaller setting, mainly focused on complex cases, craniofacial coordination, and training-driven protocol work.
The rise of larger networks changes demand as much as supply. Multi-site groups can spread scanner and software costs across many locations, negotiate better financing options, and market to adult patients at a scale that independent clinics often cannot match. Manufacturers also benefit because bulk purchasing and preferred vendor agreements improve revenue visibility across the United States invisible orthodontics market. At the same time, network scale gives buyers more leverage on pricing, training support, and implementation resources. The result is a care-setting shift that supports volume growth but also makes channel relationships more strategic and more demanding for suppliers.
By Provider Type: Orthodontist Leadership Persists, GP Expansion Reshapes Channel Economics
Orthodontists held 65.44% of the United States invisible orthodontics market share in 2025, which kept specialists in clear control of the provider mix. The AAO’s 2024 consumer study reported that orthodontists treated 70% of all orthodontic patients across modalities, which aligns with that leadership position. Specialist leadership remains strongest in complex movement planning, higher-acuity corrections, and treatment that requires more intensive monitoring. General dentists are projected to grow at a 15.53% CAGR from 2026 to 2031, supported by manufacturer training, scanner adoption, and patient preference for receiving more oral care in one setting. This provider mix is becoming one of the main channel shifts shaping the United States invisible orthodontics industry.
General dentist growth is expanding the treated pool rather than simply taking cases away from orthodontists. Align Technology reported that Q4 2025 clear aligner volumes in the GP channel rose 5.3% year over year, while the orthodontic channel also grew 8.9%, which indicates that both channels were still moving higher. That pattern supports the view that GP adoption is capturing mild-to-moderate cases that may otherwise have remained untreated. Manufacturers are responding with software, planning support, and training systems that lower the operational burden for newer GP users. In the United States invisible orthodontics industry, the brands that balance GP access with clinical credibility are likely to hold the most durable provider relationships.
By Sales Channel: Offline Infrastructure Anchors Trust While Online Evolves Beyond DTC
Offline channels accounted for 74.44% of revenue in 2025, which kept the United States invisible orthodontics market rooted in professional settings. In-person examinations, records, attachment placement, and fit checks continue to support this channel, even as digital tools reduce the number of follow-up visits. The FDA recall involving BYTE in late 2024 accelerated the shift away from unsupervised mail-order care and reinforced the value of provider-led treatment starts. Offline cases also tend to carry higher revenue per patient because they include more complex prescriptions, accessory use, and ongoing retention products. That gives the physical clinical channel a durable advantage even as digital ordering becomes more common.
Online channels are projected to grow at a 14.53% CAGR from 2026 to 2031, which makes them the fastest-rising route within the United States invisible orthodontics market size. The nature of online growth is changing, because it now depends less on pure DTC models and more on supervised workflows such as digital refinements, retainer replacement subscriptions, and remote case management. Solventum’s Clarity Portal update in January 2025 allowed practices to order as few as 16 aligner stages without a new patient scan, which shows how online tools are being built into routine professional care. As a result, the line between online and offline channels is becoming less rigid. Durable growth in this channel is now tied to legitimate provider workflows rather than autonomous remote treatment models.
Geography Analysis
The United States is a single-country market, but it remains the global reference point for invisible orthodontic adoption, pricing, and regulatory practice. It also represents the largest revenue base inside North American clear aligners, supported by high discretionary health spending and a deep specialist network. The country had around 11,000 active orthodontists, which continues to support broad access in established metro corridors. Urban markets such as New York, Los Angeles, Miami, Dallas, and Chicago generate outsized case volumes because they combine higher income density, stronger insurance penetration, and dense specialist networks. The AAO reported that per-member patient counts reached 696 in 2024, which shows that demand remained strong even in already developed parts of the United States invisible orthodontics market.
Secondary cities and suburban corridors now offer the clearest runway for incremental expansion. Smile Doctors’ 2024 and 2025 growth activity showed an active push into less saturated geographies where provider density had been lower. These markets often convert consultations into treatment at higher rates because patients face fewer competing recommendations and less channel confusion. Suburban practices also benefit from family-oriented demand patterns, which support teen care, early intervention, and retainer continuity. Rural markets remain the most underserved areas because provider scarcity and income sensitivity still limit access. Hybrid monitoring is helping narrow that gap by reducing travel frequency while keeping clinical authority with licensed providers.
The regulatory environment is one of the strongest geography-specific forces shaping this category. FDA classification of sequential aligners as Class II devices under product code NXC keeps market entry tied to pre-market compliance, which limits easy entry by undifferentiated newcomers. State dental practice rules also affect how much case complexity general dentists can manage, which means channel mix can differ meaningfully across states. CMS policy allowing states to add adult dental benefits from 2027 is being watched closely, but near-term volume change will still depend on which states act first and how broadly they define covered benefits.
Competitive Landscape
The United States invisible orthodontics market is moderately concentrated at the top and more fragmented across the middle of the field. Align Technology still holds the strongest platform position because it combines aligner manufacturing, a well-established brand, and tightly integrated treatment-planning software. That workflow control creates switching costs for providers, especially once teams are trained on a specific digital ecosystem. Competitors are responding by building their own software layers and practice tools rather than competing on appliance design alone. Ormco’s Spark StageRx, Align’s ClinCheck Live Plan, Solventum’s Clarity Portal, and Dentsply Sirona’s ongoing digital aligner development all show that workflow depth is becoming as important as physical product performance.
A second front of competition is forming around pediatric-interceptive care and the GP-led mild malocclusion case. Align has expanded its reach with Invisalign First and the Palatal Expander System, while Ormco entered the younger age segment with Spark Junior. Solventum is leaning on its established bracket and bonding relationships to support aligner adoption through portfolio continuity and digital ordering tools. Ormco also tied Spark to DentalMonitoring in April 2025, which gave providers a clearer productivity case for selecting its system. Straumann took a different route in October 2025 by reshaping production economics through a strategic partnership with Smartee for ClearCorrect manufacturing in EMEA and APAC, which points to sharper cost discipline among mid-tier challengers.
Regulatory infrastructure is adding another layer of competitive separation. Vendors with established clinical evidence, compliance systems, and training programs are better positioned to handle rising scrutiny of remote and DTC treatment models. That advantage matters more as DSOs and group practices prefer suppliers that can support scale, standardization, and multi-site onboarding. The United States invisible orthodontics market therefore remains highly competitive, but the strongest positions now come from integrated platforms, reliable clinical channels, and the ability to improve practice productivity rather than from price alone.
United States Invisible Orthodontics Industry Leaders
Align Technology Inc.
Envista Holdings Corporation (Ormco)
Institut Straumann AG
Solventum Corporation
Dentsply Sirona Inc.
- *Disclaimer: Major Players sorted in no particular order

Recent Industry Developments
- May 2026: MHR Orthodontics introduced Spark Clear Aligners to its treatment options. This addition gives patients more flexibility, offering another clear aligner choice alongside Invisalign and the practice’s bracket-based systems.
- April 2026: OrthoFX, known for driving innovation in clear aligner technology, launched its FXIntegrated Buttons. These buttons are a breakthrough as the first in the industry to be fully manufactured and seamlessly built into the aligner, tailored to the clinician’s prescription.


United States Invisible Orthodontics Market Report Scope
As per the scope of the report, invisible orthodontics, also known as clear aligners or invisible braces, refers to a type of orthodontic treatment that uses transparent, removable aligners to straighten teeth and correct dental issues. These aligners are custom-made to fit snugly over the teeth, making them virtually invisible when worn, providing a discreet alternative to traditional metal braces.
The segmentation for the United States invisible orthodontics market is categorized by product, material, age group, care setting, provider type, and sales channel. The product segment includes clear aligners, ceramic braces, lingual braces, and retainers. The material segment comprises polyurethane/co-polyester multilayer films, PETG, polycarbonate, and other thermoplastics. The age group segment is divided into adults, teens, and children and mixed dentition. The care setting segment includes standalone orthodontic practices, group practices (DSOs and OSOs), hospitals and academic dental centers, and other dental clinics. The provider type segment consists of orthodontists and general dentists. Lastly, the sales channel segment is categorized into offline and online channels. For each segment, the market size and forecast are provided in terms of value (USD).
| Clear Aligners |
| Ceramic Braces |
| Lingual Braces |
| Retainers |
| Polyurethane / co-polyester multilayer films |
| PETG |
| Polycarbonate |
| Other thermoplastics |
| Adults |
| Teens |
| Children and mixed dentition |
| Standalone orthodontic practices |
| Group practices, DSOs, and OSOs |
| Hospitals and academic dental centers |
| Other dental clinics |
| Orthodontists |
| General dentists |
| Offline |
| Online |
| By Product | Clear Aligners |
| Ceramic Braces | |
| Lingual Braces | |
| Retainers | |
| By Material | Polyurethane / co-polyester multilayer films |
| PETG | |
| Polycarbonate | |
| Other thermoplastics | |
| By Age Group | Adults |
| Teens | |
| Children and mixed dentition | |
| By Care Setting | Standalone orthodontic practices |
| Group practices, DSOs, and OSOs | |
| Hospitals and academic dental centers | |
| Other dental clinics | |
| By Provider Type | Orthodontists |
| General dentists | |
| By Sales Channel | Offline |
| Online |


Key Questions Answered in the Report
What is the current value of the United States invisible orthodontics market?
The United States invisible orthodontics market was valued at USD 3.17 billion in 2025 and is estimated at USD 3.57 billion in 2026, with USD 6.51 billion expected by 2031.
What is driving future growth in clear dental correction across the United States?
Growth is being supported by rising adult treatment demand, better digital planning, remote monitoring, and wider access through DSOs, OSOs, and general dentist adoption.
Why do clear aligners lead product demand in the United States?
Clear aligners held 86.31% of product revenue in 2025 because they match patient demand for discreet treatment and fit well with digital orthodontic workflows.
Which patient group contributes the most revenue today?
Adults led with 59.52% of revenue in 2025, helped by strong aesthetic demand, self-financing ability, and a growing retreatment pool.
Which channels are growing fastest for invisible orthodontic products?
Online channels are growing at a 14.53% CAGR through 2031, but growth is now coming mainly from supervised digital workflows rather than unsupervised DTC models.
What is the main barrier holding back wider treatment uptake?
The biggest barrier is cost, since clear aligner treatment often runs from USD 3,000 to USD 8,000 out of pocket and insurance support still covers only a limited share for many adults.
Page last updated on:


