Orthodontic Supplies Market Size and Share
Market Overview
| Study Period | 2020 - 2031 |
|---|---|
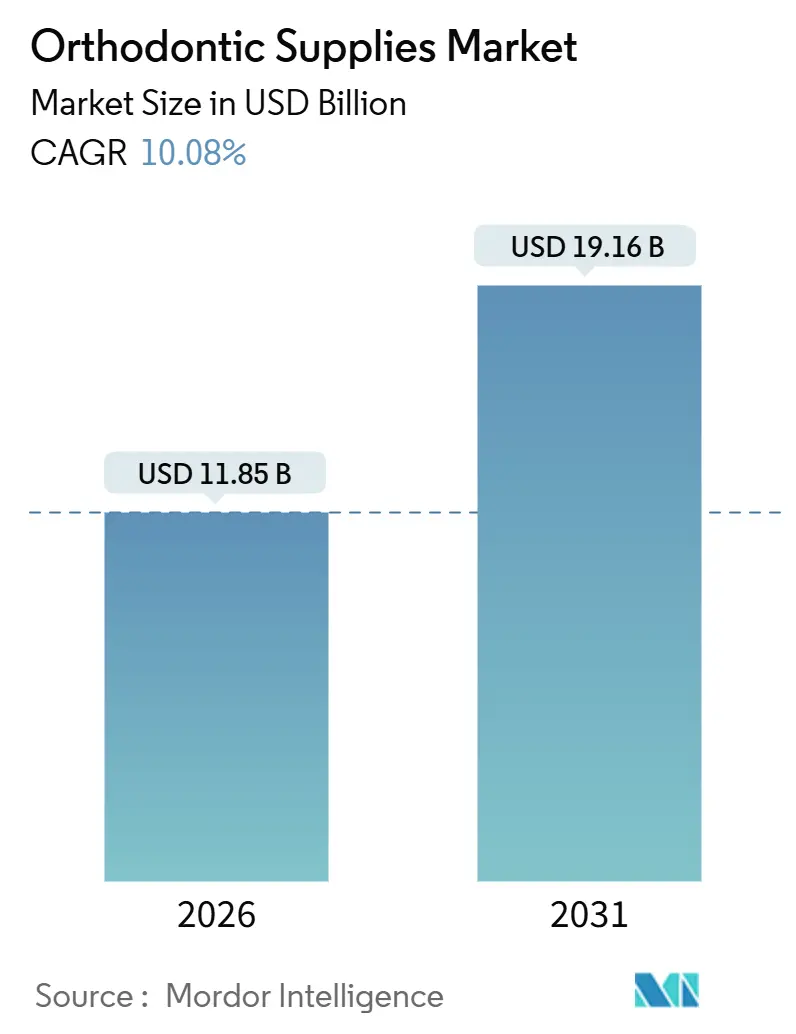
| Market Size (2026) | USD 11.85 Billion |
| Market Size (2031) | USD 19.16 Billion |
| Growth Rate (2026 - 2031) | 10.08% CAGR |
| Fastest Growing Market | Asia Pacific |
| Largest Market | North America |
| Market Concentration | Medium |
Major Players *Disclaimer: Major Players sorted in no particular order Image © Mordor Intelligence. Reuse requires attribution under CC BY 4.0. | |
Orthodontic Supplies Market Analysis by Mordor Intelligence
The Orthodontic Supplies Market size is estimated at USD 11.85 billion in 2026, and is expected to reach USD 19.16 billion by 2031, at a CAGR of 10.08% during the forecast period (2026-2031).
The trajectory highlights a shift from purely demographic tailwinds to technology-driven demand, as chair-side artificial-intelligence platforms compress treatment planning from weeks to minutes and direct-to-consumer (DTC) clear-aligner brands erode incumbent revenues. At the same time, dental service organizations (DSOs) are pooling procurement, forcing vendors to revise margin structures. The World Health Organization reported 3.5 billion people with oral disease in 2024, and untreated malocclusion represents a substantial share of that burden.[1]World Health Organization, “Global Oral Health Status Report 2024,” WHO, who.int Clear-aligner innovation, rapid in-office 3D printing, and rising adult aesthetic expectations are pulling the orthodontic supplies market into high-growth mode even as regulators tighten oversight on bonding adhesives and DTC care pathways. Vendor strategies now converge on digital ecosystems that bundle intraoral scanning, treatment-planning software, and subscription monitoring tools to defend revenue streams in an increasingly consolidated landscape.
Key Report Takeaways
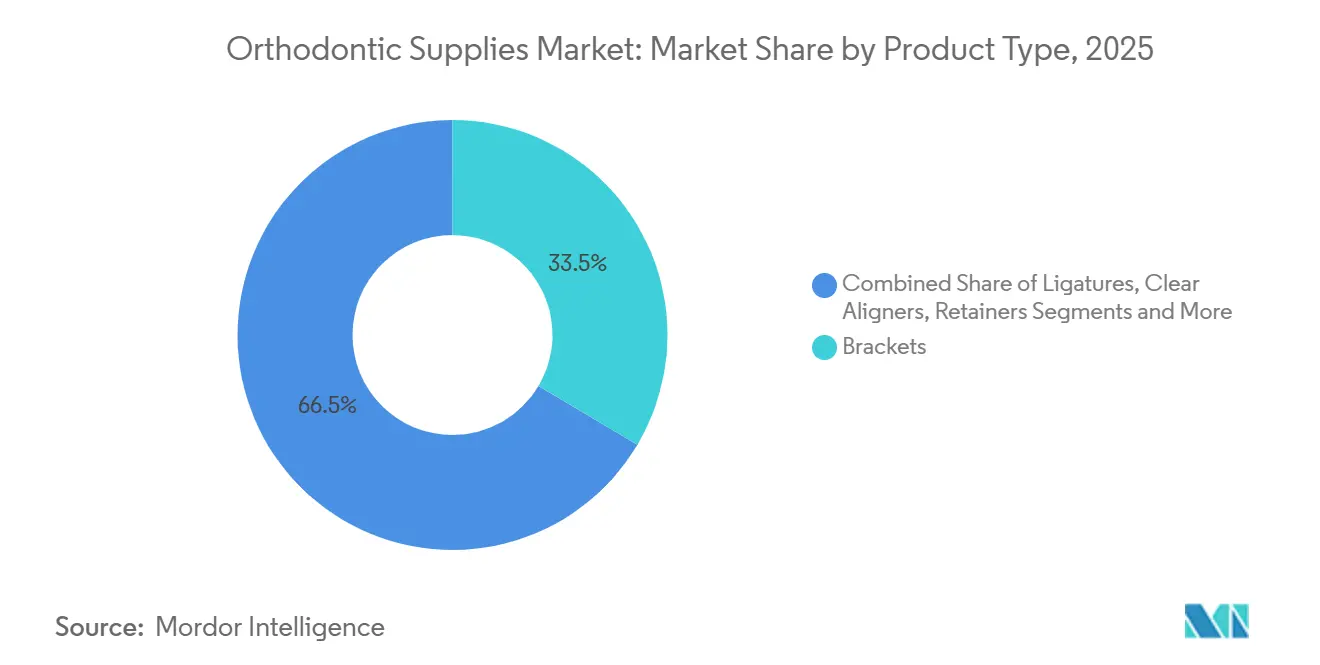
- By product type, brackets led with 33.52% of orthodontic supplies market share in 2025; clear aligners are forecast to expand at a 14.25% CAGR to 2031.
- By material, stainless steel accounted for 44.63% of orthodontic supplies market size in 2025; ceramic materials are projected to grow at a 13.51% CAGR through 2031.
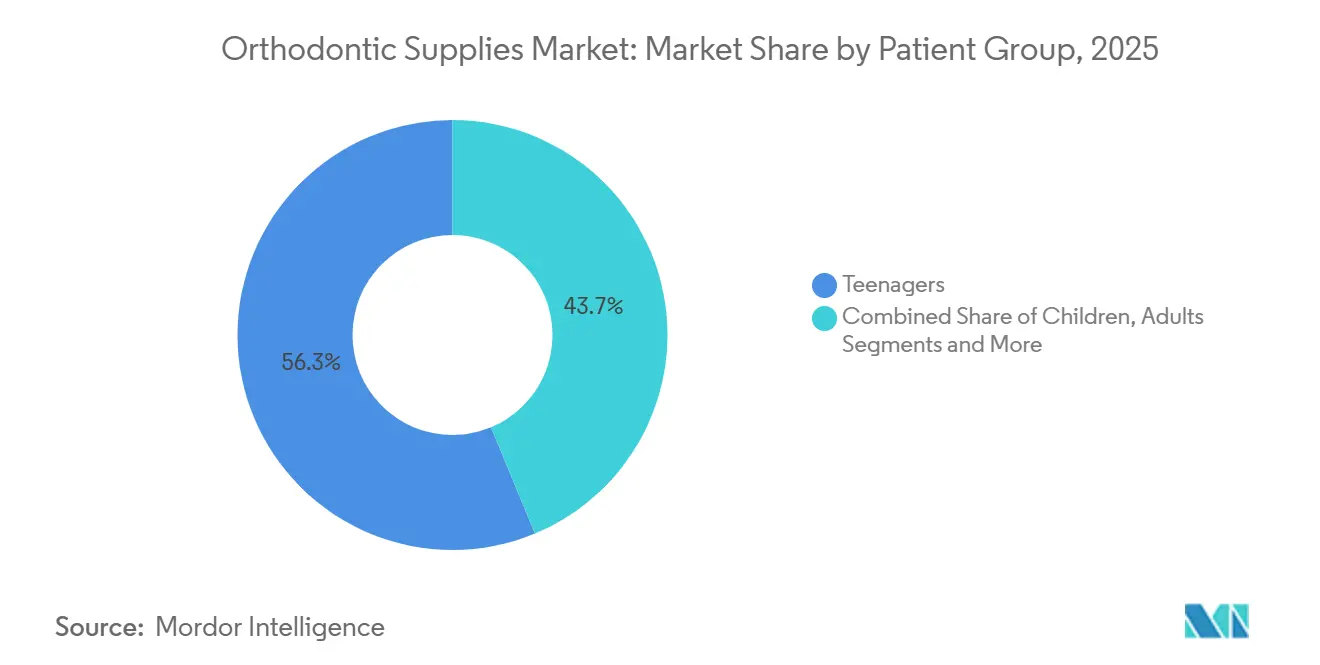
- By patient group, teenagers held 56.27% volume share in 2025; adults will record the highest CAGR at 12.23% through 2031.
- By end-user, dental clinics captured 47.86% revenue share in 2025; DTC platforms will post a 13.63% CAGR through 2031.
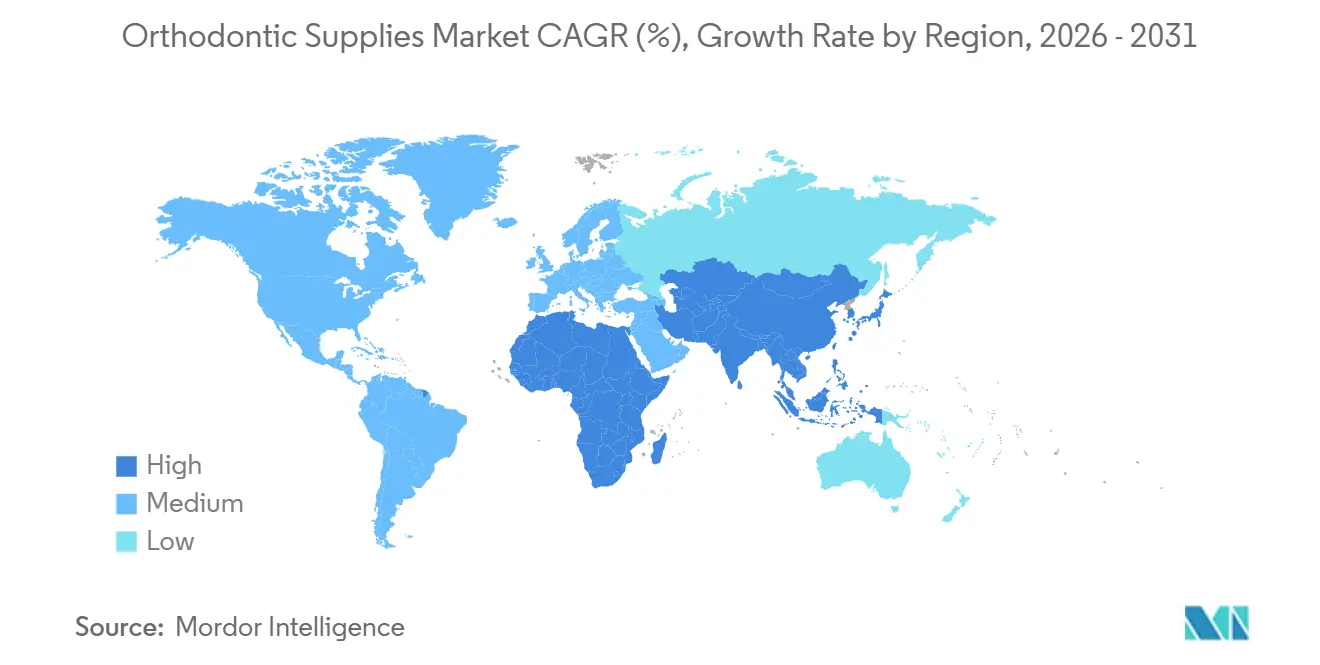
- North America contributed 36.44% of global revenue in 2025 and Asia-Pacific is advancing at a 13.01% CAGR to 2031.
Note: Market size and forecast figures in this report are generated using Mordor Intelligence’s proprietary estimation framework, updated with the latest available data and insights as of January 2026.
Global Orthodontic Supplies Market Trends and Insights
Drivers Impact Analysis*
| Driver | (~) % Impact on CAGR Forecast | Geographic Relevance | Impact Timeline |
|---|---|---|---|
| Growing Prevalence of Malocclusions | +2.1% | Global, pronounced in Asia-Pacific and Latin America | Long term (≥ 4 years) |
| Rising Disposable Income and Demand for Aesthetics | +1.8% | China, India, Middle East, parts of Latin America | Medium term (2–4 years) |
| Technological Advances in Clear Aligners | +2.4% | North America, Europe, urban Asia-Pacific | Short term (≤ 2 years) |
| Expansion of Dental Service Organizations | +1.3% | North America, Western Europe | Medium term (2–4 years) |
| AI-Powered Chair-Side Customization | +1.5% | North America, Europe, Tier-1 Asian cities | Short term (≤ 2 years) |
| Eco-Friendly Bio-Resorbable Materials | +0.9% | Europe first, selective North America adoption | Long term (≥ 4 years) |
| Source: Mordor Intelligence | |||


Growing Prevalence of Malocclusions
WHO data frame malocclusion as a silent public-health burden, yet access barriers limit treatment uptake. Dental associations in India and Indonesia now run education drives that shorten diagnosis-to-treatment timelines, translating latent need into active case starts. Vendors with tiered portfolios—low-cost metal brackets for mass markets and premium ceramic options for affluent consumers—capture the resulting volume. Early intervention guidelines for children aged 7–9 extend therapeutic windows, raising lifetime spend per patient. No jurisdiction mandates population-level screening, so private-sector efforts remain central to demand creation.
Technological Advances in Clear Aligners
Innovation has shifted from materials to software. Align Technology’s AI CADe tool, cleared in 2025, auto-plots radiographic landmarks and cuts planning time 40%. Self-ligating brackets reduce friction and trim appointment frequency, resonating with DSOs that maximize chair utilization. Regulatory bodies have opened clear-aligner indications to complex pediatric expansion, displacing brackets in a former stronghold.[2]U.S. Food and Drug Administration, “Invisalign Palatal Expander – 510(k) Clearance,” FDA, fda.gov Vendors lacking integrated digital workflows face commodity pricing as orthodontists adopt platforms that save labor.
AI-Powered Chair-Side Customization
Remote monitoring via smartphone imagery and computer vision slashes in-office visits by half, while same-day 3D printing collapses supply chains from weeks to hours. Vendors that bundle scanners, software, and fabrication hardware secure predictable subscription revenue and higher account retention. Competitors that rely solely on brackets risk margin squeeze as DSOs standardize on end-to-end ecosystems.
Expansion of Dental Service Organizations
DSOs control roughly 20% of U.S. practices, a share forecast to hit 30% by 2028. The USD 4.1 billion take-private of Patterson Companies exemplifies this consolidation wave. Larger purchase orders now come with rebate tiers, consignment inventory, and strict service-level expectations. Mid-tier suppliers must either scale through mergers or focus on niche anchorage devices to preserve pricing power.
Restraints Impact Analysis*
| Restraint | (~) % Impact on CAGR Forecast | Geographic Relevance | Impact Timeline |
|---|---|---|---|
| High Treatment Cost and Limited Insurance Cover | -1.7% | Global, most acute in emerging economies | Medium term (2–4 years) |
| Product Recalls and Adverse Effects | -0.8% | North America, Europe | Short term (≤ 2 years) |
| Reliance on Niche Nickel-Titanium Alloy Suppliers | -0.6% | Global, concentrated in Chinese sourcing | Medium term (2–4 years) |
| Regulatory Scrutiny of Direct-to-Consumer Aligners | -0.9% | North America, Europe, evolving in Asia-Pacific | Short term (≤ 2 years) |
| Source: Mordor Intelligence | |||
High Treatment Cost and Limited Insurance Cover
Typical U.S. dental plans cap orthodontic benefits near USD 2,000, leaving households to finance the remaining USD 3,000–5,000. The American Association of Orthodontists noted rising default rates on payment plans as inflation erodes budgets.[3]American Association of Orthodontists, “Financing and Payment Trends in Orthodontic Practices,” AAO, aaoinfo.org In India and Brazil, therapy can equal several months of income, restricting uptake to urban elites. DTC aligner brands undercut clinic prices by up to 50%, yet regulator crackdowns on supervision gaps may reduce their edge.
Regulatory Scrutiny of Direct-to-Consumer Aligners
FDA warning letters and FTC probes now force DTC firms to integrate licensed-dentist oversight, raising compliance cost and slowing case acquisition. Europe’s Medical Device Regulation imposes stricter post-market evidence requirements, while Asia-Pacific remains permissive—for now. The risk for suppliers is stranded DTC capacity if regional rules converge on the stricter North American model.
*Our forecasts treat driver/restraint impacts as directional, not additive. The impact forecasts reflect baseline growth, mix effects, and variable interactions.
Segment Analysis
By Product Type: Clear Aligners Narrow Bracket Lead
Brackets retained 33.52% of orthodontic supplies market in 2025, favored for severe biomechanical movements that aligners still find challenging. Clear aligners, however, are growing at a 14.25% CAGR as adults prioritize aesthetics and chair-side 3D printing supports on-demand trays. Archwires and ligatures remain high-volume consumables but face price pressure as alloy recipes standardize. Retainers produce steady annuity revenue after active treatment, and newer thermoplastic versions improve comfort. Adhesive bond failures triggered 2024 recalls, prompting clinics to favor suppliers with robust quality-assurance data.
Digital ecosystems tilt revenue toward software subscriptions bundled with aligner deliveries. Practices that integrate scanners, AI-planning, and remote monitoring become locked into vendor platforms, raising switching costs. Specialty appliances such as temporary anchorage devices maintain high margins despite lower volume because they solve complex cases. Suppliers covering the full treatment continuum—from early interceptive devices to long-term retention—are positioned to cross-sell and defend share.


By Material: Ceramic Gains Traction Over Stainless Steel
Stainless steel held 44.63% of orthodontic supplies market size in 2025 because of durability and affordability. Ceramic brackets advance at a 13.51% CAGR as patients pay premiums for tooth-colored fixtures that resist staining. Nickel-titanium superelastic wires remain indispensable, yet 60–70% of global production is concentrated in China, driving supply-chain risk. Polymer blends dominate clear aligners, with proprietary films tuned for force delivery and comfort. Bio-resorbable composites developed in Europe eliminate removal appointments and enhance sustainability credentials.
Asian suppliers invest heavily in advanced ceramics and polymers, narrowing technology gaps with Western incumbents. Nonetheless, navigating FDA and CE clearances still favors companies with established regulatory infrastructure and ISO 13485-certified plants.
By Patient Group: Adults Drive Incremental Growth
Teenagers accounted for 56.27% of orthodontic supplies market share in 2025, benefiting from faster bone remodeling and higher treatment acceptance among parents. Adults aged 20–40 deliver a 12.23% CAGR to 2031 as workplace norms increasingly welcome orthodontic therapy and financing options proliferate. Align Technology reported adult case starts rising 18% year over year in 2024. Pediatric approvals for clear-aligner expansion systems blur boundaries between fixed and removable therapies in younger patients. Older adults pursue orthodontics to support implant or periodontal treatment, necessitating specialized protocols that command premium pricing.
Marketing now stresses discreet appliances, digital progress tracking, and payment flexibility to overcome adult hesitancy. Vendors that demonstrate clear treatment timelines and remote follow-up gain advantage in this demographic.
By End-User: DTC Platforms Challenge Clinics
Dental clinics captured 47.86% of 2025 revenue and remain primary diagnosis and appliance delivery sites. General dentists increasingly offer orthodontics to retain patients, leveraging manufacturer training programs. Orthodontic specialty clinics adopt premium solutions such as self-ligating systems and customized archwires to maintain differentiation. Hospitals focus on surgical orthodontics and cleft-palate repair but represent minor volume. Academic institutes shape clinical evidence yet purchase low quantities. DTC platforms are projected to grow at 13.63% CAGR, marketing convenience and lower cost through impression-kit models. Regulatory actions in 2024 now compel greater professional oversight, nudging many DTC brands toward hybrid clinic-plus-remote care.
Suppliers tailor offerings by channel: just-in-time logistics and rebates for DSOs, digital workflow bundles for dentists, and low-touch application-programming interfaces for DTC brands. Channel complexity increases, but so does total addressable demand.
Geography Analysis
North America produced 36.44% of global revenue in 2025. High insurance penetration offsets a portion of orthodontic costs, and DSOs accelerate consolidation. Vendors compete on service-level performance, volume rebates, and integrated digital platforms tailored to large practice networks. Europe is mature but stable, with Germany, France, and the United Kingdom advancing bio-resorbable materials in line with sustainability goals. Medical Device Regulation compliance raises operating cost yet ensures product safety, favoring well-capitalized suppliers.
Asia-Pacific is the growth engine, forecast at a 13.01% CAGR through 2031. China benefits from healthcare investment in Tier-2 and Tier-3 cities and rising disposable income that supports clear-aligner uptake. India’s urban clinics adopt aligners aggressively, although rural affordability gaps persist. Japan and South Korea showcase mature digital dentistry ecosystems, where AI planning and remote monitoring are routine. Australia aligns regulatory frameworks with FDA norms, simplifying trans-Pacific platform transfers. Suppliers succeed by pairing local manufacturing or distribution partners with cloud-based treatment planning that bypasses infrastructure constraints.
The Middle East and Africa remain nascent. Demand concentrates in Gulf Cooperation Council states—United Arab Emirates and Saudi Arabia—where medical tourism and expatriate populations support premium care. South Africa leads sub-Saharan adoption, yet income disparity restrains wider market growth. Latin America shows cyclical demand driven by macroeconomic volatility; Brazil and Argentina deliver sizable volumes but require localized pricing strategies to navigate currency swings. Vendors mitigate regional risks through flexible payment options and modular product configurations.

Competitive Landscape
The orthodontic supplies market exhibits moderate concentration. Align Technology captures roughly 25–30% of global aligner revenue and reinforces its moat through proprietary AI software, in-house manufacturing, and subscription monitoring that deepen customer lock-in. Straumann Group leverages its implant distribution network to cross-sell ClearCorrect aligners and bundles practice-management tools aimed at DSOs. Dentsply Sirona integrates imaging and CAD/CAM equipment with SureSmile aligners, embedding orthodontics into a broader digital workflow. Chinese challengers Angelalign and Smartee scale rapidly at home by offering cost-effective aligners, though international expansion is hampered by brand recognition and regulatory complexity.
ISO 13485 certification and FDA/CE approvals remain entry tickets, but post-market surveillance under EU MDR raises fixed costs that favor large players. Patent expirations late in the decade could enable generic aligners, yet incumbents retain advantage through service depth and data-rich treatment algorithms. Suppliers must decide whether to broaden portfolios across brackets, aligners, anchorage devices, and retainers or focus vertically on end-to-end digital platforms. Mid-market generalists risk being squeezed between low-cost specialists and integrated giants.
Orthodontic Supplies Industry Leaders
Align Technology Inc
Envista Holdings
Dentsply Sirona Inc.
Solventum
Henry Schein Orthodontics
- *Disclaimer: Major Players sorted in no particular order

Recent Industry Developments
- October 2025: LuxCreo secured strategic funding from Angelalign to co-develop next-generation 3D-printing materials for direct aligner fabrication, aiming to reduce production cycles to under 30 minutes.
- September 2025: Medit launched Medit Aligners, a premium digital solution that integrates its intraoral scanners with cloud design services to cut turnaround times.
- May 2025: Align Technology received National Medical Products Administration approval for its Invisalign Palatal Expander, enabling commercial launch in China during H2 2025.


Research Methodology Framework and Report Scope
Market Definitions and Key Coverage
Our study defines the orthodontic supplies market as sales of fixed braces components (brackets, archwires, anchorage devices, ligatures, others) and removable appliances such as clear aligners and retainers that are supplied to dental clinics, hospitals, and direct-to-consumer platforms worldwide. These figures are expressed in USD value for new products only, excluding after-care services or replacement parts.
Scope exclusion. We deliberately leave out practice revenues from orthodontic procedures and imaging equipment so our sizing reflects pure product demand.
Segmentation Overview
- By Product Type
- Brackets
- Archwires
- Bands & Buccal Tubes
- Ligatures
- Anchorage Appliances
- Clear Aligners
- Retainers
- Adhesives
- Others
- By Material
- Metal
- Ceramic
- Nickel-Titanium
- Stainless Steel
- Polymer/Plastics
- Bio-resorbable Materials
- By Patient Group (Age)
- Children (≤12 yrs)
- Teenagers (13–19 yrs)
- Adults (20–40 yrs)
- Older Adults (>40 yrs)
- By End-User
- Hospitals
- Dental Clinics
- Orthodontic & Dentofacial Orthopedic Clinics
- Academic & Research Institutes
- Direct-to-Consumer / At-home
- By Geography
- North America
- United States
- Canada
- Mexico
- Europe
- Germany
- France
- United Kingdom
- Italy
- Spain
- Rest of Europe
- Asia-Pacific
- China
- Japan
- India
- South Korea
- Australia
- Rest of Asia-Pacific
- Middle East & Africa
- GCC
- South Africa
- Rest of Middle East & Africa
- South America
- Brazil
- Argentina
- Rest of South America
- North America
Detailed Research Methodology and Data Validation
Primary Research
Our analysts interviewed practicing orthodontists, procurement heads at large Dental Service Organizations, and regional distributors across North America, Europe, Asia, and Latin America. These discussions clarified average appliance counts per patient, emerging aligner adoption rates, and discount structures, which we then used to refine volume-to-value conversions and growth assumptions.
Desk Research
We began with structured reviews of open datasets from bodies such as the World Health Organization, FDI World Dental Federation, and national health ministries that report treated malocclusion cases and dentist density. Trade statistics from UN Comtrade and customs portals helped us understand cross-border flows of brackets and aligner kits. Company 10-Ks, investor decks, and dentistry association yearbooks gave price references and shipment clues, while news screening through Dow Jones Factiva provided event validation.
Patent analytics via Questel, together with clinical trial registries and peer-reviewed journals, added insight on material shifts from metal to ceramic and polymer hybrid designs. The sources cited are illustrative; several other public and subscription inputs were consulted to complete data collection and cross-checks.
Market-Sizing & Forecasting
A top-down treated-patient pool was built using malocclusion prevalence, treatment penetration, and retreatment cycles, which are then multiplied by appliance utilization and validated against sampled manufacturer shipments (bottom-up checkpoint). Key variables include average selling price by product group, number of active orthodontists, insurance reimbursement ratios, clear-aligner share, and demographic shifts in adult patients. Multivariate regression, combining health-spend per capita and aligner penetration trends, underpins the 2025-2030 forecast. Scenario analysis adjusts for technology price declines and macroeconomic swings.
Data Validation & Update Cycle
Models pass variance checks against independent shipment tallies, macro health indicators, and peer estimates, followed by multi-level analyst review. We refresh every twelve months, and interim updates are triggered when material events such as regulatory changes or major product launches occur.
Why Our Orthodontic Supplies Baseline Earns Maximum Trust
Published values often diverge because firms start from different patient pools, bundle accessories unevenly, or apply aggressive price curves.
Key gap drivers include inclusion of diagnostic equipment, omission of direct-to-consumer channels, use of static ASPs, and longer refresh cadences. Mordor's disciplined scope, yearly update rhythm, and dual-path (top-down with supplier roll-up checks) modeling minimize these distortions.
Benchmark comparison
| Market Size | Anonymized source | Primary gap driver |
|---|---|---|
| USD 7.40 B (2025) | Mordor Intelligence | - |
| USD 14.8 B (2024) | Global Consultancy A | Bundles imaging systems and practice consumables |
| USD 6.67 B (2024) | Industry Analyst B | Excludes direct-to-consumer aligner sales and uses static ASP |
| USD 8.29 B (2025) | Trade Journal C | Applies uniform growth to all regions without prevalence weighting |
These comparisons show that our patient-based build, live price tracking, and annual refresh deliver a balanced, transparent baseline clients can rely on for strategic planning.


Key Questions Answered in the Report
How big is the orthodontic supplies market in 2026?
It reached USD 11.85 billion and is on course for USD 19.16 billion by 2031, growing at a 10.08% CAGR.
Which product line is growing fastest?
Clear aligners, advancing at a 14.25% CAGR as adults demand discreet therapy and clinics adopt chair-side 3D printing.
Why are dental service organizations significant buyers?
DSOs consolidate procurement, demand strict rebates and just-in-time delivery, and influence product choices across large practice networks.
What supply-chain risk do archwire makers face?
Heavy dependence on nickel-titanium alloy sourced mainly from China exposes manufacturers to potential export restrictions.
How is regulation affecting direct-to-consumer aligner models?
FDA and FTC actions now require licensed-dentist oversight, raising compliance costs and narrowing the price gap with clinic-based treatment.
Page last updated on:


