Invisible Orthodontics Market Size and Share
Market Overview
| Study Period | 2020 - 2031 |
|---|---|
| Market Size (2026) | USD 8.69 Billion |
| Market Size (2031) | USD 15.66 Billion |
| Growth Rate (2026 - 2031) | 12.51% CAGR |
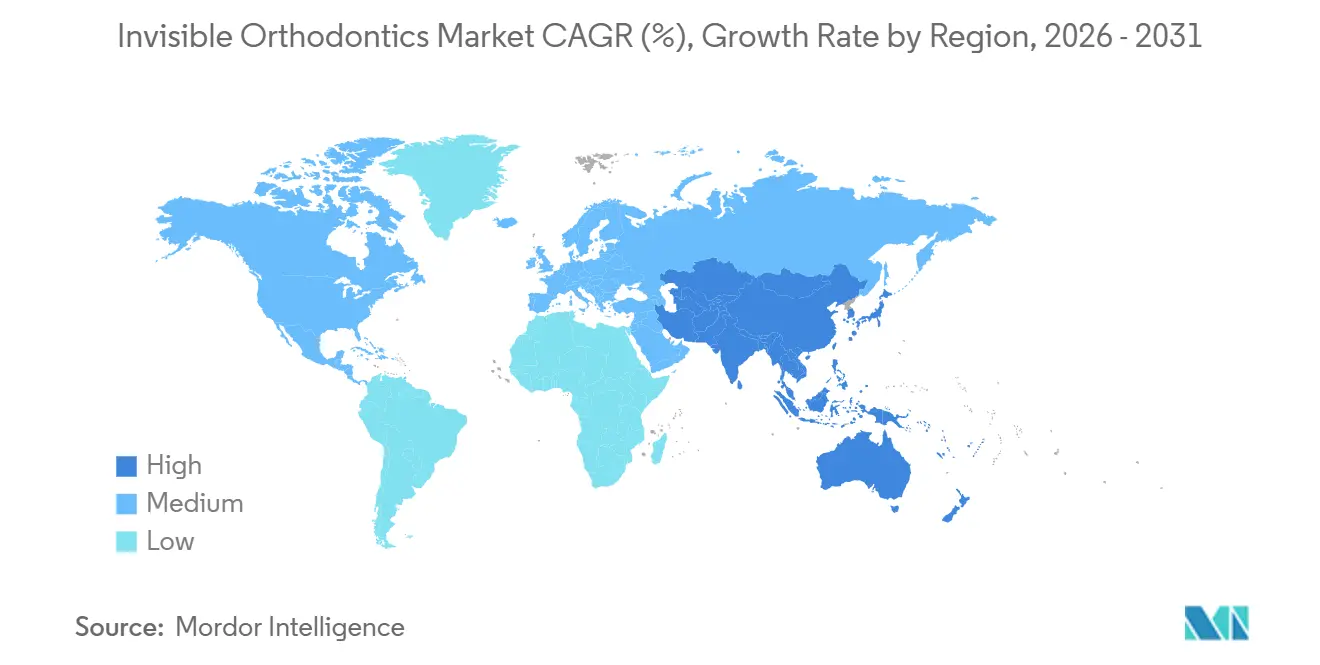
| Fastest Growing Market | Asia-Pacific |
| Largest Market | North America |
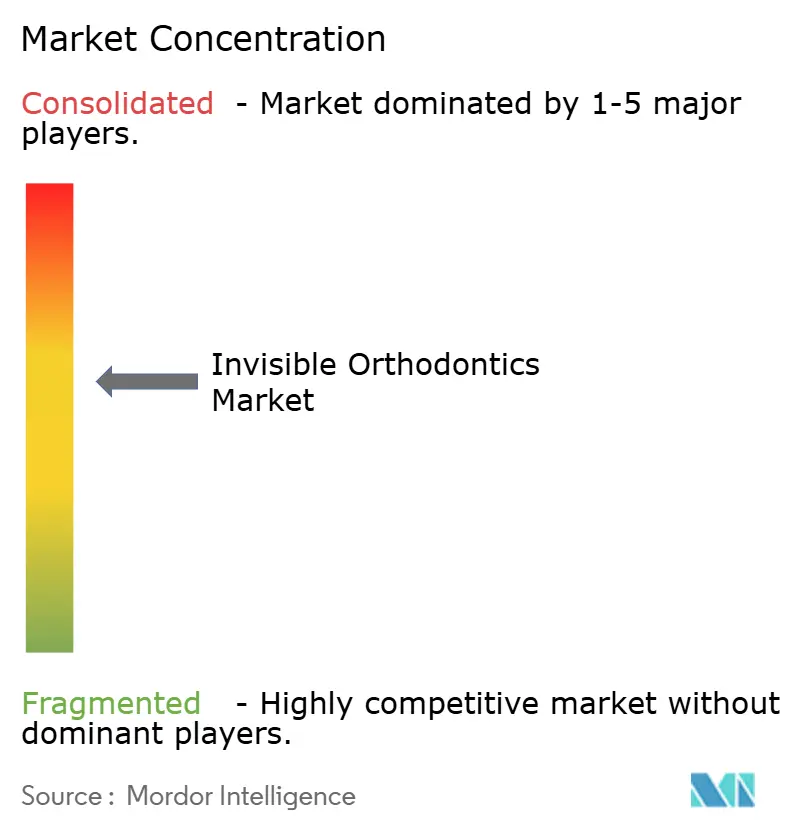
| Market Concentration | Medium |
Major Players *Disclaimer: Major Players sorted in no particular order Image © Mordor Intelligence. Reuse requires attribution under CC BY 4.0. | |

Invisible Orthodontics Market Analysis by Mordor Intelligence
The Invisible Orthodontics Market size was valued at USD 7.72 billion in 2025 and is estimated to grow from USD 8.69 billion in 2026 to reach USD 15.66 billion by 2031, at a CAGR of 12.51% during the forecast period (2026-2031).
Demand pivots on aesthetic expectations among teenagers and working adults, the clinical precision of AI-assisted treatment planning, and insurers’ growing willingness to reimburse discreet solutions. Competitive dynamics tightened after Dentsply Sirona withdrew Byte, signaling that regulatory risk now shapes channel choices as strongly as consumer preference. Patent expiries, meanwhile, invite pricing pressure, spurring incumbents to invest in proprietary polymers and integrated software that shorten chair time. Geographic growth is diverging: North America still anchors revenue, yet Asia-Pacific delivers the steepest volume gains as disposable income rises and orthodontic penetration remains low.
Key Report Takeaways
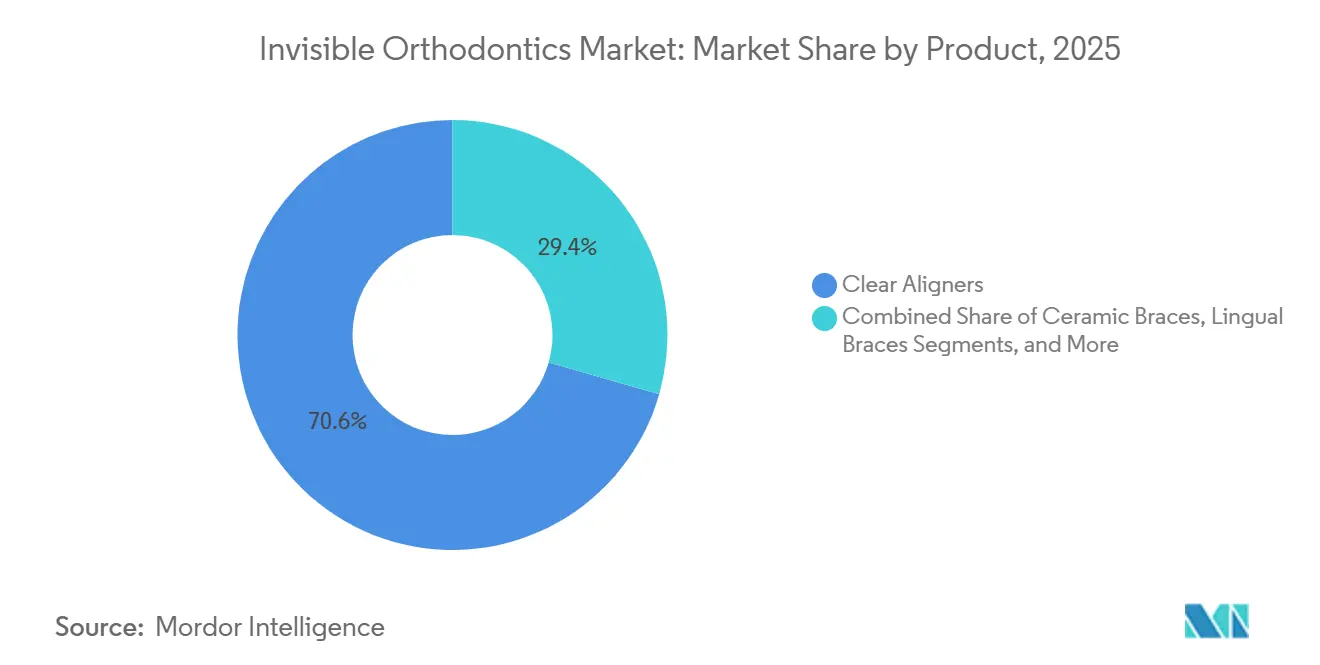
- By product category, clear aligners held 70.56% of invisible orthodontics market share in 2025, while lingual braces are forecast to advance at an 18.25% CAGR through 2031.
- By material, thermoplastic polyurethane accounted for 47.53% of the invisible orthodontics market size in 2025, and PETG is expected to expand at a 20.85% CAGR to 2031.
- By patient group, teenagers captured 51.63% of 2025 volume, whereas adults are projected to grow at a 19.87% CAGR during 2026-2031.
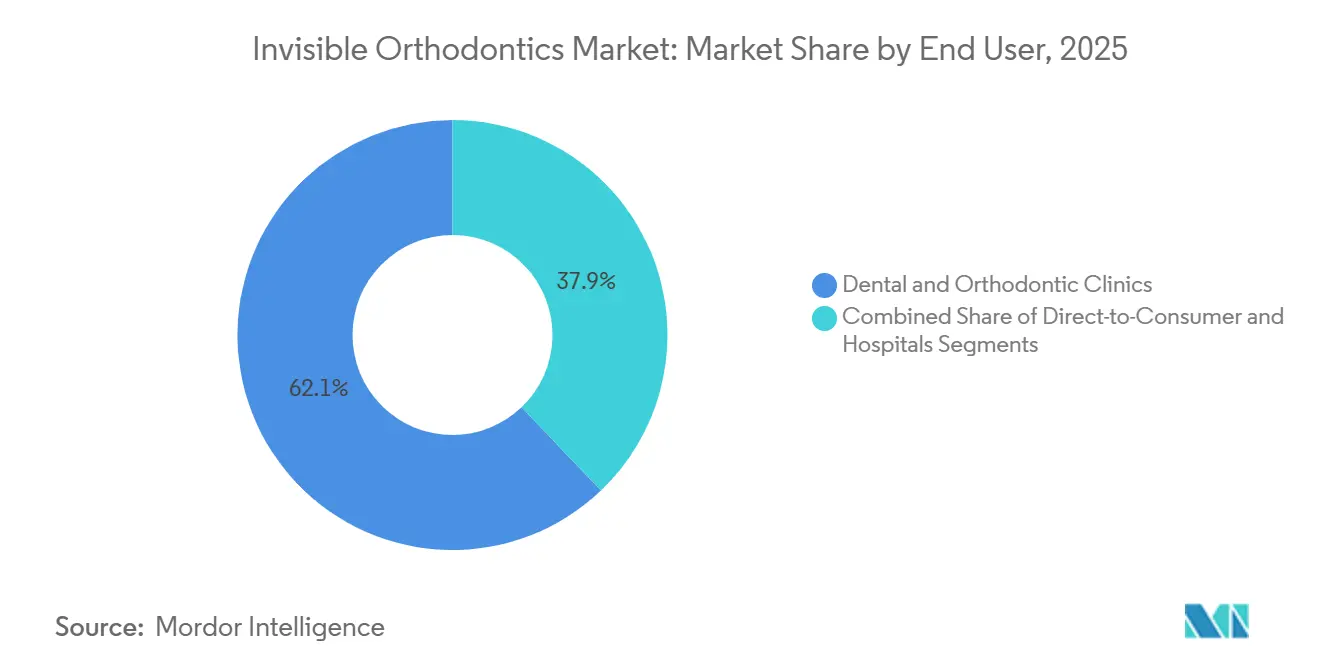
- By end user, dental and orthodontic clinics generated 62.13% of 2025 revenue, but direct-to-consumer services are poised for a 19.7% CAGR to 2031.
- By sales channel, Dentist-led in-office captured 68.13% of the invisible orthodontics market share in 2025; mail-order/online services exhibit the sharpest 21.51% CAGR through 2031.
- By geography, North America led with 43.13% of 2025 revenue, while Asia-Pacific is set to register a 21.81% CAGR to 2031.
Note: Market size and forecast figures in this report are generated using Mordor Intelligence’s proprietary estimation framework, updated with the latest available data and insights as of January 2026.
Market Trends and Insights
Drivers Impact Analysis of Invisible Orthodontics Market*
| Driver | (~) % Impact on CAGR Forecast | Geographic Relevance | Impact Timeline |
|---|---|---|---|
| Prevalence of malocclusion & aesthetic consciousness | +2.8% | Global, with urban concentration in APAC & Latin America | Long term (≥ 4 years) |
| AI-driven 3D planning & printing accelerate customization | +2.3% | North America & EU, early adoption in APAC tier-1 cities | Medium term (2-4 years) |
| Expansion of orthodontic insurance cover in OECD markets | +1.9% | OECD countries, particularly U.S., Germany, UK | Medium term (2-4 years) |
| Tele-orthodontics & remote monitoring broaden access | +2.1% | Global, strongest in North America & Western Europe | Short term (≤ 2 years) |
| Bio-resorbable & "smart" polymer aligners shorten wear cycles | +1.7% | North America & EU, pilot programs in Japan & South Korea | Long term (≥ 4 years) |
| Employer-funded dental benefits in emerging markets lift adult uptake | +1.6% | APAC (China, India), Latin America (Brazil, Mexico) | Medium term (2-4 years) |
| Source: Mordor Intelligence | |||
Prevalence of Malocclusion & Aesthetic Consciousness
More than half of the global population presents some form of malocclusion, with Class I at 51.9%, Class II at 23.8%, and Class III at 6.5%. Social-media visibility has reframed orthodontics as a lifestyle enhancement rather than solely a clinical intervention. In Australia, 31.7% of adolescents obtained orthodontic services in 2024, and 80.6% chose private clinics, illustrating a willingness to self-finance esthetic upgrades. Align Technology has treated over 20.1 million cumulative cases, and adult volume continues to climb as professionals seek discreet correction that blends into daily video calls. The preference for “stealth” solutions explains why clear aligners and lingual braces have displaced traditional metal brackets in many urban markets.
AI-Driven 3D Planning & Printing Accelerate Customization
Artificial-intelligence segmentation of cone-beam CT scans now achieves Dice similarity coefficients above 0.92, cutting manual landmarking time by up to 20% and raising throughput for small practices. Direct 3D printing of aligners from resins such as Tera Harz TC-85 eliminates thermoforming, slashing production from 10 days to 48 hours. LuxCreo and Angelalign unveiled ActiveMemory shape-recovery polymers in October 2025, claiming to trim required stages by nearly half[1]Corporate Release, “LuxCreo and Angelalign Strategic Partnership Announcement,” LuxCreo, luxcreo.com . Such workflow economies free chair time, allowing clinics to accept more cases without proportional staff hires. Faster turnaround and greater precision reinforce patient satisfaction, thereby fueling repeat referrals and social-media endorsements.
Expansion of Orthodontic Insurance Cover in OECD Markets
Lifetime orthodontic caps in the United States and Germany rose to USD 3,000–4,000 in 2024, up from historical ceilings near USD 2,000, reflecting insurers’ recognition that malocclusion affects mastication and speech. Norway’s reforms cut adult out-of-pocket costs by 60%, driving an 18% utilization increase among 25- to 40-year-olds. Flexible spending accounts now reimburse clear-aligner therapy when supervised by a licensed dentist, steering volume toward clinic-led pathways. As reimbursement broadens, dentist-supervised channels consolidate share, supporting predictable case quality and stronger follow-up compliance.
Tele-Orthodontics & Remote Monitoring Broaden Access
Platforms like Dental Monitoring enable weekly smartphone scans and AI assessments, reducing in-office visits by 50%. A single orthodontist in India can now oversee 200–300 concurrent cases digitally, a sharp rise from 80–100 under traditional protocols. Align integrated virtual check-ins into Invisalign Go, empowering general dentists to manage simple cases and expanding reach among previously underserved populations. Although some U.S. states mandate at least one physical exam, hybrid models offering both digital and on-site oversight are becoming mainstream because they balance convenience with clinical safety.
Restraints Impact Analysis of Invisible Orthodontics Market*
| Restraint | (~) % Impact on CAGR Forecast | Geographic Relevance | Impact Timeline |
|---|---|---|---|
| High treatment cost & limited reimbursement | -1.4% | Global, acute in emerging markets (India, Southeast Asia) | Medium term (2-4 years) |
| Shortage of trained orthodontists in emerging markets | -1.1% | APAC (India, Indonesia), Sub-Saharan Africa | Long term (≥ 4 years) |
| Regulatory clamp-down on DTC aligner business models | -0.9% | North America, EU (stricter in U.S. state-level enforcement) | Short term (≤ 2 years) |
| Patent expiries driving price erosion & margin squeeze | -0.8% | Global, most visible in North America & China | Medium term (2-4 years) |
| Source: Mordor Intelligence | |||
High Treatment Cost & Limited Reimbursement
In North America, a typical clear-aligner program costs USD 3,000–8,000, leaving a significant gap for households below median income given that insurance caps still hover near USD 2,000. India and Indonesia face an even sharper affordability divide, where per-capita GDP rests under USD 4,000, relegating orthodontics to upper-income urban consumers. Zero-interest installment plans do exist but carry higher default risk when treatment exceeds 18 months. Broader access hinges on bringing per-case manufacturing costs below USD 1,500, which will require larger print farms, automation, and cheaper feedstocks.
Shortage of Trained Orthodontists in Emerging Markets
India produces roughly 300 orthodontists yearly, short of the 3,000–4,000 needed for its 1.4 billion people[2]Data Division, “WHO Global Health Workforce Statistics,” World Health Organization, who.int. China, too, has under 10,000 certified specialists, concentrating skills in coastal megacities and leaving interior provinces with limited coverage. The scarcity delays case starts even as awareness rises. Digital-supervision models can help, but most regulators insist that diagnosis and treatment planning stay within specialist scope. Increasing residency seats will take years, so the sector must lean on AI-driven planning and training for general dentists to bridge the talent gap.
*Our forecasts treat driver/restraint impacts as directional, not additive. The impact forecasts reflect baseline growth, mix effects, and variable interactions.
Invisible Orthodontics Market Segment Analysis
By Product:
Clear Aligners Maintain Dominance While Lingual Braces AccelerateClear aligners generated 70.56% of 2025 revenue, reinforcing the centrality of removable trays in the invisible orthodontics market. Lingual braces, however, are projected to log an 18.25% CAGR, the fastest among fixed appliances, as CAD/CAM customization reduces chair-side adjustments. Ceramic brackets hold a niche among teens who need durability but value some discretion, while vacuum-formed retainers rule post-treatment phases. The invisible orthodontics market size for lingual systems is poised to expand sharply as software-guided bracket placement lowers labor intensity. Direct 3D-printed ceramic brackets from LightForce shorten overall active treatment by 40%, appealing to practices focused on throughput.
Lingual systems also benefit from declining component costs as in-house milling becomes mainstream. Multi-layered aligner designs—stiff outer shells paired with softer inner layers—introduce better force distribution, improving predictability and reducing refinements. Retainers evolve too: bonded variants that remove patient-compliance risk are gaining adoption despite their higher upfront price. These shifts suggest that the invisible orthodontics market will no longer hinge on a single dominant modality but rather on a palette of custom-fit solutions.


By Material:
TPU Leads, PETG RisesThermoplastic polyurethane occupied 47.53% share in 2025 because its elastic memory counters stress relaxation and maintains constant force delivery. PETG is forecast to surge at 20.85% CAGR owing to lower raw-material cost and superior thermoformability, making it attractive for large-scale print farms. Polycarbonate has ceded ground due to stiffness-related discomfort, while proprietary blends like Zendura FLX retain 92% of initial transparency over a 14-day wear cycle, outpacing generic PETG’s 78%. The invisible orthodontics market size tied to PETG is projected to widen as factories seek scrap-rate reductions.
ActiveMemory polymers introduce shape-recovery mechanics that reset tray geometry at body temperature, effectively doubling force sustainability and potentially halving the number of stages. Direct-print resins still face cost and biocompatibility constraints, yet they enable same-day delivery for complex cases, a competitive edge for urban boutique clinics. As feedstock diversity widens, the invisible orthodontics market will segment further by wear-cycle length, optical clarity, and biocompatibility.
By Patient Group:
Teens Still Rule, Adults Catch UpTeenagers represented 51.63% of 2025 cases, aligning with traditional timing for craniofacial growth modulation. Adult uptake will grow at 19.87% CAGR, fueled by employer-funded benefits and social-media normalization of orthodontic care in mid-career years. The invisible orthodontics market share among adults will keep climbing as virtual consultations reduce work-hour disruptions. Children (ages 7-12) form the smallest slice today but are expanding as interceptive protocols gain traction.
Adults exhibit higher compliance, averaging 21–22 wear hours daily versus adolescents’ 18–20, which trims cycle length. Teen-specific offerings with color-fade compliance indicators from Angelalign improved adolescent adherence by 25% in pilot studies. Such behavioural nudges will remain vital to sustaining outcomes and protecting brand reputation.
By End User:
Clinics Dominate Though DTC Models ScaleDental and orthodontic clinics contributed 62.13% of 2025 revenue, buttressed by insurer mandates for supervised treatment. Direct-to-consumer platforms are projected for a 19.7% CAGR, yet recent regulatory clamp-downs make pure mail-order models untenable in many U.S. states. The invisible orthodontics market size tied to clinic pathways therefore remains resilient, whereas DTC operators are pivoting toward hybrid storefront-plus-telehealth concepts.
Clinic channels realize higher per-case revenue—USD 4,000–6,000 because bundled diagnostics and refinements widen scope—contrasting with DTC’s USD 1,800–2,500 price band. Hospitals, though minor, expect steady growth as interdisciplinary care unites surgeons and orthodontists for complex skeletal corrections. Align’s Costco collaboration and Envista’s Spark manufacturing expansion illustrate how incumbents blend retail reach with in-office oversight to capture incremental volume.
By Sales Channel:
Dentist-Led Paths Still PrevailDentist-led in-office channels controlled 68.13% of 2025 sales since clinical trust and insurance requirements anchor them. Mail-order and online routes are projected for a 21.51% CAGR but will increasingly incorporate mandatory pre-scan visits to remain compliant, turning pure virtual workflows into hybrid ones. The invisible orthodontics market shows channel bifurcation: complex cases flow to supervised settings, while simple spacing or mild crowding remains addressable online.
Align’s warehouse-based scanning points and Envista’s clinician-training ecosystem signal a long-run convergence toward omnichannel delivery. As compliance frameworks toughen, dentist-led models gain further credibility, protecting quality outcomes and mitigating adverse-event risk reported by professional associations.
Geography Analysis
North America Invisible Orthodontics Market
North America generated 43.13% of 2025 revenue, buoyed by orthodontic penetration above 60% among adolescents and rising adult adoption in employer-funded plans. Align shipped over 642,000 cases globally in Q1 2025, and roughly 55% originated from this region, illustrating sustained maturity of invisibility-focused modalities. Recent publication of ADA standards for sequential aligners raises compliance costs for smaller labs, thus tilting supply toward well-capitalized manufacturers. Canada adds incremental growth through favorable insurance provisions, whereas U.S. cross-border dental tourism to Mexico boosts regional case volume.
APAC Invisible Orthodontics Market
Asia-Pacific is forecast to deliver a 21.81% CAGR, the highest globally, since orthodontic penetration remains under 5% in populous countries like China and India. Angelalign benefits from localized software and price points 30% below U.S. brands, growing its domestic share while also opening a U.S. facility to diversify revenue. Straumann noted brisk intraoral-scanner sales in China during Q3 2024, a leading indicator because digital scanning is the entry point for aligner treatment. Australia’s market, valued at USD 147.01 million in 2024, demonstrates 28.67% CAGR potential, reflecting both strong insurance reimbursement and cultural emphasis on cosmetic dentistry.
Europe, LATAM, Middle East and GCC Invisible Orthodontics Market
Europe holds a mid-teen share, with Germany, the United Kingdom, and France dominating volumes. Public-private insurance hybrids subsidize adolescent cases, and adult uptake rises as flexible spending mechanisms become common. Straumann’s divestiture of Dr.Smile in 2024 marked a pivot back toward professional channels amid MDR-driven compliance costs. Southern European markets like Spain and Italy show faster percentage growth from lower bases. Latin America and the Middle East each hold smaller slices but reveal pockets of strength: Brazil records roughly 1.4 million orthodontic case starts annually, and GCC nations sustain premium spending fueled by high disposable income.

Competitive Landscape
Align Technology retained a significant share of clear-aligner revenue in 2025, yet the invisible orthodontics market is loosening as core patents expire and rivals undercut on price. Align’s average selling price slid from USD 1,400 in 2020 to USD 1,240 in Q1 2025, evidence of intensifying competition. Its antitrust settlement of USD 27.5 million in 2024 and an ITC complaint against Angelalign in 2025 underscore a defensive legal stance. Envista trained more than 120,000 clinicians during 2024 and unveiled Spark on Demand, an in-practice production model that slashes logistical delays[3]Analyst Team, “Envista Holdings Corporation 2024 Annual Report,” Envista, envistaco.com. Straumann forged a software partnership with Smartee in October 2025 to cut treatment-setup time to 20 minutes, trading hardware differentiation for digital speed.
Smaller disruptors focus on niche propositions. LightForce offers 3D-printed ceramic brackets that promise 40% fewer appointments, while LuxCreo’s ActiveMemory polymers aim to halve stage counts by leveraging shape-recovery chemistry. Regulatory evolution favors firms with deep quality-management systems: the U.S. FDA’s 21 CFR Part 872 and EU MDR demand extensive post-market surveillance, raising entry barriers. Price-sensitive clinicians in China and South Korea still gravitate to generic mills, pushing global brands to highlight software predictability, materials transparency, and clinical support. The invisible orthodontics industry is thus pivoting from hardware to holistic treatment ecosystems, where integrated scanners, AI planning, and remote monitoring become decisive burnishers of brand equity.
Invisible Orthodontics Industry Leaders
Align Technology Inc.
SmileDirectClub
Dentsply Sirona
Solventum Corporation
Envista Holdings (Ormco)
- *Disclaimer: Major Players sorted in no particular order
Invisible Orthodontics Market Companies Covered in this Report
- Align Technology
- American Orthodontics
- Angelalign Technology Inc.
- Avinent Group
- Byte by Dentsply Sirona
- Candid Co.
- ClearPath Orthodontics
- DB Orthodontics
- Dentsply Sirona
- Envista
- G&H Orthodontics
- Great Lakes Dental Technologies
- Henry Schein
- Straumann Group
- SCHEU-DENTAL GmbH
- Smartee Denti-Technology
- SmileDirectClub
- Solventum Corporation
- Sunshine Smile GmbH (DrSmile)
- TP Orthodontics
- WonderSmile
- Zendura Dental

Recent Industry Developments in Invisible Orthodontics Market
- October 2025: LuxCreo and Angelalign announced a partnership to commercialize ActiveMemory shape-recovery polymers, targeting a 40–50% reduction in total aligner stages.
- October 2025: Straumann Group and Smartee Denti-Technology agreed to co-develop AI-based treatment-planning software that trims setup time from two hours to 20 minutes.


Invisible Orthodontics Market Report Scope and Research Methodology
Market Definition and Coverage
Our study defines the invisible orthodontics market as all value generated from clear aligners, ceramic braces, lingual braces, and nearly-invisible retainers that are prescribed, fabricated, or sold for the correction of malocclusion across dental clinics, hospitals, and emerging direct-to-consumer channels. These appliances rely on transparent polymers or tooth-colored brackets that reduce visual impact while delivering medically supervised tooth movement.
Scope exclusion: fixed metallic braces, conventional archwires, and ancillary chairside instruments sit outside our value pool.
Segments Covered in This Report
- By Product
- Clear Aligners
- Single-layer PETG
- Multi-layer TPU
- Ceramic Braces
- Poly-crystalline
- Mono-crystalline
- Lingual Braces
- CAD/CAM customised
- Standard brackets
- Retainers
- Vacuum-formed clear retainers
- Bonded retainers
- Clear Aligners
- By Material
- Thermoplastic Polyurethane (TPU)
- PETG
- Polycarbonate
- Others (PP, PVC, Co-polyesters)
- By Patient Group
- Adults
- Teenagers
- Children
- By End User
- Dental & Orthodontic Clinics
- Hospitals
- Direct-to-Consumer Platforms
- By Sales Channel
- Dentist-led in-office
- Mail-Order / Online
- Geography
- North America
- United States
- Canada
- Mexico
- Europe
- Germany
- United Kingdom
- France
- Italy
- Spain
- Rest of Europe
- Asia-Pacific
- China
- Japan
- India
- South Korea
- Australia
- Rest of Asia-Pacific
- Middle East & Africa
- GCC
- South Africa
- Rest of Middle East & Africa
- South America
- Brazil
- Argentina
- Rest of South America
- North America
Data Sources, Market Sizing, and Validation
Primary Research
Orthodontists, general dentists, polymer sheet suppliers, and CAD-CAM software integrators from North America, Europe, and Asia-Pacific were interviewed or surveyed. These discussions clarified aligner throughput per chair, real-world case acceptance rates, regional ASP dispersion, and adoption intentions for in-office 3-D printing, allowing us to validate desk findings and plug data gaps before triangulating the model.
Desk Research
We began by mapping global disease burden and treatment trends using public datasets such as WHO oral-health statistics, the American Association of Orthodontists patient census, Eurostat dental expenditure files, and UN Comtrade import codes for HS 902121 and HS 902129, which capture aligner kits and ceramic brackets. Company 10-Ks, investor decks, and clinical journals (Journal of Orthodontics, Angle Orthodontist) helped benchmark average case starts and price corridors. Paid repositories that Mordor analysts access, notably D&B Hoovers for company revenues and Questel for patent velocity around thermo-plastic sheets, rounded out competitive and innovation signals. This list illustrates rather than exhausts the secondary sources we reviewed.
Market-Sizing & Forecasting
A top-down prevalence-to-demand construct starts with country-level malocclusion incidence, filters it through treatment penetration ratios and insurance cover, and multiplies the resulting procedure pool by blended ASPs. Select bottom-up checks, clinic case roll-ups, shipment tallies, and sampled material cost stacks are then layered to reconcile totals. Key model drivers include: - annual new case starts reported by the AAO and FDI - adult-to-teen ratio shifts that sway ASPs - clear-aligner share within removable braces - scanner and 3-D printer installed base signaling capacity - reimbursement caps that affect out-of-pocket spend. Multivariate regression combined with scenario analysis projects these variables to 2030. When bottom-up inputs diverge beyond +/-7 %, they are adjusted toward the more documented data stream.
Data Validation & Update Cycle
Outputs undergo variance screens versus shipment, patent, and revenue signals; anomalies trigger analyst re-checks and expert callbacks. Reports refresh yearly, with interim updates after material events such as regulatory changes or major product launches, ensuring clients receive the latest vetted view.
How Mordor Intelligence's Invisible Orthodontics Market Size Compares to Other Published Estimates
Published estimates frequently diverge because researchers vary product mix, geographic roll-ups, ASP assumptions, and refresh cadence. Our disciplined scope selection and dual-lens modeling reduce these drifts and give decision-makers a dependable anchor.
The comparison shows that when scope gaps, aggressive growth factors, or single-segment focus creep in, market values shift noticeably. Mordor's balanced input mix, annual refresh, and transparent variable logic therefore provide the most reproducible baseline for strategic planning.
Benchmark comparison
| Market Size | Anonymized source | Primary gap driver |
|---|---|---|
| USD 7.72 B (2025) | Mordor Intelligence | - |
| USD 7.50 B (2024) | Global Consultancy A | U.S. results scaled globally and limited end-user granularity |
| USD 7.94 B (2024) | Industry Association B | Counts clear aligners only, omitting ceramic and lingual braces |
| USD 8.39 B (2025) | Trade Journal C | Applies aggressive ASP compression and unchecked 28 % CAGR |
The comparison shows that when scope gaps, aggressive growth factors, or single-segment focus creep in, market values shift noticeably. Mordor's balanced input mix, annual refresh, and transparent variable logic therefore provide the most reproducible baseline for strategic planning.


Key Questions Answered in the Report
What was the value of the invisible orthodontics market in 2026?
The invisible orthodontics market size reached USD 8.69 billion in 2026.
How fast is Asia-Pacific growing in the invisible orthodontics market?
Asia-Pacific is projected to register a 21.81% CAGR between 2026 and 2031.
Which product led revenue in 2025?
Clear aligners held 70.56% of 2025 revenue within the invisible orthodontics market.
What role did clinics play in distribution in 2025?
Dental and orthodontic clinics generated 62.13% of 2025 revenue, retaining leadership as insurer rules favor supervised care.
Which key restraint limits adoption in emerging markets?
High treatment costs paired with limited reimbursement remain the most significant barrier to mass adoption in lower-income regions.
Page last updated on:


