Market Overview
| Study Period | 2020 - 2031 |
|---|---|
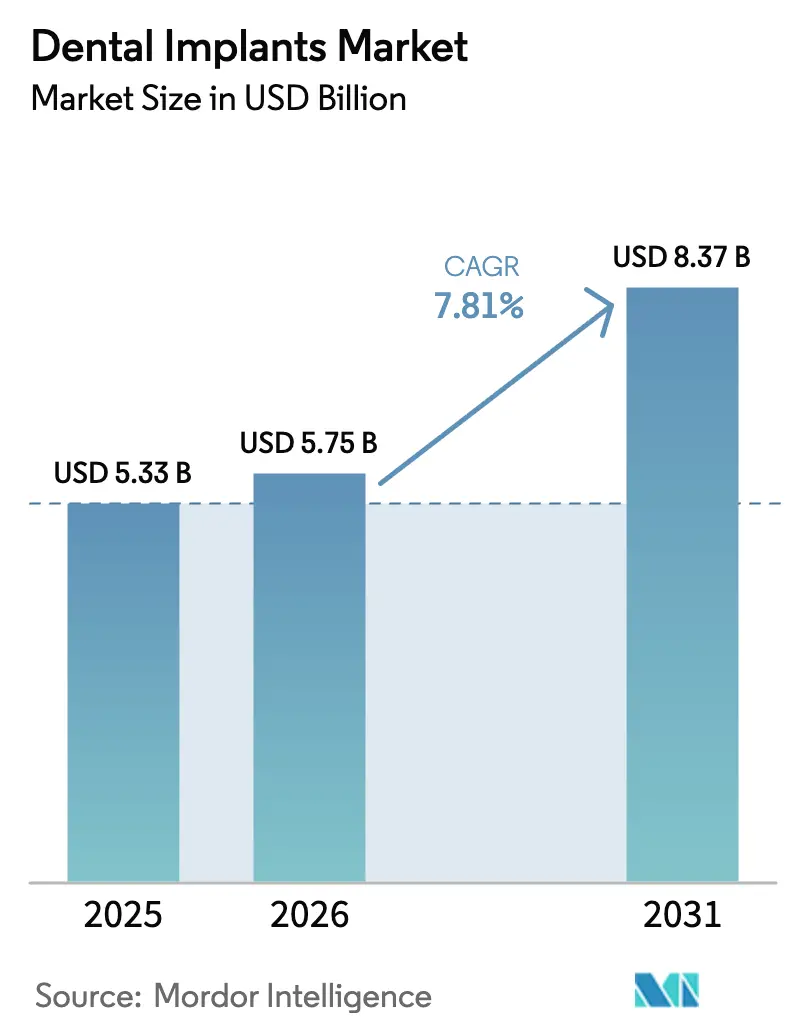
| Market Size (2026) | USD 5.75 Billion |
| Market Size (2031) | USD 8.37 Billion |
| Growth Rate (2026 - 2031) | 7.81% CAGR |
| Fastest Growing Market | Asia Pacific |
| Largest Market | Europe |
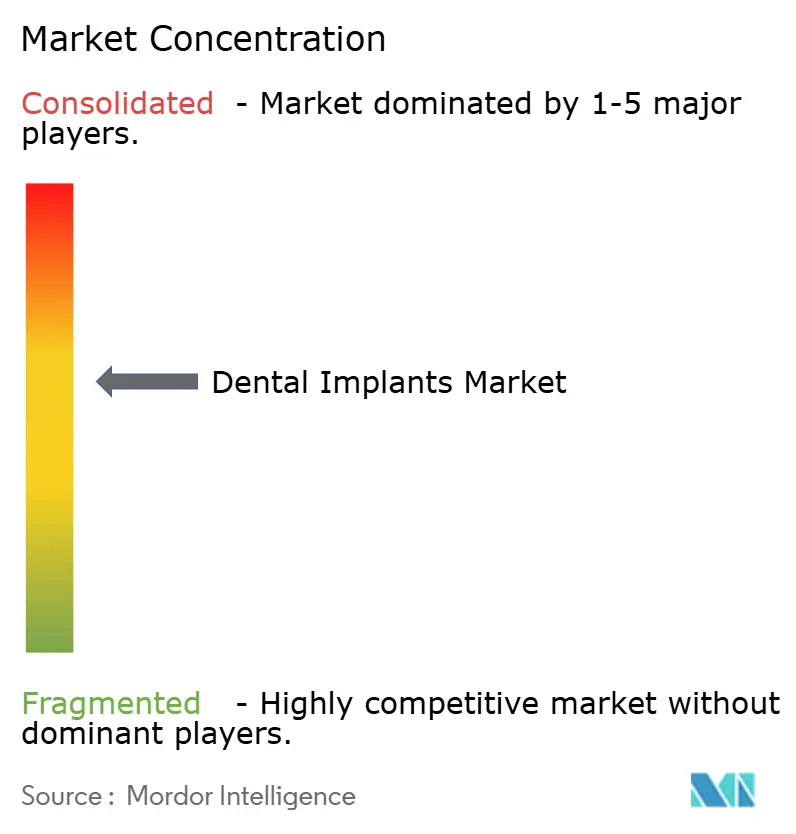
| Market Concentration | Medium |
Major Players *Disclaimer: Major Players sorted in no particular order Image © Mordor Intelligence. Reuse requires attribution under CC BY 4.0. | |
Dental Implants Market Analysis by Mordor Intelligence
The Dental Implants Market size is expected to grow from USD 5.33 billion in 2025 to USD 5.75 billion in 2026 and is forecast to reach USD 8.37 billion by 2031 at 7.81% CAGR over 2026-2031.
Growing life expectancy in the United States, Western Europe, Japan, and South Korea is expanding the pool of edentulous seniors, while rapid income growth in China and India is lifting discretionary spending on fixed restorative care, positioning the dental implants market for secular expansion. Digital dentistry, specifically CAD/CAM, intraoral scanning, and 3-D printing, continues to shrink chair time, lower technical barriers for general dentists, and reduce overall treatment cost, further widening patient access in both mature and emerging economies. Partial reimbursement of implant procedures through statutory insurance schemes in Germany, France, and South Korea has begun to reframe implants from elective offerings to a standard of care. Competitive differentiation now hinges on integrated digital ecosystems, evidence-backed surface technologies, and robust supply-chain resilience as titanium prices trend higher.
Key Report Takeaways
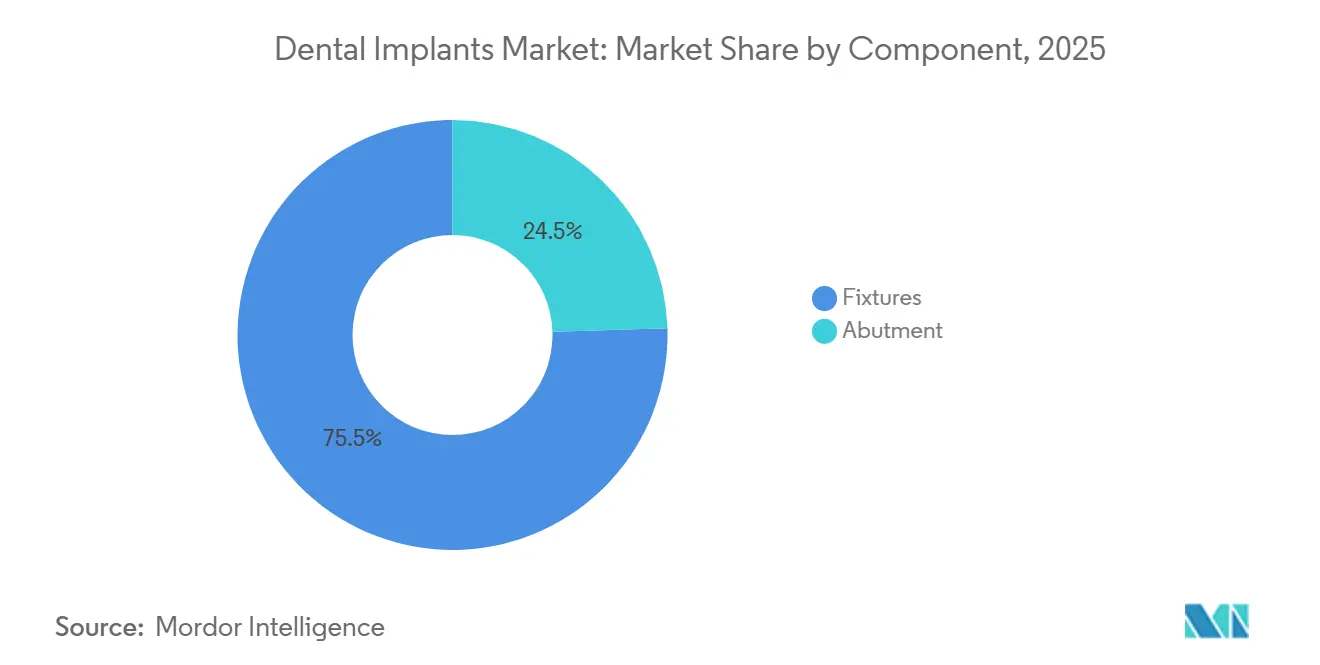
- By component, fixtures held 75.55% of dental implants market share in 2025, whereas abutments are expected to post the fastest 9.25% CAGR to 2031.
- By material, titanium accounted for 85.53% of the dental implants market size in 2025; zirconium implants are forecast to grow at a 10.85% CAGR through 2031.
- By design, tapered fixtures led with 69.63% revenue share in 2025; parallel-walled implants are anticipated to advance at an 8.87% CAGR to 2031.
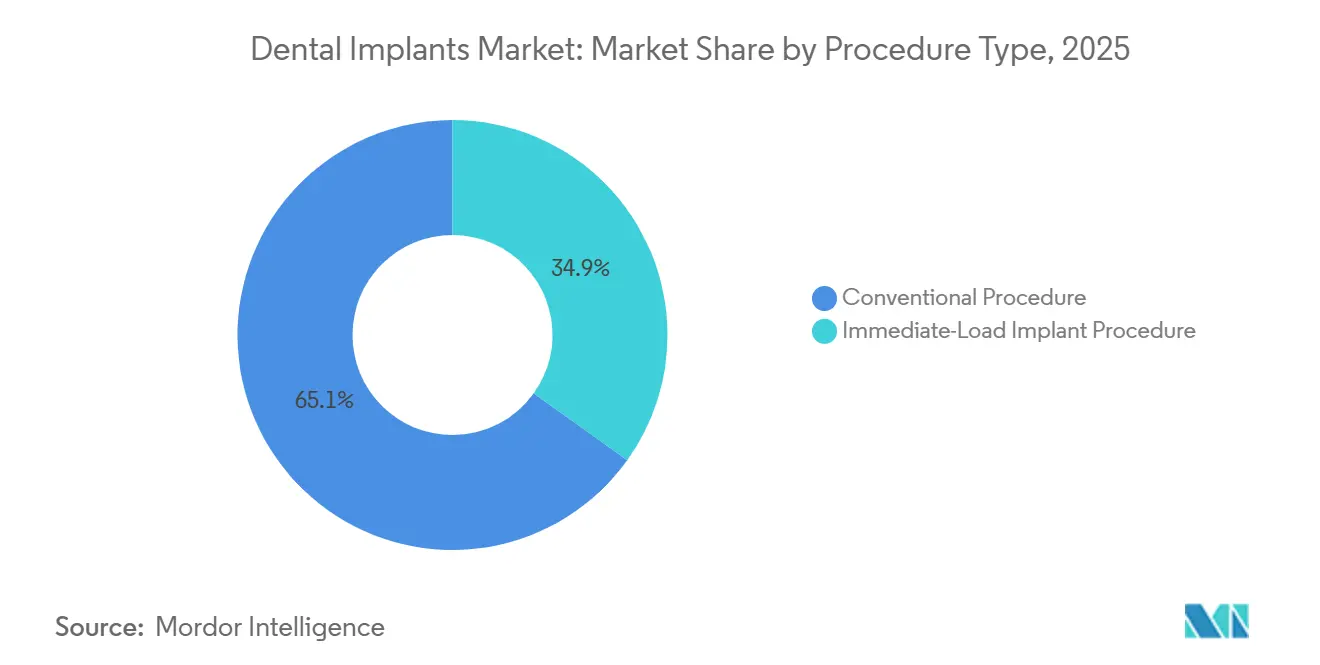
- By procedure type, conventional two-stage protocols retained 65.13% of demand in 2025, while immediate-load procedures are expanding at an 11.7% CAGR through 2031.
- By end user, dental hospitals and clinics captured 55.13% share in 2025; dental laboratories record the highest 9.7% CAGR forecast to 2031.
- By geography, Europe represented 35.13% of the dental implants market in 2025; Asia-Pacific is projected to grow at a 9.91% CAGR through 2031.
Note: Market size and forecast figures in this report are generated using Mordor Intelligence’s proprietary estimation framework, updated with the latest available data and insights as of January 2026.
Global Dental Implants Market Trends and Insights
Drivers Impact Analysis*
| Driver | (~) % Impact on CAGR Forecast | Geographic Relevance | Impact Timeline |
|---|---|---|---|
| Aging-driven edentulism and higher disposable incomes | +2.1% | Global, with concentration in OECD and upper-middle-income Asia-Pacific | Medium term (2-4 years) |
| Growing adoption of digital dentistry workflows (CAD/CAM, 3-D printing) | +1.8% | North America, Europe, urban Asia-Pacific | Short term (≤ 2 years) |
| Expansion of national implant-reimbursement schemes | +1.5% | Europe (Germany, France), South Korea, pilot programs in China | Medium term (2-4 years) |
| Consolidation of Dental Service Organizations enabling bulk procurement | +1.2% | North America, with early adoption in U.K. and Australia | Medium term (2-4 years) |
| AI-guided surgical planning cutting failure rates & chair-time | +1.3% | North America, Western Europe, Japan | Short term (≤ 2 years) |
| Sustainability mandates accelerating shift to recyclable & bio-sourced packaging | +0.6% | Europe (EU directives), California, emerging in Asia-Pacific | Long term (≥ 4 years) |
| Source: Mordor Intelligence | |||


Aging-Driven Edentulism and Higher Disposable Incomes
Severe tooth loss affects 349 million individuals aged 60+ worldwide, and the absolute number is rising as longevity increases in almost every region. While preventive dentistry has preserved more natural dentition in high-income countries, demographic momentum means the total base of edentulous seniors is still expanding. Simultaneously, China’s real disposable income grew 6.3% in 2024, and India’s IMF-tracked per-capita GDP crossed USD 2,500, both developments that elevate affordability for multi-unit restorations[1]National Bureau of Statistics of China, “Statistical Communiqué 2024,” stats.gov.cn. Reimbursement reforms in Germany and France now cover 60% of implant costs for full-arch cases, cutting patient co-pays and accelerating adoption. South Korea’s extension of implant benefits to seniors drove a 34% procedure surge in 2024. The combined effect is a sustained demand driver that is relatively insulated from economic fluctuations because tooth replacement restores basic mastication and speech, not merely cosmetic appeal.
Growing Adoption of Digital Dentistry Workflows (CAD/CAM, 3-D Printing)
Digital workflows compress the implant cycle from diagnosis to definitive restoration by enabling accurate virtual planning and same-day prosthetics. Intraoral scanners replace conventional impressions, reducing cross-contamination risk and cutting remakes, while CAD software automates abutment design and surgical-guide fabrication in minutes. Dentsply Sirona reported a 23% jump in digital equipment sales during fiscal 2024, attributing most growth to implant-focused users. Updated FDA guidance published in October 2024 clarified sterility validation for 3-D-printed dental devices, streamlining approvals[3]U.S. Food and Drug Administration, “Guidance for 3-D-Printed Dental Devices 2024,” fda.gov. General dentists can therefore adopt implants without outsourcing planning, expanding the dental implants market to primary care settings. Compliance with ISO 13485 and ISO 20795-1 is now a baseline, ensuring traceability across digital production. As more DSOs adopt centralized milling and printing, economies of scale drive down unit costs, further boosting penetration.
Expansion of National Implant-Reimbursement Schemes
Germany began subsidizing 60% of implant costs for edentulous patients in January 2024, effectively removing the biggest financial barrier for 1.2 million eligible citizens[2]GKV-Spitzenverband, “Statutory Implant Coverage 2024,” gkv-spitzenverband.de. France capped patient copay at EUR 500 per implant for low-income groups, and South Korea’s National Health Insurance Service extended coverage to adults aged 65+, triggering double-digit annual growth. Pilot city-level programs in Beijing and Shanghai are evaluating municipal reimbursement ahead of a potential national rollout. Although many schemes exclude anterior aesthetic indications, the policy momentum validates implants as a medically necessary therapy rather than a luxury procedure. Manufacturers now compete on long-term survival data and total cost of ownership, not branding alone, while payers demand evidence-based pricing, catalyzing value-based procurement.
Consolidation of Dental Service Organizations (DSOs) Enabling Bulk Procurement
North American DSOs expanded affiliated clinics to nearly 30% of all U.S. dental offices in 2025, up from 18% in 2020, and many now operate centralized labs capable of producing 50,000+ restorations annually. Bulk purchasing reduces implant fixture cost by 15-20%, squeezing mid-tier manufacturers that cannot match rebates offered by integrated giants. Similar aggregation is emerging in the U.K. and Australia, where private-equity-backed chains leverage purchasing scale. Suppliers with broad portfolios, chairside scanners, milling units, and aligner lines are preferred because DSOs favor one-stop procurement. This trend accelerates product standardization and strengthens vendors able to support enterprise-wide training and cloud-based case management.
Restraints Impact Analysis*
| Restraint | (~) % Impact on CAGR Forecast | Geographic Relevance | Impact Timeline |
|---|---|---|---|
| High procedure cost & limited insurance outside OECD | -1.4% | South America, Middle East & Africa, rural Asia-Pacific | Long term (≥ 4 years) |
| Shortage of trained implantologists in tier-2/3 cities | -0.8% | India, China, Southeast Asia, sub-Saharan Africa | Medium term (2-4 years) |
| Looming titanium supply constraints from aerospace super-cycle | -0.9% | Global, with acute pressure in North America and Europe | Medium term (2-4 years) |
| Cyber-risk exposure of cloud-based implant workflow platforms | -0.5% | North America, Europe, digitally advanced practices globally | Short term (≤ 2 years) |
| Source: Mordor Intelligence | |||
High Procedure Cost and Limited Insurance Outside OECD
Single-unit restorations cost USD 1,500 in India and USD 4,500 in the United States, with full-arch therapies exceeding annual household incomes in Brazil, Argentina, and Nigeria. Insurance penetration for dental services remains below 15% in Latin America and sub-Saharan Africa, and most plans classify implants as cosmetic. Financing schemes offered by DSO networks and private lenders carry interest rates above 20%, deterring uptake among price-sensitive patients. Import tariffs on titanium and zirconium raise landed costs 10-15% in protective markets such as Argentina and South Africa. Affordability thus caps the dental implants market in demographically favorable yet low-income geographies.
Shortage of Trained Implantologists in Tier-2 and Tier-3 Cities
Large urban centers have dense networks of specialists, but smaller cities lack training infrastructure. In India, only 1 implantologist exists per 125,000 residents outside top-tier metros, forcing patients to travel long distances, which delays care and raises indirect cost. China launched a “Healthy China 2035” initiative that includes a target ratio of one implant-capable dentist per 50,000 citizens, yet progress is slow due to limited fellowship programs and faculty shortages. Emerging e-learning platforms and mobile surgical vans are bridging gaps, but widespread competency remains a mid-term hurdle.
*Our forecasts treat driver/restraint impacts as directional, not additive. The impact forecasts reflect baseline growth, mix effects, and variable interactions.
Segment Analysis
By Component: Abutment Fabrication Industrializes as Digital Labs Scale
Fixtures dominated 75.55% of the dental implants market in 2025, underscoring their essential role as osseointegrating anchors, but abutments are projected to outpace overall growth at a 9.25% CAGR through 2031 as centralized milling drives mass customization. The dental implants market size allocated to abutments is expanding because labs now produce patient-specific milled components in hours, reducing reliance on stock parts and allowing screw-retained designs that minimize cement-related peri-implantitis. Endosteal fixtures remain the default choice, while sub-periosteal constructs stay niche. Stock abutment share keeps falling as CAD/CAM processes reach price parity and deliver superior emergence profiles.
Digital labs leverage five-axis mills and selective-laser-melting printers to batch abutment runs, achieving tolerances within ±10 µm while cutting per-unit cost by 30%. Straumann’s Variobase line illustrates ecosystem stickiness because compatible platforms encourage repeat purchases of matching analogs, screws, and prosthetic components. ISO 14801 fatigue testing and ISO 10993 biocompatibility remain gating standards, yet high-volume labs routinely exceed them, underscoring industrial-grade quality control. As DSOs dictate procurement, suppliers that bundle implant, abutment, and digital workflows win contracts, reinforcing vertical integration.

By Material: Zirconium Gains as Aesthetic Demands Rise in Anterior Zones
Titanium continued to command 85.53% share in 2025, reflecting its robust osseointegration profile and cost efficiency, while zirconium implants, though smaller, are forecast to grow at a 10.85% CAGR through 2031. The dental implants market increasingly segments by gingival biotype; thin tissues reveal titanium’s gray hue, but zirconium’s light color avoids esthetic show-through. In three-year data, Straumann PURE ceramic implants posted a 96.7% survival rate, closing historical performance gaps with metal fixtures.
Manufacturing hurdles persist because zirconium requires hot-isostatic pressing and exacting machining, which raise unit cost 40-60% above titanium. Yet price sensitivity is less pronounced in maxillary anterior indications, where patient willingness to pay for esthetics is high. ASTM F2393 and ISO 13356 standards guarantee phase-stability and mechanical strength, and advances in yttria-stabilized formulations reduce brittleness. If zirconium feedstock pricing moderates and printing techniques mature, adoption will broaden into short-span bridges and select posterior cases.
By Design: Parallel-Walled Implants Address Narrow-Ridge Anatomy
Tapered implants held 69.63% share in 2025 because their macro-geometry delivers primary stability essential for immediate-load protocols. However, parallel-walled implants are recording an 8.87% CAGR as clinicians tackle narrow inter-radicular spaces and sites with thin buccal plates. The dental implants market size for parallel designs is rising fastest in lower incisors and upper premolars, where root proximity demands slimmer profiles. NobelParallel’s 2024 upgrade, featuring a re-engineered thread pitch, yielded 15% higher bone-implant contact in histomorphometric trials, validating the design approach.
Hybrid geometries now mix apical taper for insertion torque with coronal parallelism to accommodate platform-switch abutments, allowing manufacturers to rationalize SKU counts while covering diverse anatomies. Surface treatments, from sand-blast acid-etch to laser-textured nano-topographies, further differentiate products. ISO 14801 cyclic-fatigue benchmarks remain the litmus test, requiring endurance beyond five million loading cycles, a threshold that top performers comfortably exceed.
By Procedure Type: Immediate-Load Protocols Gain as AI Reduces Failure Risk
Conventional two-stage surgeries still accounted for 65.13% of procedures in 2025, but immediate-load protocols are growing at 11.7% CAGR thanks to AI-optimized torque values and carefully managed occlusion. The dental implants market share held by immediate loading is rising in full-arch restorations, where cross-arch splinting distributes functional stress. Straumann BLX implants achieved a 98.2% survival rate in five-year data, dispelling clinician concerns over micromotion-induced failure.
Reimbursement policies increasingly reimburse same-day solutions because they cut chair visits. However, immediate loading remains contraindicated in Type IV bone, heavy bruxism, or uncontrolled diabetes, preserving a sizeable base for conventional healing. Standardization through ISO 14801 and ASTM F1854 fatigue tests under functional load assures performance parity, while digital temps milled within one hour enhance patient comfort and esthetic acceptance.
By End User: Dental Laboratories Centralize as DSO Networks Industrialize Fabrication
Dental hospitals and clinics attracted 55.13% of spend in 2025, but centralized laboratories recorded a 9.7% CAGR and will approach parity by 2031. DSOs like Heartland Dental route restorative design to regional hubs equipped with 24-hour milling and 3-D printing, enabling practitioners to offer implants without chairside fabrication. The dental implants market benefits from this industrialization because labs bundle surgical guides, custom abutments, and provisional crowns, improving consistency and reducing failure.
ISO 13485 certification and EU MDR traceability obligations push smaller labs to partner with larger centers or exit. Vertically integrated suppliers—chiefly Dentsply Sirona and Straumann—stand to gain because their equipment, software, and implants align seamlessly, locking practices into proprietary ecosystems. Academic institutes, although minor commercially, remain innovation test beds for bioactive coatings and computational models simulating 10-year fatigue, providing pipelines that commercial players can license.
Geography Analysis
Europe retained 35.13% of the dental implants market in 2025 as reimbursement in Germany and France expanded coverage, yet growth is plateauing because urban penetration approaches maturity. Germany’s 2024 statutory reforms enlarged eligibility, but most incremental cases involve elderly patients with comorbidities, complicating surgery. France’s fragmented practice ownership slows DSO penetration, preserving loyalty to premium brands but limiting volume discounts. Spain benefits from dental tourism by U.K. residents who seek lower priced implants, cushioning demand despite domestic wage stagnation. The United Kingdom, where NHS omits implant coverage, remains heavily private-pay, restricting uptake mainly to affluent cohorts; currency fluctuations post-Brexit have further inflated import costs. EU MDR compliance costs have nudged smaller suppliers toward mergers or pull-out, subtly tightening competitive breadth.
Asia-Pacific is growing at a 9.91% CAGR and will surpass Europe late in the forecast. China’s market is pivoting from import dependence to local production, with Hangzhou Jiace and Zhuhai Livzon undercutting European imports by as much as 50%. Domestic share rose sharply after Beijing’s “Made in China 2025” priority designation for advanced medical devices granted tax incentives and accelerated NMPA reviews. India adds roughly 550,000 new implant units yearly, propelled by medical tourists and the rise of multi-city groups such as Clove Dental, which standardize protocols and leverage digital marketing. Japan is largely saturated but maintains premium pricing due to stringent Shonin approval and cultural preference for domestic brands like GC. South Korea’s insurance subsidy for seniors triggered a 34% procedure spike in 2024, and local giants Osstem and Dentium added capacity that now exceeds 12 million units annually. Australia’s TGA streamlined approvals in 2024, expediting novel coatings and designs, while Thailand and Malaysia serve regional medical tourists seeking 60-70% discounts compared with Western clinics.
North America remains the highest value per-unit region, with average surgical and prosthetic fees topping USD 4,500. Aggressive DSO expansion is transforming procurement; Heartland Dental, Aspen Dental, and Pacific Dental operate labs that collectively produce more than 120,000 implant restorations per year, pressuring margins for manufacturers unable to furnish integrated scanners and CAD/CAM mills. The FDA’s renewed emphasis on real-world evidence and post-market surveillance raises documentation costs but also erects barriers against low-service entrants, defending incumbent positions. Canada maintains a private-pay structure, and rising cross-border traffic to Mexican border towns underscores persistent affordability gaps. South America continues to lag because of currency volatility and low insurance coverage; Brazil’s real depreciation raised implant imports by 18% in local terms, dampening demand. Middle East & Africa remains emergent; GCC countries invest in dental tourism complexes, but penetration is low outside urban hubs and tariff regimes inflate titanium and zirconium costs.


Competitive Landscape
The dental implants market shows moderate concentration. Straumann, Nobel Biocare (Envista), and Dentsply Sirona dominate premium segments, while cost-focused Asian brands such as Osstem, Dentium, and MegaGen scale up the mid-tier. Straumann uses vertical integration, combining ClearCorrect aligners, digital scanners, and the Falcon navigation system to lock clinicians into its workflow. Nobel Biocare leverages decades of longitudinal survival data and esthetic-focused componentry. Dentsply Sirona capitalizes on the global installed base of CEREC mills and Primescan scanners to cross-sell implants.
South Korean leaders are expanding rapidly: Osstem opened a 150,000-square-foot plant in July 2025, boosting total annual output to 12 million fixtures and abutments. Strategic partnerships such as ZimVie’s 2025 distribution deal with Osstem aim to penetrate China’s estimated 10 million-unit annual demand. Chinese entrants price fixtures 40-60% below imported brands, leveraging domestic titanium supply and lower labor cost. M&A activity targets digital-workflow assets as players seek full-stack offerings; Straumann acquired AI startup cephX in 2025, while Nobel Biocare licensed Carbon’s lattice-structured provisional technology. Patent filings concentrate on hydrophilic surfaces that accelerate osseointegration and on bio-active peptides that modulate inflammatory response.
Competitive strategy revolves around total cost, digital integration, and clinical evidence. DSOs award multi-year contracts on bundled offerings covering implants, scanners, milling units, and software, pushing commoditized players to the value tier. Meanwhile, premium firms defend ASPs with peer-reviewed five-year survival data and esthetic outcomes. Sustainability metrics, cybersecurity compliance, and MDR documentation now figure prominently in tender evaluations. The bifurcation deepens: premium suppliers invest in R&D and AI, while value players offer basic yet reliable fixtures to cost-constrained markets.
Dental Implants Industry Leaders
Institut Straumann AG
Envista Holdings (Nobel Biocare)
Dentsply Sirona Inc.
Osstem Implant Co., Ltd.
ZimVie Inc
- *Disclaimer: Major Players sorted in no particular order

Recent Industry Developments
- July 2025: Osstem Implant inaugurated a USD 150 million Busan plant, raising capacity to 12 million implants per year and embedding ISO 13485-compliant automated inspection.
- July 2025: ZimVie signed a strategic distribution pact with Osstem to broaden reach in China’s greater than 10 million unit annual market.


Research Methodology Framework and Report Scope
Market Definitions and Key Coverage
Our study defines the global dental implants market as the annual revenue generated from newly manufactured endosteal, sub-periosteal, zygomatic, and trans-osteal fixtures, abutments, and associated surgical kits that are placed to replace one or more missing teeth. This working scope, adopted by Mordor Intelligence analysts, tracks factory gate pricing of titanium and zirconia systems supplied to dental hospitals, clinics, group practices, and laboratories worldwide.
Scope Exclusion: Repair services, re-used implants, allograft anchors, and removable prosthetics without fixture placement are excluded.
Segmentation Overview
- By Component
- Fixture
- Endosteal Implants
- Sub-periosteal Implants
- Trans-osteal Implants
- Intra-mucosal Implants
- Abutment
- Fixture
- By Material
- Titanium Implants
- Zirconium Implants
- By Design
- Tapered Implants
- Parallel-Walled Implants
- By Procedure Type
- Immediate-Load Procedure
- Conventional Procedure
- By End User
- Dental Hospitals & Clinics
- Dental Laboratories
- Academic & Research Institutes
- Geography
- North America
- United States
- Canada
- Mexico
- Europe
- Germany
- United Kingdom
- France
- Italy
- Spain
- Rest of Europe
- Asia-Pacific
- China
- Japan
- India
- Australia
- South Korea
- Rest of Asia-Pacific
- Middle East & Africa
- GCC
- South Africa
- Rest of Middle East & Africa
- South America
- Brazil
- Argentina
- Rest of South America
- North America
Detailed Research Methodology and Data Validation
Primary Research
Interviews were held with maxillofacial surgeons, prosthodontists, purchasing managers, and distributors across North America, Europe, China, India, and Brazil. Discussions clarified procedure volumes, adoption of immediate-load protocols, price tiers, and likely zirconia penetration, allowing us to adjust desk findings and close data gaps before final modeling.
Desk Research
We began with publicly available datasets such as the WHO Oral Health Database, United Nations World Population Prospects, the US CDC NHANES edentulism series, Eurostat outpatient procedure files, and customs shipment data from Volza. Company 10-Ks, investor decks, and major dental association white papers provided average selling prices, while patent analytics from Questel highlighted emerging surface treatments. Regional reimbursement schedules and import tariffs were captured through Dow Jones Factiva news searches, which are then used to cross-check price corridors. The sources listed here illustrate, not exhaust, the pool we mined to ground initial estimates in observable facts.
Market-Sizing & Forecasting
A top-down construct converts country-level implant procedures, drawn from hospital discharge and insurance claims, into value using blended average selling prices. Results are corroborated with selective bottom-up roll-ups of leading supplier revenues and channel checks, and then tuned. Key variables include adult edentulism prevalence, number of practicing implantologists, average fixtures per patient, mid-tier titanium ASP shifts, regulatory price caps, and elective spending indices. Multivariate regression forecasts each driver through 2030, with scenario analysis overlay for reimbursement reforms. Where bottom-up inputs are sparse in smaller economies, regional averages are imputed and flagged for re-validation.
Data Validation & Update Cycle
Outputs pass three layers of variant and anomaly checks, followed by peer review and a senior sign-off. We refresh every twelve months, yet trigger interim updates when events such as raw-material surges or regulatory price ceilings alter key assumptions. A final voice-call walkthrough ensures clients receive the latest calibrated view.
Why Mordor's Dental Implants Baseline Earns Trust
Published figures often diverge because firms pick different product bundles, price bases, and refresh rhythms. By anchoring on procedure volumes and factory pricing, Mordor keeps the lens narrow enough to stay comparable yet broad enough to remain decision-ready.
Key gap drivers include some publishers folding crowns or prosthetic bridges into the same line item, others applying list rather than transacted prices, and a few using five-year-old input series that miss recent Asia-Pacific volume spikes. Our annual refresh and cross-price validation temper both over-optimism and undue conservatism.
Benchmark comparison
| Market Size | Anonymized source | Primary gap driver |
|---|---|---|
| USD 5.75 B | Mordor Intelligence | - |
| USD 7.13 B | Global Consultancy A | Uses list prices and omits discount tiers, inflating value |
| USD 5.11 B | Industry Portal B | Excludes zygomatic and trans-osteal systems, compressing totals |
| USD 12.57 B | Regional Consultancy C | Combines prosthetics revenue with implants, expanding scope |
These comparisons show that Mordor's disciplined scope selection, annual refresh cadence, and variable-level cross-checks deliver a balanced baseline that clients can trace, reproduce, and confidently build strategic plans upon.


Key Questions Answered in the Report
How large is the dental implants market in 2026?
The dental implants market size stands at USD 5.75 billion in 2026 with a 7.81% CAGR outlook through 2031.
Which component grows fastest within global implants?
Custom abutments exhibit the highest 9.25% CAGR as digital labs centralize milling and shorten turnaround.
Why are zirconium implants gaining traction?
Zirconium's tooth-colored appearance eliminates gray shine-through in thin gingiva, driving 10.85% CAGR mainly in anterior restorations.
What region will lead future growth?
Asia-Pacific is projected to expand at a 9.91% CAGR through 2031 on middle-class expansion and local manufacturing scale-up.
How are DSOs influencing procurement?
DSOs bulk-buy implants, scanners, and mills, securing 15-20% discounts and favoring suppliers with integrated digital portfolios.
Are titanium supply constraints a real risk?
Yes, aerospace demand and Chinese export controls have pushed Grade 5 titanium spot prices up 17% YoY, pressuring smaller manufacturers.
Page last updated on:


