Market Overview
| Study Period | 2020 - 2031 |
|---|---|
| Forecast Data Period | 2026 - 2031 |
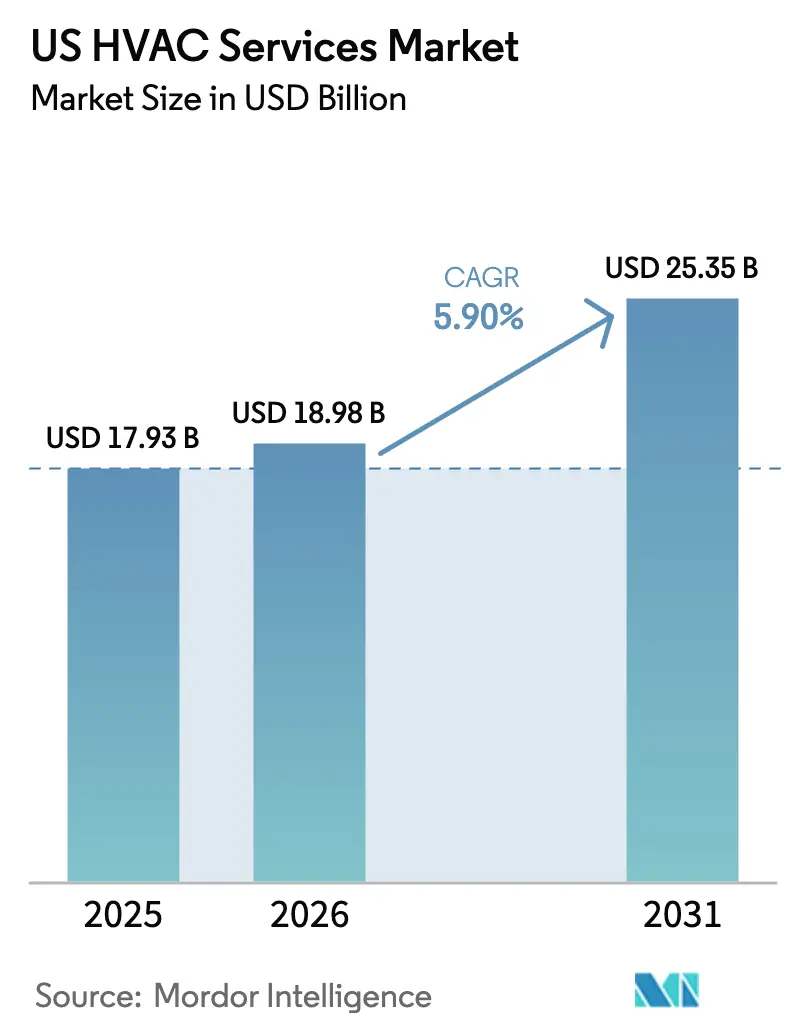
| Base Year Market Size (2025) | USD 17.93 Billion |
| Market Size (2026) | USD 18.98 Billion |
| Market Size (2031) | USD 25.35 Billion |
| Growth Rate (2026 - 2031) | 5.90% CAGR |
| Market Concentration | Medium |
Major Players *Disclaimer: Major Players sorted in no particular order Image © Mordor Intelligence. Reuse requires attribution under CC BY 4.0. | |
US HVAC Services Market Analysis by Mordor Intelligence
The US HVAC Services Market size was valued at USD 17.93 billion in 2025 and is estimated to grow from USD 18.98 billion in 2026 to reach USD 25.35 billion by 2031, at a CAGR of 5.90% during the forecast period (2026-2031).
The expansion reflects persistent demand for replacement of aging equipment, a robust construction pipeline, and sustained policy incentives that lower the cost of energy-efficient upgrades. Construction starts rose 9.9% month-over-month in April 2025, reinforcing a solid flow of installation contracts across commercial, residential, and industrial projects. Federal rebates under the Inflation Reduction Act, paired with state-level incentives, continue to stimulate homeowner retrofits and heat-pump adoption. Parallel shifts toward smart building controls and lower-GWP refrigerants are creating compliance-driven service opportunities that lift the recurring revenue mix. At the same time, a persistent shortage of skilled technicians tightens labor supply, lifts wages, and pressures small contractors, a dynamic that supports consolidation plays by capital-rich operators.
Key Report Takeaways
- By end user: The residential segment held 52% of the US HVAC services market share in 2025, while the industrial segment is forecast to expand at a 7.9% CAGR through 2031.
- By service category: Preventive maintenance contracts captured 39% revenue in 2025; energy-management services are projected to post the fastest growth at an 8.2% CAGR through 2031.
- By system type: Cooling/air-conditioning services accounted for 41% of the US HVAC services market size in 2025; building-management and automation services are set to increase at a 9.1% CAGR to 2031.
- By contract model: Recurring service agreements commanded 55% revenue in 2025 and are anticipated to grow at an 8.3% CAGR, underscoring the shift toward predictable OPEX budgeting.
- By region: The South region led with 38% share of the US HVAC services market size in 2025 and is advancing at a 7.2% CAGR through 2031, supported by population growth and rising cooling-degree days.
Note: Market size and forecast figures in this report are generated using Mordor Intelligence’s proprietary estimation framework, updated with the latest available data and insights as of January 2026.
US HVAC Services Market Trends and Insights
Drivers Impact Analysis*
| Driver | (~) % Impact on CAGR Forecast | Geographic Relevance | Impact Timeline |
|---|---|---|---|
| Aging Building Stock in OECD Markets Requiring Upgrades | +1.2% | United States, concentrated in Northeast and Midwest legacy metros | Medium term (2-4 years) |
| Mandatory Refrigerant Phase-Downs Driving Retrofit Demand | +1.5% | United States, with accelerated compliance in California and Northeast states | Short term (≤ 2 years) |
| Expansion of Hyperscale Data-Center Build-Outs | +1.3% | United States, clustered in Virginia, Texas, Arizona, and Oregon | Medium term (2-4 years) |
| HVAC-as-a-Service Contracts Unlocking Annuity Revenues | +0.8% | United States, early adoption in commercial real estate and healthcare | Long term (≥ 4 years) |
| Prefabricated Modular Retrofit Solutions Accelerating Project Timelines | +0.6% | United States, gaining traction in urban high-rise and institutional sectors | Medium term (2-4 years) |
| Utility-Backed Predictive-Maintenance Subscriptions Boosting Service Revenues | +0.5% | United States, pilot programs in California, New York, and Massachusetts | Long term (≥ 4 years) |
| Source: Mordor Intelligence | |||
Aging Building Stock in OECD Markets Requiring Upgrades
The median commercial building in the United States was 44 years old in 2025, and many structures erected before 1980 still rely on single-stage rooftop units that lack variable-speed drives, economizers, or modern controls.[1]U.S. Energy Information Administration, “Commercial Buildings Energy Consumption Survey,” eia.gov Energy use by those legacy units runs 30%-40% above code-minimum systems, which pressures landlords in cities with disclosure mandates to commit capital to HVAC retrofits. Institutional investors now price carbon intensity into property valuations, so ESG compliance is another trigger. The Infrastructure Investment and Jobs Act allocated USD 3.5 billion for public-sector upgrades that often serve as templates for private owners.[2]U.S. Department of Energy, “DOE Announces USD 3.5 Billion to Make Federal Buildings More Energy Efficient,” energy.gov Retrofit urgency is highest in the Northeast and Midwest where heating loads dominate, though Sun Belt buildings also pursue upgrades to manage peak cooling demand.
Mandatory Refrigerant Phase-Downs Driving Retrofit Demand
The American Innovation and Manufacturing Act targets an 85% cut in hydrofluorocarbon production by 2036, propelling the transition from R-410A toward lower-GWP A2L blends such as R-32 and R-454B. Because A2L refrigerants require sensors, ventilation, and spark-safe components, most existing equipment cannot simply be recharged, so owners face a retrofit or replacement decision well ahead of normal life cycles. ASHRAE Standard 15 drives up installation cost by USD 2,000-USD 5,000 for detection gear.[3]ASHRAE, “Standards and Guidelines,” ashrae.org California and several Northeastern states front-loaded compliance deadlines to 2028, compressing project schedules and crowding service pipelines.
Expansion of Hyperscale Data-Center Build-Outs
United States hyperscale operators earmarked USD 200 billion for new capacity in 2025 with AI workloads pushing rack densities beyond 50 kW, a regime that traditional air-cooled CRAC units cannot economically manage. Liquid cooling makes inroads, yet precision air handling still serves most colocation halls and demands 24/7 service coverage. Technicians in Virginia’s Loudoun County, Texas’s Dallas-Fort Worth, and Arizona’s Phoenix area command premiums of 15%-20% over residential counterparts because downtime penalties trigger heavy liabilities. Cybersecurity vetting now factors into vendor selection as attacks on building-automation networks could trigger thermal events.
HVAC-as-a-Service Contracts Unlocking Annuity Revenues
Outcome-based contracts bundle equipment, installation, energy, and maintenance into a predictable monthly fee, moving HVAC spending from CapEx to OpEx. Johnson Controls indicated that 18% of 2025 North American bookings fell under this model, up from 11% two years earlier. Federal agencies received 2025 guidance endorsing energy-savings performance contracts, teeing up a wave of public-sector opportunities. The model’s success hinges on IoT sensors streaming data that fuels predictive analytics, letting providers dispatch crews before failures unfold.
Restraints Impact Analysis*
| Restraint | (~) % Impact on CAGR Forecast | Geographic Relevance |
|---|---|---|
| Skilled-labor shortages and escalating wage bills | -0.9% | United States, acute in Sun Belt growth markets and rural areas |
| Volatile HVAC component supply and material inflation | -0.7% | United States, with spillover from global semiconductor shortages |
| Cyber-Security Risks in Connected Building Systems | -0.4% | United States, concentrated in high-value commercial and government facilities |
| Rising Urban Permitting Barriers for A2L Refrigerant Storage | -0.3% | United States, primarily in dense urban jurisdictions with strict fire codes |
| Source: Mordor Intelligence | ||
Skilled-Labor Shortages and Escalating Wage Bills
HVAC employment is projected to add 23,000 roles from 2024-2034, but attrition will create 35,000 openings annually, leaving a sizable gap.[4]U.S. Bureau of Labor Statistics, “Heating, Air Conditioning, and Refrigeration Mechanics and Installers,” bls.gov Median hourly wages climbed to USD 28.50 in 2025, while A2L-certified master technicians topped USD 40. Labor now exceeds 55% of total project cost, up from 48% in 2020. Apprenticeships expand, yet four-year training requirements delay relief. Contractors deploy augmented-reality guidance and remote diagnostics to boost productivity, but wage inflation still squeezes margins, especially for smaller firms.
Volatile HVAC Component Supply and Material Inflation
Semiconductor shortages doubled lead times for variable-frequency drives and electronic expansion valves to 16 weeks in early 2025. Copper prices jumped 22% the same year, inflating the cost of refrigerant piping and coils. A Thailand factory fire sidelined one of the three dominant global scroll-compressor suppliers, exposing single-point-of-failure risk. Distributors enlarged inventories, but higher carrying costs ultimately flowed to customers as elevated service fees.
*Our forecasts treat driver/restraint impacts as directional, not additive. The impact forecasts reflect baseline growth, mix effects, and variable interactions.
Segment Analysis
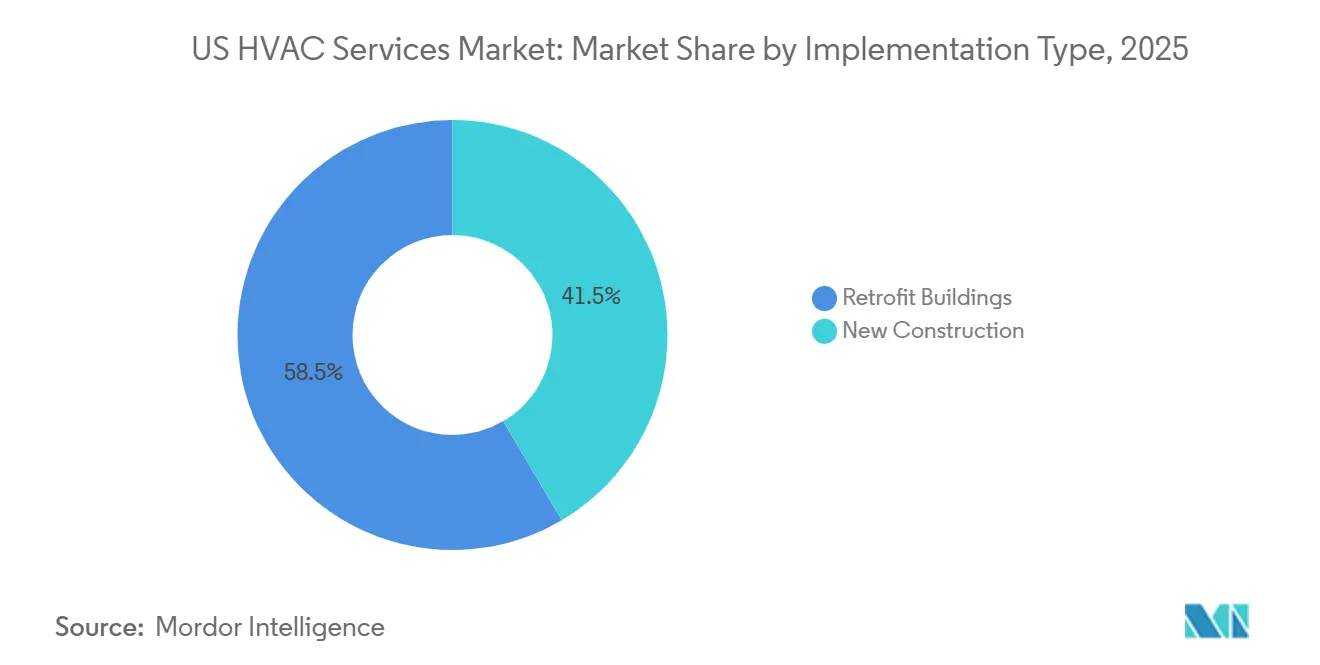
By Implementation Type – Retrofit Buildings Capture Sustained Upgrade Cycles
Retrofit buildings contributed 58.49% of 2025 revenue and are forecast to rise at 6.23% through 2031, reinforcing their role as the growth engine of the US HVAC services market. The US HVAC services market size for retrofit projects is expanding as owners race to replace R-410A systems ahead of the EPA phase-down calendar, creating a retrofit wave that overlaps with normal end-of-life milestones. ESG mandates tie asset values to operational carbon, so capital partners increasingly insist on variable-speed compressors and smart controls that lower kWh per square foot. Prefabricated modular kits, craned into place in a single day, slash disruption and let contractors deliver more jobs per crew per month.
New construction trails at a 5.40% CAGR yet still benefits from stronger design-build coordination. Developers in growth metros specify heat-recovery VRF systems that improve tenant comfort and differentiate Class A properties. Federal funding for public buildings steers toward retrofits, but ground-up healthcare and industrial facilities keep new-build pipelines active in Sun Belt states.


By Service Type – Energy-Efficiency Retrofits Outpace Break-Fix Work
Maintenance and repair retained the largest share at 46.15% in 2025, yet the highest momentum sits with energy-efficiency and retrofit services, advancing 7.03%. The US HVAC services market size for optimization projects benefits from utility rebates that buy down payback to three years or less. Controls upgrades climb 6.50% as buildings migrate from stand-alone thermostats to IP-connected platforms. Installation services face commoditization in residential split-system changeouts, motivating contractors to pivot toward bundled commercial scopes that fold in commissioning and multi-year service.
Consulting and other advisory work accelerates as owners seek third-party audits before allocating capital. Energy-savings performance contracts, now endorsed for federal facilities, enable providers to front the cost and recover investments from verified kWh reductions, reshaping revenue recognition.
By System Type – Ventilation and IAQ Services Gain Post-Pandemic Momentum
Cooling still dominated with 42.58% of 2025 revenue, but ventilation and IAQ lead in growth at 6.76%. Revised ASHRAE Standard 62.1 elevates outdoor air rates by 30% for high-density spaces, encouraging demand-controlled ventilation retrofits that balance air quality with energy spend. Healthcare clients specify MERV 13 and HEPA filters, creating annuity contracts for quarterly replacements. Heating services move gradually toward air-source heat pumps in cold climates where incentives close the cost gap with gas furnaces.
Integrated building-management services rise 6.20% as portfolios bundle HVAC with lighting, elevating cyber-risk profiles that drive service providers to add network segmentation to routine maintenance.
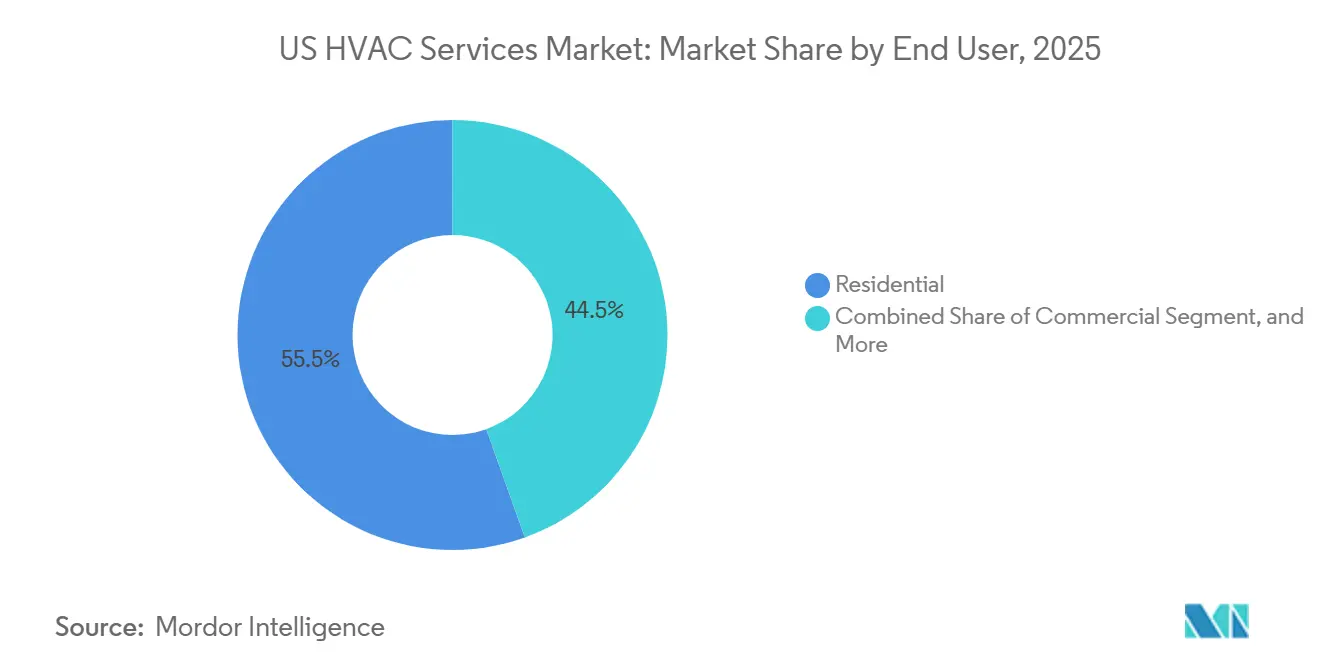
By End User: Industrial Facilities Accelerate Amid Reshoring
Residential accounted for 55.48% of 2025 demand, fueled by a vast installed base of single-family homes, yet industrial is the fastest at 6.88%. The US HVAC services market share held by industrial clients is growing due to biotech, semiconductor, and e-commerce warehouses that require precise thermal control. Pharmaceutical plants mandate ±1 °F tolerance zones, and logistics centers run HVAC year-round to protect automated picking systems.
Commercial tenants in office and hospitality properties continue to outsource maintenance to landlords under triple-net leases, producing fragmented, lower-ticket contracts. Residential growth steadies at 5.50% as smart thermostats and filter-delivery subscriptions deepen lifetime value per home.

By Application Vertical – Data Centers Lead as AI Workloads Surge
Data centers captured 23.71% of 2025 revenue and race ahead at 6.92%. The US HVAC services market size inside data halls benefits from racks above 50 kW that force specialized cooling topologies. Service contracts guarantee sub-hour response times and embed cybersecurity audits. Liquid cooling is still emergent, so precision air systems with redundant CRAH units dominate near-term demand.
Healthcare follows at 6.50% as hospitals retrofit isolation rooms and upgrade filtration. Education rises 6.20% on bond-funded upgrades to aging campuses, while hospitality prioritizes VRF systems that align with guest comfort metrics. Retail defers large upgrades, but preventive maintenance keeps doors open without capital outlays.
Geography Analysis
In North America, the US HVAC services market stands out, largely due to national building codes, licensing, and refrigerant regulations that bolster the competitive edge of domestic providers. These regulations create a structured environment that favors local companies, ensuring compliance and consistency across the market. States in the Sun Belt, particularly Texas, Arizona, Florida, and Georgia, experience a surge in cooling demands, with contractors in these regions managing 20%-25% more summer service calls than the national average. The high temperatures in these states drive the need for frequent maintenance and repair services, making them critical markets for HVAC service providers. As demand intensifies with the heat, wage premiums emerge: technicians in the Dallas-Fort Worth area command salaries 15% higher than their counterparts in cooler regions. This wage disparity reflects the increased workload and the specialized skills required to address the unique challenges posed by extreme heat.
In California, a looming 2028 ban on high-GWP equipment sales propels urgency in retrofitting, prompting owners to expedite changeouts to avoid potential supply bottlenecks. This regulatory shift is expected to significantly impact the market, as businesses and homeowners rush to comply with the new standards, creating opportunities for HVAC service providers to capitalize on the growing demand for retrofitting and equipment upgrades.
Meanwhile, in the Northeast and Midwest, the focus shifts to heating systems, with an emphasis on modernizing boilers to meet winter demands. These regions experience harsh winters, making efficient and reliable heating systems a necessity. The adoption of heat pumps is on the rise, bolstered by incentives that cover 25%-35% of installation costs, effectively shortening payback periods. These financial incentives make heat pumps a more attractive option for consumers, driving their adoption and contributing to the growth of the HVAC services market in these areas. In Loudoun County, Virginia, the concentration of hyperscale campuses exacerbates labor shortages, leading service vendors to offer signing bonuses to attract top-tier technicians. The high density of these campuses creates a unique demand for skilled HVAC professionals, as maintaining optimal environmental conditions is critical for the operation of data centers and other facilities. This labor shortage highlights the importance of workforce development and competitive compensation strategies in sustaining the growth of the HVAC services market.
Competitive Landscape
The US HVAC services market remains moderately fragmented. The top five players - Johnson Controls, Carrier, Trane Technologies, Comfort Systems USA, and EMCOR Group - collectively control nearly 35% of 2025 revenue. OEMs lean on IoT-enabled diagnostics to upsell predictive-maintenance contracts, locking customers into proprietary parts and data platforms. Johnson Controls disclosed that outcome-based contracts rose to 18% of North American bookings in 2025, underscoring the pivot to recurring revenue.
Regional independents defend share with modular retrofit kits that slash project timelines and avoid single-vendor dependencies. Technology platforms such as on-demand technician marketplaces give smaller firms national reach, but quality assurance remains a hurdle. Cybersecurity credentials differentiate providers in data-center and government segments, responding to CISA advisories that insurers now reference in policy language.
M&A activity intensified: Carrier bought Viessmann Climate Solutions for EUR 12 billion (USD 13.1 billion) in December 2025, adding an 8,000-technician footprint and heat-pump expertise. Trane Technologies earmarked USD 150 million for twelve new hubs and 500 field techs in January 2026, illustrating capacity investments to chase hyperscale data-center contracts. White-space remains in buildings under 50,000 square feet, where owner fragmentation deters national chains and opens lanes for agile local contractors.
US HVAC Services Industry Leaders
Carrier Global Corporatio
Johnson Controls International PLC
Trane Technologies plc
Lennox International Inc.
Daikin Industries Ltd
- *Disclaimer: Major Players sorted in no particular order

Recent Industry Developments
- January 2026: Trane Technologies invested USD 150 million to open 12 regional hubs and add 500 technicians, targeting data-center and healthcare corridors.
- November 2025: Johnson Controls secured a 10-year, USD 200 million agreement to manage HVAC across 15 hyperscale data centers with uptime guarantees.
- October 2025: EMCOR Group acquired a Texas HVAC contractor for USD 85 million, bringing in 300 technicians to expand Sun Belt coverage.
- September 2025: Daikin partnered with Pacific Gas and Electric on a predictive-maintenance pilot subsidizing IoT sensor rollouts for 500 commercial sites.


Research Methodology Framework and Report Scope
Market Definitions and Key Coverage
Our study defines the United States HVAC services market as all revenue earned inside the country by licensed contractors, distributors, and OEM-affiliated service teams through the design, installation, retrofit, preventive maintenance, energy management, and emergency repair of heating, ventilation, air conditioning, refrigeration, and connected control systems that serve residential, commercial, industrial, and institutional buildings.
Sales of brand-new HVAC equipment, replacement parts sold over the counter, and purely do-it-yourself labor are excluded.
Segmentation Overview
- By Implementation Type
- New Construction
- Retrofit Buildings
- By Service Type
- Installation and Replacement Services
- Maintenance and Repair Services
- Energy-Efficiency and Retrofit Services
- HVAC Controls Upgrade and Integration
- Consulting and Other Services
- By System Type
- Heating Services
- Cooling Services
- Ventilation and IAQ Services
- Integrated Building-Management Services
- By End User
- Residential
- Commercial
- Industrial
- By Application
- Data Centers
- Healthcare Facilities
- Educational Institutions
- Hospitality and Leisure
- Retail Spaces
- Government and Public Buildings
- Other Applications
- By Geography
- North America
- United States
- Canada
- Mexico
- South America
- Brazil
- Argentina
- Mexico
- Rest of South America
- Europe
- United Kingdom
- Germany
- France
- Benelux
- Rest of Europe
- Asia Pacific
- China
- India
- Japan
- Rest of Asia Pacific
- Middle East and Africa
- Middle East
- United Arab Emirates
- Saudi Arabia
- Rest of Middle East
- Africa
- South Africa
- Rest of Africa
- Middle East
- North America
Detailed Research Methodology and Data Validation
Primary Research
Mordor analysts interviewed facility managers, multi-state residential contractors, regional distributors, and code officials across the Northeast, South, Midwest, and West. These conversations corroborated unit service prices, technician productivity, contract renewal rates, and the emerging impact of Inflation Reduction Act rebate programs, thereby filling gaps left by published statistics and refining our regional weightings.
Desk Research
We began with public datasets that clarify the size of the serviced equipment pool and the cadence of replacement work, such as U.S. Census construction put-in-place tables, the Residential Energy Consumption Survey, Bureau of Labor Statistics contractor wage files, Energy Information Administration heat pump shipment reports, and Federal tax credit uptake notices. Industry guidelines and rulemakings from ASHRAE, DOE, and EPA helped us gauge service needs around refrigerant phase-downs and higher SEER standards. Trade association materials from ACCA, PHCC, AHRI, and the Building Owners and Managers Association added building-level behavioral insight. To enrich firm-level revenue splits, we tapped D&B Hoovers and news flows via Dow Jones Factiva. This list is illustrative; many additional open and paid sources informed data collection and validation.
Market-Sizing & Forecasting
A top-down model converts building stock, equipment penetration, and typical annual service spend into a demand pool, which is then counter-checked with bottom-up samples of contractor revenues and average selling price times service visit volumes. Key variables like housing starts, non-residential floor space additions, average equipment age, refrigerant compliance deadlines, and technician wage inflation drive both value and growth assumptions. Multivariate regression and scenario analysis project these inputs through 2030; anomalies surfaced during modeling trigger call-backs to respondents or revisits of source data.
Data Validation & Update Cycle
Outputs pass a three-step review: automated variance flags, peer analyst audit, and senior sign-off. We refresh each model annually, issuing interim updates when policy shocks, extreme weather, or large M&A events materially alter service demand. A last-mile check is completed just before report release.
Why Mordor's US HVAC Services Baseline Commands Reliability
Published U.S. HVAC service estimates often differ because firms mix equipment sales with labor, cover North America instead of one country, or lock assumptions before new energy efficiency rules land.
Key gap drivers include scope breadth, contract mix treatment, refresh cadence, and the depth of primary validation.
Mordor's study, anchored in 2025 contractor-only revenue and renewed every year, avoids such drift.
Benchmark comparison
| Market Size | Anonymized source | Primary gap driver |
|---|---|---|
| $28.20 B (2025) | Mordor Intelligence | - |
| $40.87 B (2025, North America) | Regional Consultancy A | Includes Canada and Mexico, combines equipment and labor, limited primary checks |
| $26.90 B (2024, U.S.) | Industry Consultancy B | Focuses on upgrade and replacement only; conservative renewal assumptions; shorter forecast span |
Taken together, the comparison shows that Mordor's disciplined service-only scope, live policy tracking, and dual-layer validation deliver a balanced, decision-ready baseline for planners and investors.


Key Questions Answered in the Report
How large is the US HVAC services market today?
The market stood at USD 18.98 billion in 2026 and is on track to reach USD 25.35 billion by 2031.
What CAGR is expected for US HVAC services through 2031?
The forecast CAGR is 5.90% over the 2026-2031 period.
Which segment of US HVAC services is growing fastest?
Energy-efficiency and retrofit services lead with a 7.03% CAGR as owners prioritize performance optimization.
Why are data centers important for HVAC service demand?
AI workloads drive rack densities above 50 kW, requiring precision cooling and multi-year service contracts with strict uptime clauses.
What is the main challenge facing HVAC service providers?
A skilled-labor shortage that lifts technician wages and squeezes margins is the most immediate hurdle.
How concentrated is the competitive landscape?
The top five firms account for about 35% of revenue, indicating moderate concentration with ample room for regional specialists.
Page last updated on:


