
Market Overview
| Study Period | 2020 - 2031 |
|---|---|
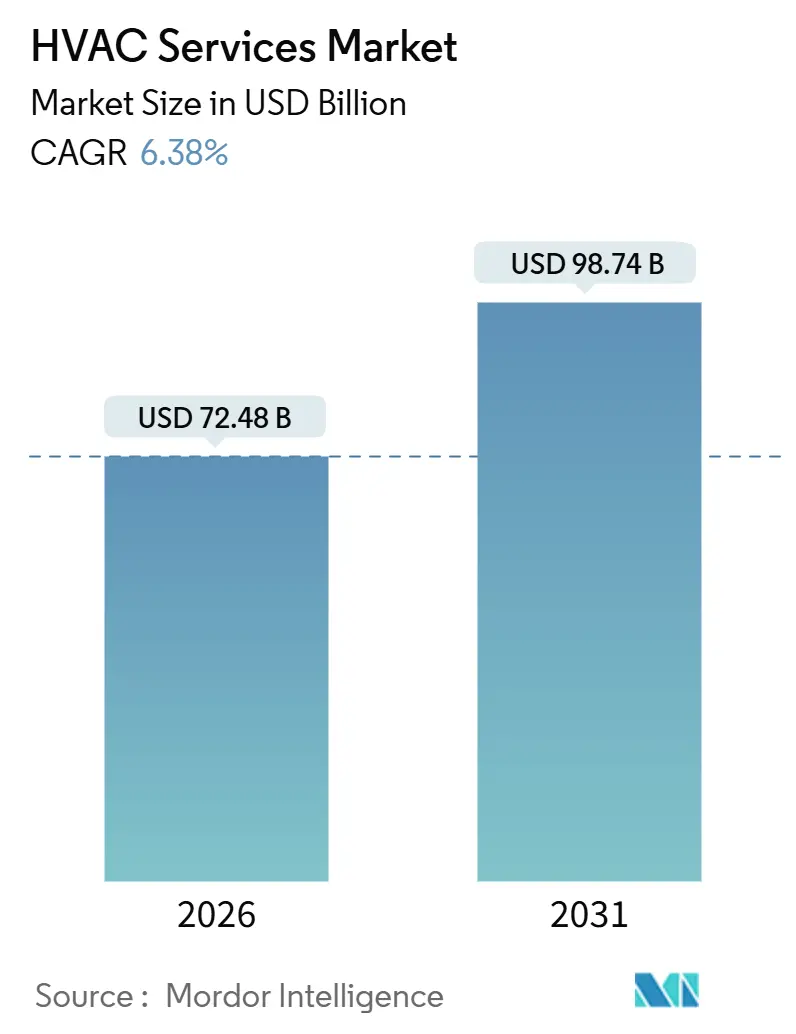
| Market Size (2026) | USD 72.48 Billion |
| Market Size (2031) | USD 98.74 Billion |
| Growth Rate (2026 - 2031) | 6.38 % |
| Fastest Growing Market | Asia Pacific |
| Largest Market | North America |
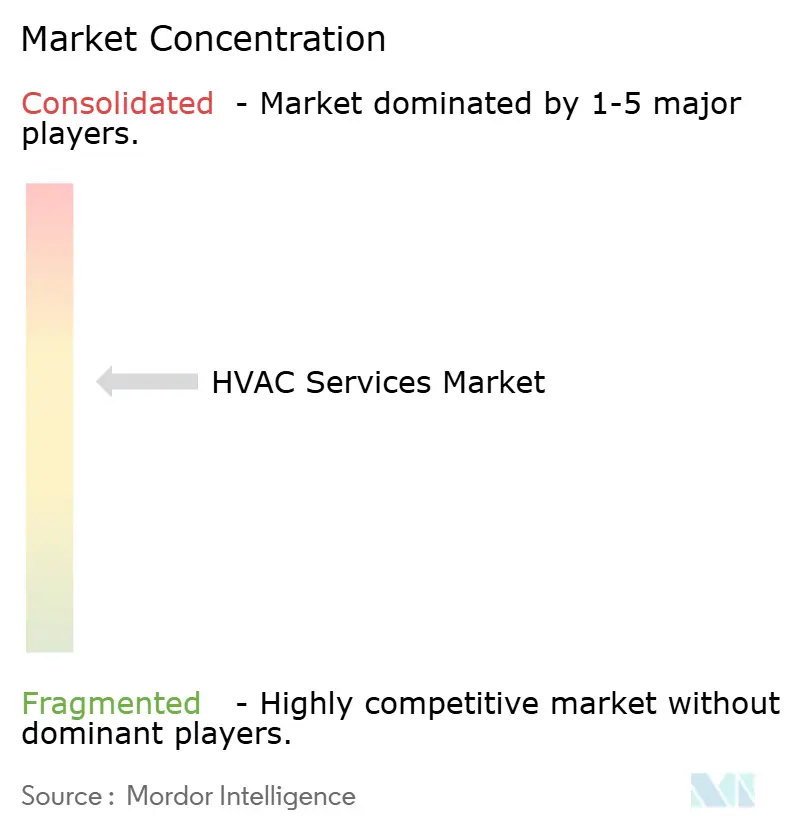
| Market Concentration | Medium |
Major Players *Disclaimer: Major Players sorted in no particular order Image © Mordor Intelligence. Reuse requires attribution under CC BY 4.0. | |
HVAC Services Market Analysis by Mordor Intelligence
The HVAC services market size is valued at USD 72.48 billion in 2026 and is projected to reach USD 98.74 billion by 2031, reflecting a 6.38% CAGR. Increasing AI-ready data center construction, low-global-warming-potential (GWP) refrigerant mandates, and the shift toward subscription-based maintenance agreements are converging to drive demand. Liquid-cooling systems capable of dissipating more than 100 kW per rack are pushing operators to embed high-capacity chillers that require specialized commissioning. Mandatory hydrofluorocarbon phase-downs under the Kigali Amendment are accelerating retrofit projects across 155 nations, while IoT-enabled remote diagnostics are lowering truck-roll costs, encouraging service providers to wrap predictive analytics into annuity contracts[1]United Nations Environment Programme, “Kigali Amendment to the Montreal Protocol HFC Phase-Down,” unep.org. Together, these trends are redrawing competitive boundaries, rewarding incumbents that can bundle equipment, software, and managed services.
Key Report Takeaways
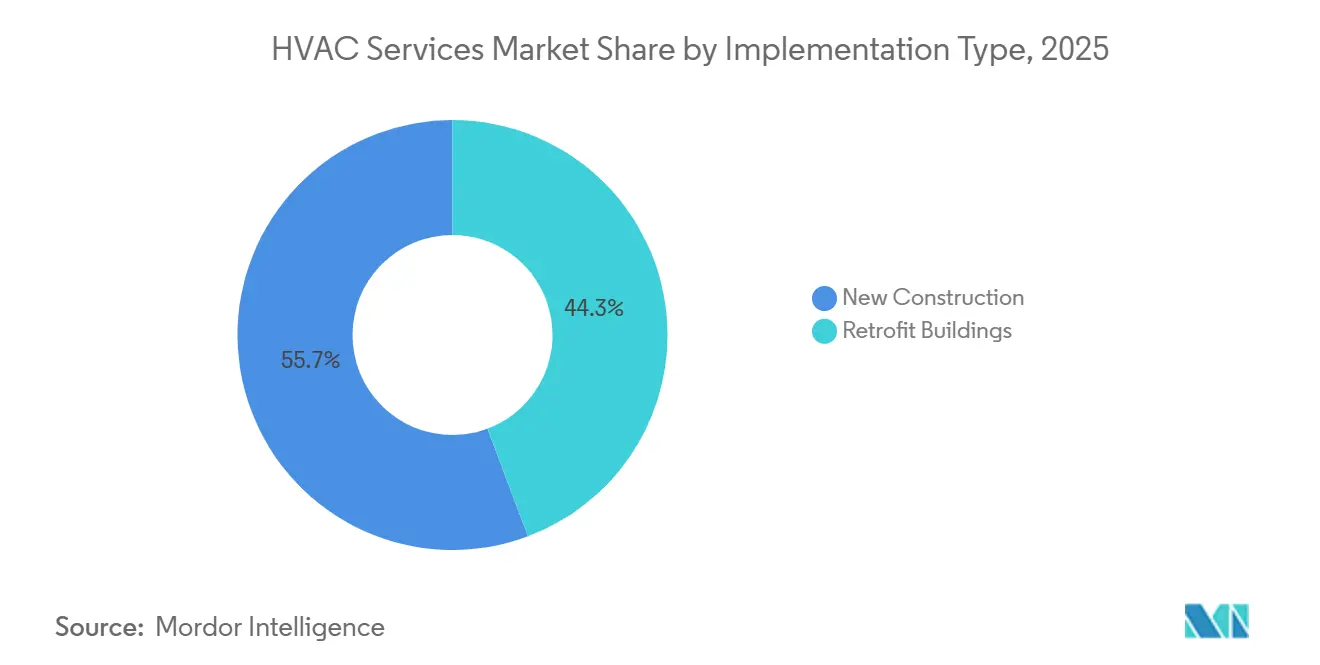
- By implementation type, new construction led with a 55.71% revenue share in 2025, whereas retrofit buildings are forecast to expand at a 6.92% CAGR through 2031.
- By service type, maintenance and repair accounted for 46.14% of 2025 revenue, while energy-efficiency and retrofit services are advancing at a 7.88% CAGR to 2031.
- By system type, cooling services captured 49.55% of 2025 sales; integrated building-management offerings are projected to rise at a 7.51% CAGR through 2031.
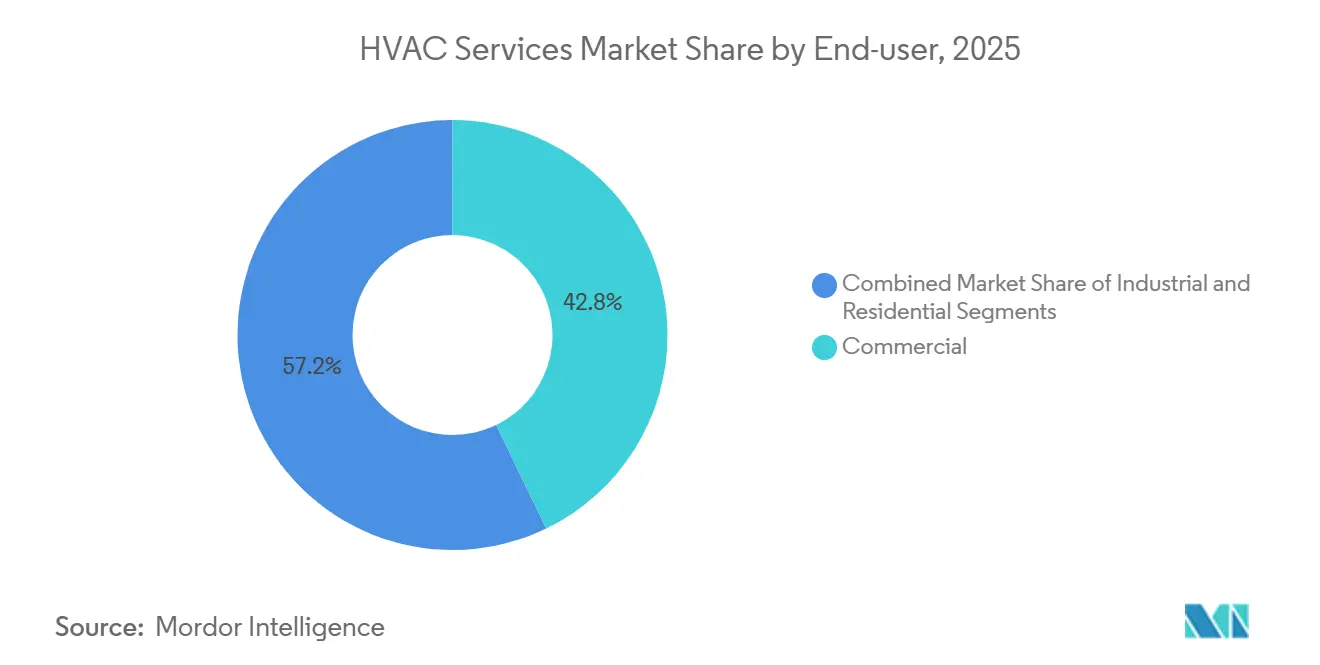
- By end user, commercial facilities held a 42.81% share in 2025, yet industrial sites are set to grow at a 7.23% CAGR by 2031.
- By application vertical, data centers contributed 23.37% of the 2025 spend, whereas hospitality venues are poised for a 6.71% CAGR to 2031.
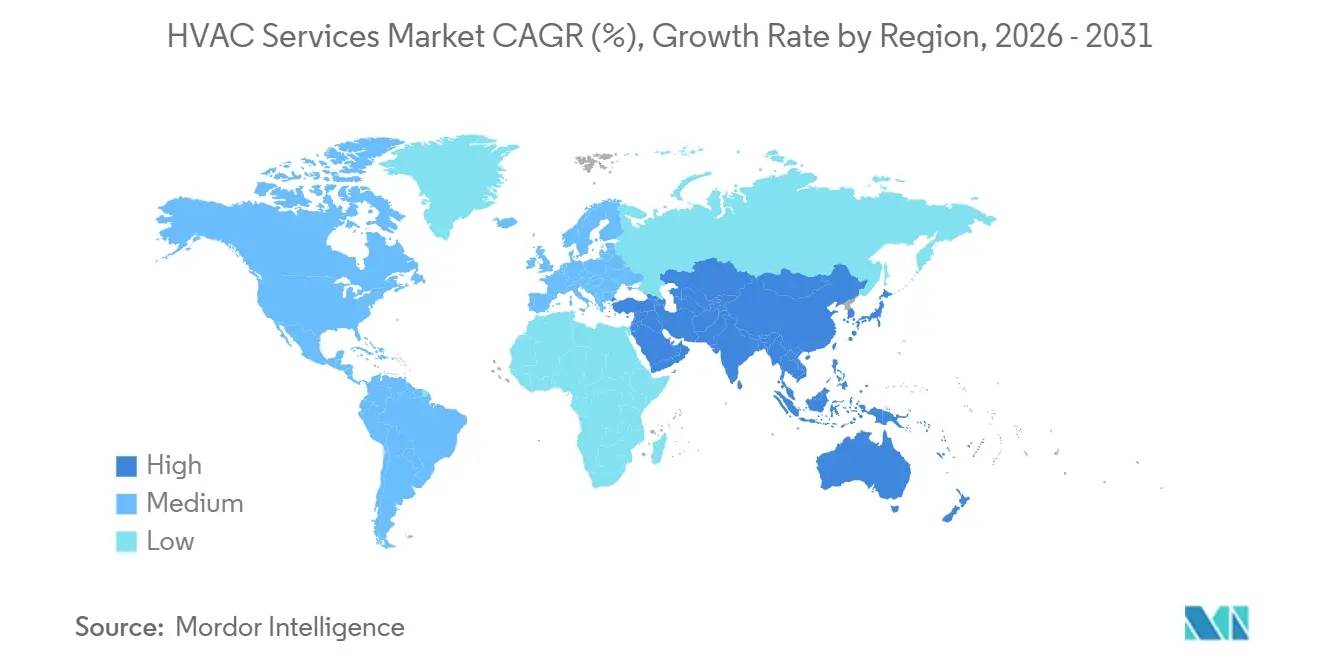
- By geography, North America commanded 38.17% of 2025 revenue, and Asia-Pacific is expected to post a 7.90% CAGR during the forecast horizon.
Note: Market size and forecast figures in this report are generated using Mordor Intelligence’s proprietary estimation framework, updated with the latest available data and insights as of January 2026.
Market Trends and Insights
Drivers Impact Analysis of HVAC Services Market*
| Driver | (~) % Impact on CAGR Forecast | Geographic Relevance | Impact Timeline |
|---|---|---|---|
| Growing Construction Activity in Emerging Economies | +1.2% | India, China, Southeast Asia, Gulf nations | Medium term (2-4 years) |
| Expansion of Hyperscale Data-Center Build-Outs | +1.5% | North America, Europe, Singapore, Tokyo, Sydney | Short term (≤2 years) |
| Mandatory Refrigerant Phase-Downs | +1.3% | 155 Kigali signatories, especially EU and North America | Long term (≥4 years) |
| Aging Building Stock in OECD Markets | +0.9% | United States, United Kingdom, Germany, France | Medium term (2-4 years) |
| Remote Diagnostics and Robotics | +0.8% | Early adoption in United States and Western Europe | Medium term (2-4 years) |
| HVAC-as-a-Service Contracts | +0.7% | United States and Europe, nascent in Asia-Pacific | Long term (≥4 years) |
| Source: Mordor Intelligence | |||
Growing Construction Activity in Emerging Economies
Robust public-works pipelines in India and the Gulf Cooperation Council (GCC) are sustaining new installation demand. India’s construction sector is expanding by 8-10% in fiscal 2026, supported by government urban housing schemes. The GCC maintains a USD 3 trillion project backlog, and megaprojects such as NEOM require district-cooling plants that open long-term service opportunities. Developers are pre-specifying variable-refrigerant-flow systems to secure green-building certifications, and local-content rules are pushing multinational vendors to establish in-country support hubs. These factors are fragmenting traditional supply chains and favoring regional contractors fluent in local procurement norms and languages.
Expansion of Hyperscale Data-Center Build-Outs
GPU-dense clusters generate thermal loads exceeding 100 kW per rack, prompting operators to adopt liquid cooling. Microsoft introduced direct-to-chip cooling in 2025, while Google deployed rear-door heat exchangers, each requiring specialized chiller retrofits. Service vendors are negotiating uptime-based contracts tied to power-usage-effectiveness metrics, shifting risk to providers that must invest in continuous monitoring. The International Energy Agency projects data-center electricity demand to double by 2030, implying parallel growth in thermal-storage projects that flatten grid loads.
Mandatory Refrigerant Phase-Downs Driving Retrofit Demand
The Kigali Amendment obliges signatories to cut hydrofluorocarbon use by 85% before 2036. The United States Environmental Protection Agency’s AIM Act has already triggered price spikes for legacy refrigerants, accelerating equipment turnover[2]U.S. Environmental Protection Agency, “AIM Act Implementation,” epa.gov. Europe’s F-gas rules ban most virgin HFC sales by 2030, stimulating a premium market for reclaimed refrigerants. Service firms are monetizing uncertainty through refrigerant-management contracts that combine leak detection, reclamation, and compliance reporting.
Remote Diagnostics and Robotics Lowering Service Costs
IoT sensors feeding predictive-maintenance software now forecast compressor failure two weeks in advance, reducing emergency dispatches by 25%. Digital twins optimize chiller sequencing and lower utility bills by up to 20%. Technicians concentrate on higher-skill tasks, while routine filter changes use augmented-reality guidance. Robotics remains niche, but pilot projects in hospital clean rooms demonstrate how drones and autonomous leak detectors can support lights-out maintenance.
Restraints Impact Analysis of HVAC Services Market*
| Restraint | (~) % Impact on CAGR Forecast | Geographic Relevance | Impact Timeline |
|---|---|---|---|
| Skilled-Labor Shortages and Wage Pressure | -0.9% | United States, Canada, Western Europe | Short term (≤2 years) |
| Volatile Component Supply and Material Costs | -0.7% | Global, pronounced in North America and Europe | Medium term (2-4 years) |
| Cyber-Security Risks in Connected Buildings | -0.4% | North America and Europe | Long term (≥4 years) |
| Subscription Disruptors Compressing Margins | -0.3% | United States and Europe, emerging in Asia-Pacific | Medium term (2-4 years) |
| Source: Mordor Intelligence | |||
Skilled-Labor Shortages and Escalating Wage Bills
The United States recorded 110,000 unfilled HVAC technician posts in 2025 despite a 12% median-wage rise to USD 57,300. Retirement-driven attrition and limited immigration inflows intensify constraints, and Germany reports a 15% vacancy rate for mechatronics roles. Apprenticeship programs will not yield fully trained personnel for at least 3 years, squeezing contractor margins, as labor costs account for more than half of service revenue.
Volatile HVAC Component Supply and Material Inflation
The Producer Price Index for HVAC equipment rose more than 5% in 2025 amid steel tariffs, copper volatility, and semiconductor shortages. A temporary shortage of R-454B refrigerant extended chiller lead times to 12 weeks. Larger manufacturers mitigate risk by vertically integrating. Carrier’s acquisition of Viessmann Climate Solutions brought heat-pump production in-house, whereas smaller contractors must incorporate cost-escalation clauses that slow bid acceptance.
*Our forecasts treat driver/restraint impacts as directional, not additive. The impact forecasts reflect baseline growth, mix effects, and variable interactions.
Segment Analysis
By Implementation Type New Construction Dominates While Retrofit Accelerates
New construction accounted for a 55.71% HVAC services market share in 2025, underpinned by megaprojects in Asia-Pacific and the Middle East. The HVAC services market for new builds will continue to expand as smart-city initiatives specify factory-prefabricated mechanical rooms that reduce on-site labor. Retrofit demand is rising at a 6.92% CAGR, driven by the European Union directive mandating that public buildings achieve near-zero emissions by 2028. The United Kingdom’s 29 million pre-1980 homes represent a GBP 250 billion (USD 315 billion) opportunity, but split-incentive hurdles and installer backlogs temper immediate uptake.
Retrofit projects often bundle HVAC upgrades with solar photovoltaics and battery storage, enabling participation in demand-response programs. Pre-retrofit audits and commissioning now make up about 10% of project value. In contrast, modular data-center shells enable equipment vendors to ship integrated cooling pods, reducing field-installation time by 30% and reinforcing new-construction leadership in emerging economies.
By Service Type Energy Efficiency Outpaces Maintenance
Maintenance and repair services held 46.14% of 2025 revenue, yet energy-efficiency and retrofit work is advancing at a 7.88% CAGR. Utilities in California and New York cover up to 50% of chiller-replacement costs, accelerating adoption of units that meet ASHRAE 90.1-2022 thresholds[3]California Public Utilities Commission, “High-Efficiency Chiller Rebates,” cpuc.ca.gov. Performance-based contracts are displacing time-and-materials billing, aligning provider compensation with guaranteed energy savings.
The HVAC services market size for controls upgrades is also rising as buildings converge lighting, security, and climate onto IP networks. Consulting services, such as commissioning, benefit from the International Code Council rules that require continuous monitoring for facilities over 50,000 square feet. Online marketplaces exert price pressure on installation jobs, encouraging contractors to differentiate via analytics and turnkey energy-retrofit capabilities.
By System Type Integrated Management Gains Momentum
Cooling services retained 49.55% revenue share in 2025, while integrated building-management solutions are growing at a 7.51% CAGR. Germany now mandates that 65% of new heating systems use renewables, fueling heat-pump installations that drive recurring maintenance contracts. ASHRAE 241-2023 elevated ventilation standards, spurring retrofits that add demand-controlled airflow and energy-recovery units.
Integrated platforms aggregate alarms from HVAC, fire, and access-control systems, lowering operator workload and enabling predictive alerts that cut downtime. Owners use these dashboards to quantify Scope 2 emissions for ESG reporting. Ventilation demand in healthcare, pharmaceuticals, and education remains high as ultraviolet germicidal irradiation and high-efficiency particulate filters become standard.
By End User Industrial Facilities Accelerate
Commercial buildings generated 42.81% of 2025 sales, supported by office and retail portfolios that prefer consolidated multi-site contracts. Industrial facilities, however, are projected to grow at a 7.23% CAGR as semiconductor fabs and pharmaceutical clean rooms mandate ±0.5 °C temperature stability and redundant chiller arrays. Taiwan Semiconductor Manufacturing Company’s Arizona fab commissioned 12 MW of HVAC capacity in 2025, locking in decade-long service deals.
Residential demand remains fragmented, though heat-pump subsidies in Europe and North America are improving contract penetration. Industrial process-cooling projects now integrate with manufacturing equipment, enabling contractors to achieve higher margins through cryogenic expertise. Commercial clients are increasingly piloting HVAC-as-a-Service agreements that convert capital expenditure into operating expenditure through per-ton-hour pricing.

By Application Vertical Hospitality Rises as Data Centers Mature
Data centers accounted for a 23.37% share in 2025, but growth is moderating as hyperscalers insource maintenance teams. Hotels and leisure venues are gaining prominence, rising at a 6.71% CAGR as chains retrofit rooms with demand-controlled ventilation and ionization units that market health assurances to guests. Healthcare facilities adopt ASHRAE 170-2021-compliant isolation rooms, which increase HVAC operating costs by 40% compared with standard offices, creating premium service opportunities.
Government buildings in the United States deploy performance contracts that finance energy savings, while retail spaces adopt variable-air-volume systems to reduce off-peak consumption. Experimental immersion cooling in AI server clusters could eventually bypass traditional air-side HVAC, but commercial readiness remains limited to pilot installations.
Geography Analysis
North America HVAC Services Market
North America delivered 38.17% of 2025 revenue, supported by a USD 2.1 trillion backlog of deferred building maintenance. Aging systems exceeding 15 years of service life are driving replacement demand, yet technician shortages and permitting delays lengthen project cycles. The AIM Act accelerates refrigerant phase-outs, and California’s Title 24 rules seed future heat-pump retrofits. Canada’s carbon price of CAD 80 (USD 59) per ton in 2025 encourages natural-gas boiler conversions, though grid constraints in Alberta temper heat-pump deployment. Mexico’s nearshoring wave lifted industrial HVAC demand by 18% in 2025.
APAC HVAC Services Market
Asia-Pacific is forecast to post a 7.90% CAGR to 2031, led by India’s double-digit construction growth and China’s 400 million m² of district-cooling networks[4]China District Energy Association, “District Cooling Networks,” cdea.org.cn. Japan’s aging demographics spur the adoption of residential heat pumps with remote monitoring, while Southeast Asia’s high electricity tariffs push owners toward thermal-storage strategies. Australia’s 2025 building code adopts whole-of-home energy budgets, forcing service providers to deliver integrated efficiency audits.
Europe, Middle East and LATAM HVAC Services Market
Europe’s revised building-performance directive requires zero-emission stock by 2050, compelling accelerated retrofits. Germany’s 21 million pre-1980 homes face a EUR 200 billion (USD 220 billion) heat-pump opportunity, although installer backlogs slow progress. The United Kingdom’s GBP 7,500 (USD 9,450) heat-pump grants have yet to meet adoption targets due to persistent energy-price differentials. Middle Eastern GCC nations continue to roll out district-cooling for megaprojects, whereas Latin American growth is led by Brazilian inverter air conditioners and Argentine local assembly as currency depreciation hampers imports.
Regulatory Landscape
Refrigerant policy is tightening across major HVAC markets, which is reshaping retrofit volumes, refrigerant-management services, and commissioning workflows. Globally, the Kigali Amendment framework continues to underpin hydrofluorocarbon (HFC) phase-down obligations across signatory countries, while the United States is implementing its transition through the EPA AIM Act technology transitions program, including installation compliance timing adjustments for certain variable refrigerant flow (VRF) applications tied to permitting milestones.
In Europe, Regulation (EU) 2024/573 (effective March 11, 2024) accelerates the F-gas phase-down and adds service restrictions that prohibit the use of high-GWP (>=2500) F-gases for servicing certain air-conditioning and heat pump equipment starting January 1, 2026. This pushes owners toward lower-GWP alternatives, reclaimed refrigerants, and tighter leak-management practices. The EU also updated conformity verification for pre-charged equipment through Commission Implementing Regulation (EU) 2025/2155 (adopted October 23, 2025), increasing the compliance and documentation burden for equipment placement and service workflows. Separately, the US Department of Energy has set future energy conservation compliance dates for certain commercial HVAC equipment classes (including air-cooled commercial package air conditioners and heat pumps), supporting continued demand for efficiency-focused service upgrades and controls optimization.
Competitive Landscape
The HVAC services market is moderately fragmented, with the top five firms capturing roughly 35% of 2025 revenue. Johnson Controls, Carrier, Trane Technologies, EMCOR, and Comfort Systems USA leverage nationwide networks to win multi-year service agreements. Robert Bosch purchased Johnson Controls’ residential HVAC assets for USD 8.1 billion in 2025, merging German heat-pump technology with North American distribution. Samsung acquired FläktGroup in November 2025, widening its ventilation and air-handling portfolio for European hospitals and data centers.
Technology platforms are the main differentiator. Johnson Controls OpenBlue uses digital twins to cut energy use 20%, while Honeywell Forge predicts component failures and supports uptime guarantees. Carrier’s Cooling-as-a-Service model shifts capital risk to the vendor and generates recurring revenue. Cybersecurity demand is rising after a 2025 advisory on unauthenticated building management controllers, creating space for managed security contracts. Variable-speed compressor specialists such as Danfoss and Midea undercut incumbents on first cost, winning share in price-sensitive residential and light-commercial niches.
Private equity remains active: Blackstone bought Copeland from Emerson for USD 13 billion in 2024, creating a vertically integrated supplier that controls compressors, controls, and software. Regional consolidation continues as distributors like Watsco acquire local branches to deepen Sunbelt coverage.
HVAC Services Industry Leaders
Johnson Controls International
Carrier Global
Daikin Industries
Trane Technologies
Lennox International
- *Disclaimer: Major Players sorted in no particular order
HVAC Services Market Companies Covered in this Report
- Johnson Controls International PLC
- Carrier Global Corporation
- Daikin Industries Ltd.
- Trane Technologies PLC
- Lennox International Inc.
- Honeywell International Inc.
- Siemens AG
- LG Electronics Inc.
- Electrolux AB
- Robert Bosch GmbH
- Fujitsu General Ltd.
- Nortek Global HVAC
- Mitsubishi Electric Corporation
- Rheem Manufacturing Company
- Danfoss A/S
- GREE Electric Appliances Inc.
- Midea Group Co. Ltd.
- Johnson Service Group PLC
- Comfort Systems USA Inc.
- EMCOR Group Inc.


Market Opportunities and Future Outlook
Opportunities are expanding where regulation and operating-cost pressure intersect with digital service delivery. The EU Energy Performance of Buildings Directive framework is elevating smart controls and regulation technologies in non-residential buildings as part of the pathway toward the 2050 zero-emission building stock target, which creates demand for controls upgrades, continuous monitoring, and commissioning services in existing facilities. In the United States and Europe, refrigerant transition rules, including F-gas restrictions and EPA technology transitions under the AIM Act, are translating into more complex retrofit scopes, covering refrigerant recovery, leak detection, compliance reporting, and re-commissioning for low-GWP system conversions.
Data center thermal management is also becoming a higher-value services lane, moving beyond conventional comfort cooling toward precision cooling, high-density chiller plant design, and uptime-linked maintenance. Recent supplier actions point to this shift, including Carrier launching the AiroVision 39CV computer room air handler for medium-to-large data centers (March 2026) and expanding data center HVAC testing capabilities in Montluel, France (April 2026). For service providers, these changes support bundled offerings that combine specialized commissioning, remote diagnostics, and performance-based maintenance tied to energy and availability metrics, while increasing the need for cybersecurity-ready integration as building automation systems connect to enterprise networks.
Recent Industry Developments in HVAC Services Market
- June 2026: Johnson Controls launched Metasys 16.0, updating its building automation system with new integration tooling designed to speed up deployment and data sharing across connected building systems. The release supports service-led controls modernization projects and strengthens recurring revenue models tied to continuous monitoring and optimization in large commercial portfolios.
- May 2026: Johnson Controls opened an expanded heat pump and chiller manufacturing site in Holme, Denmark, adding new production space and a customer experience and test center aligned with EN 14511. The added capacity and testing infrastructure supports faster delivery and commissioning of low-GWP, high-efficiency systems across Europe, reinforcing service pull-through for installation, start-up, and lifecycle maintenance.
- November 2025: Samsung Electronics closed its acquisition of FlaktGroup, expanding its large-scale air-handling and ventilation footprint in Europe. The combination broadens the installed base in hospitals and data centers, increasing the addressable aftermarket for maintenance, retrofit, and IAQ-focused service contracts.


HVAC Services Market Report Scope and Research Methodology
Market Definition and Coverage
For this methodology, the HVAC services market is the revenue earned from paid work that installs, maintains, repairs, upgrades, or advises on heating, ventilation, and air-conditioning systems across their working life, for buildings and facilities.
Scope exclusions: We exclude HVAC equipment sales, spare-part manufacturing revenue, standalone controls software, and do-it-yourself maintenance products.
Segments Covered in This Report
- By Implementation Type
- New Construction
- Retrofit Buildings
- By Service Type
- Installation and Replacement Services
- Maintenance and Repair Services
- Energy-Efficiency and Retrofit Services
- HVAC Controls Upgrade and Integration
- Consulting and Other Services
- By System Type
- Heating Services
- Cooling Services
- Ventilation and IAQ Services
- Integrated Building-Management Services
- By End User
- Residential
- Commercial
- Industrial
- By Application Vertical
- Data Centers
- Healthcare Facilities
- Educational Institutions
- Hospitality and Leisure
- Retail Spaces
- Government and Public Buildings
- Others
- By Geography
- North America
- United States
- Canada
- Mexico
- South America
- Brazil
- Argentina
- Mexico
- Rest of South America
- Europe
- United Kingdom
- Germany
- France
- Benelux
- Rest of Europe
- Asia-Pacific
- China
- India
- Japan
- Rest of Asia-Pacific
- Middle East and Africa
- United Arab Emirates
- Saudi Arabia
- South Africa
- Rest of Middle East and Africa
- North America
Data Sources, Market Sizing, and Validation
Desk Research
Desk research was used to build the fact base on demand signals and pricing direction before assumptions were tested through field checks. We referenced public sources such as the US Energy Information Administration, US Census Bureau construction spending series, Bureau of Labor Statistics wage and employment data for HVAC mechanics, and building energy and HVAC efficiency material from the US Department of Energy.
To keep coverage consistent across regions, we also reviewed trade and customs indicators from sources such as UN Comtrade, along with building codes and refrigerant policy updates published by regulators and industry bodies. Company annual reports, investor presentations, and reputable press were used to understand service mix shifts, backlog commentary, and margin movement. Where needed, paid subscriptions for company financials and news were used alongside an import and export shipment-level database and patent databases to validate footprints and technology direction. These examples are not exhaustive, and many other sources were also used for data collection, validation, and research clarification.
Primary Interviews and Surveys
Primary work helped us translate broad indicators into service revenue logic that matches how maintenance and repair is contracted and renewed. We spoke with installers, service contractors, facility managers, and channel participants across APAC, EMEA, and the Americas to confirm service frequencies, contract coverage, labor intensity, and how pricing is being reset for planned maintenance versus emergency calls. We also used these discussions to challenge secondary assumptions and close gaps around retrofit demand, refrigerant compliance impacts, and seasonal patterns by climate zone.
Distribution of primary research fieldwork respondents
| Company type | Respondent position | Region |
|---|---|---|
| Top tier: 37% | CXOs: 13% | APAC: 38% |
| Mid tier: 43% | Functional/Unit leaders: 36% | EMEA: 37% |
| Smaller Players: 20% | Managers: 51% | Americas: 25% |
Market-Sizing & Forecasting
Sizing begins with a top-down demand pool built from building stock activity and serviceable system needs, and then converted into service spend using penetration and frequency assumptions. We anchor the model with practical inputs such as new construction completions, retrofit intensity for aging systems, heating and cooling degree days that shape breakdown cycles, technician availability and wage inflation, and refrigerant and efficiency policy timelines that influence replacement and upgrade work.
Results are then corroborated through selective bottom-up approximations such as sampled contractor revenue per technician, indicative service ticket values, and channel checks on maintenance contract pricing, and the totals are adjusted when a country appears over- or under-stated. Where disclosure is thin, proxies like construction spend, urban housing additions, and commercial floor space growth are used, and then normalized through interview feedback. For forecasting, scenario analysis is applied around replacement cycles, retrofit incentives, labor constraints, and pricing pass-through, followed by a final review to keep the curve consistent with what practitioners expect by region.
Data Validation & Update Cycle
Validation is done in steps so results remain consistent with real-world signals. We compare model outputs with independent metrics such as construction activity, HVAC trade employment and wage movement, and service price inflation cues, and then investigate large variances before sign-off.
Outliers are reviewed through internal peer checks, and follow-up outreach is triggered when a key assumption moves outside the range we hear from practitioners. Reports are refreshed annually, with interim updates when material events occur, such as major policy changes or unusually sharp demand swings. Before delivery, a final analyst pass is completed so clients receive the latest updated view.
Mordor Intelligence's Hvac Services Market Sizing Compared With Other Published Estimates
Published market sizes for HVAC services can diverge because each publisher may count a different mix of activities, pick a different base year, and apply a different method to pricing and volume progression. Differences also show up when bundled work is treated differently, such as upgrades packaged together with equipment replacement.
Some estimates are broader because they roll equipment transactions or wider facility activities into the service total, which inflates the starting value before forecasting even begins. For Mordor Intelligence, the total is limited to paid lifecycle services such as installation, maintenance, repair, retrofit, and advisory work, and it excludes equipment sales, spare-part manufacturing revenue, and standalone controls software.
Benchmark comparison
| Source | Market Size | Gaps in Research Methodology |
|---|---|---|
| Mordor Intelligence | USD 72.48 B (2026) | |
| Global Consultancy A | USD 72.50 B (2025) | Uses a different base year and may apply a wider end-user mapping for new-build and retrofit service work, which can shift the starting value even when the category labels sound similar. |
| Industry Research Publisher B | USD 85.70 B (2025) | Shows a higher 2025 value that can reflect wider inclusions such as consulting and upgrade bundles plus stronger replacement and price escalation assumptions over a longer forecast window, with fewer explicit public exclusions. |
Overall, the spread is mainly explained by base-year alignment and how adjacent revenues are treated, and then forecasting assumptions on replacement cadence and service pricing widen the gap. Our process keeps totals traceable to building activity signals, climate-driven service needs, and realistic labor capacity checks, which makes the estimate easier to replicate and stress-test.


Key Questions Answered in the Report
What is the size of the HVAC services market in 2026?
The HVAC services market size stands at USD 72.48 billion in 2026, with a forecast value of USD 98.74 billion by 2031.
Why are data centers important to HVAC demand?
AI-intensive data centers require liquid cooling and high-capacity chillers that drive specialized installation and multi-year service contracts.
How are refrigerant regulations affecting the market?
Kigali Amendment phase-downs and regional F-gas quotas accelerate chiller replacements and create demand for refrigerant-management services.
What regions offer the strongest growth outlook?
Asia-Pacific shows the fastest regional expansion at a 7.90% CAGR, fueled by large-scale construction in India, China, and Southeast Asia.
How are service providers addressing labor shortages?
Contractors deploy IoT-based remote diagnostics, augmented-reality tools, and apprenticeship programs to boost technician productivity and attract new talent.
Page last updated on:




