United States Healthcare Analytics Market Size and Share
Market Overview
| Study Period | 2020 - 2031 |
|---|---|
| Forecast Data Period | 2026 - 2031 |
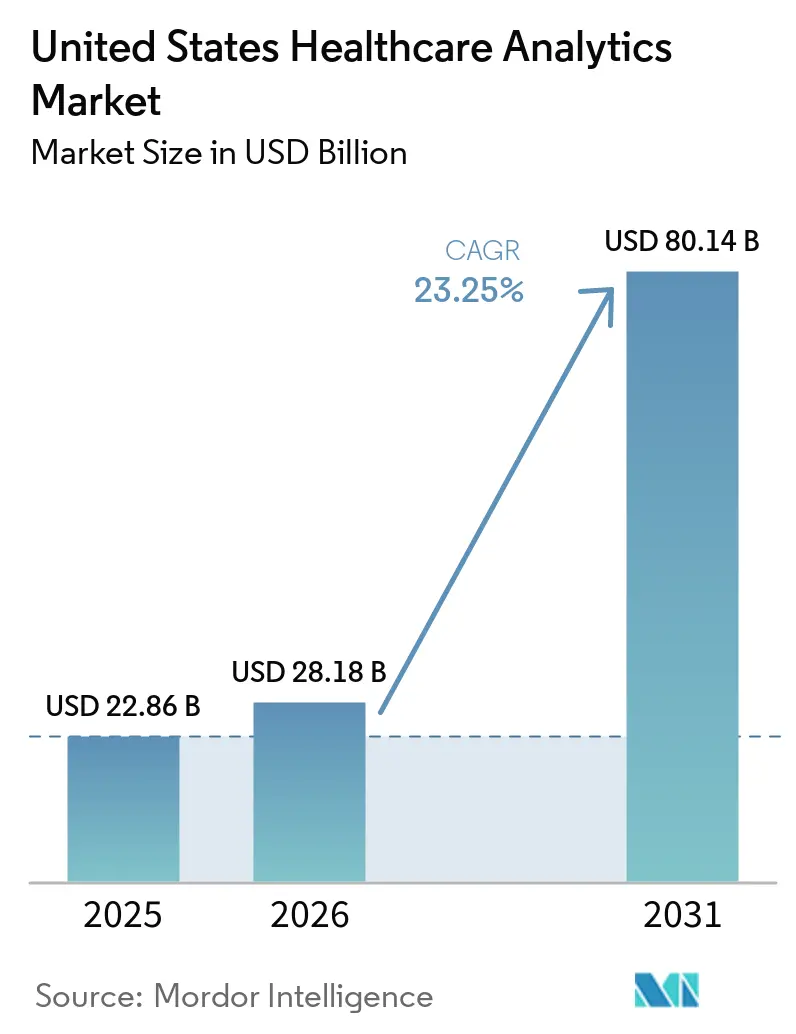
| Base Year Market Size (2025) | USD 22.86 Billion |
| Market Size (2026) | USD 28.18 Billion |
| Market Size (2031) | USD 80.14 Billion |
| Growth Rate (2026 - 2031) | 23.25% CAGR |
| Market Concentration | Medium |
Major Players *Disclaimer: Major Players sorted in no particular order Image © Mordor Intelligence. Reuse requires attribution under CC BY 4.0. | |
United States Healthcare Analytics Market Analysis by Mordor Intelligence
The United States Healthcare Analytics Market size is projected to expand from USD 22.86 billion in 2025 and USD 28.18 billion in 2026 to USD 80.14 billion by 2031, registering a CAGR of 23.25% between 2026 to 2031.
The United States (US) healthcare analytics market is moving into a phase where data infrastructure spending from earlier years is now translating into clearer financial and operational returns across providers, payers, and life-science organizations. Federal payment policy is strengthening this shift because the 2026 Physician Fee Schedule Final Rule places greater weight on clinician-level performance measurement and expands the practical need for third-party analytics support across value-based care programs, while 44.9% of all US healthcare payments were already tied to Alternative Payment Models in 2024. The US healthcare analytics market is also benefiting from cloud-native AI tools and self-service platforms that shorten the path from data ingestion to action, which is widening adoption beyond the largest integrated delivery networks. Even so, cyber risk and governance burden remain material constraints because connected analytics environments have become attractive breach targets and clinical AI deployments still require longer validation cycles than many buyers initially expected. Competition in the US healthcare analytics market is therefore being shaped less by raw feature breadth and more by workflow integration, regulatory readiness, and the ability to serve enterprise buyers across clinical, financial, and administrative use cases.
Key Report Takeaways
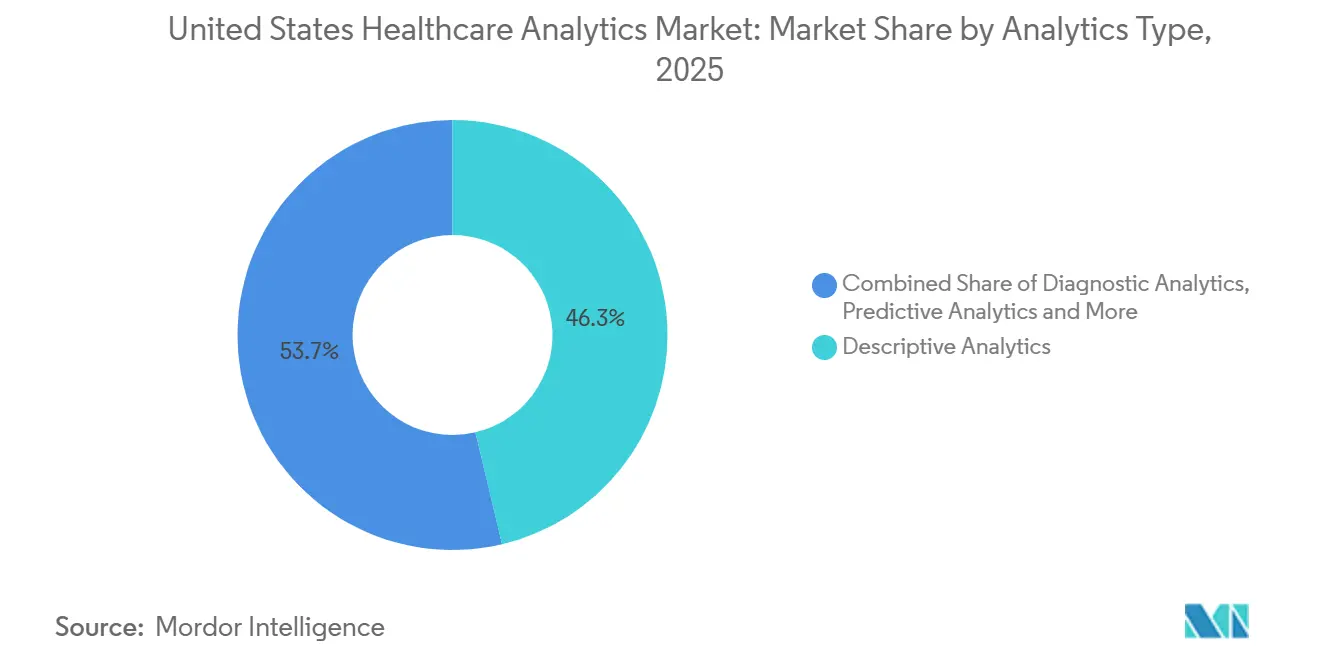
- By analytics type, descriptive analytics led with a 46.31% share in 2025, while predictive analytics is projected to expand at a 25.38% CAGR through 2031.
- By component, software held a 58.24% share in 2025, while services recorded the highest projected CAGR at 25.52% through 2031.
- By delivery mode, on-premise deployments accounted for a 46.52% share in 2025, while cloud-based delivery is expected to advance at a 26.25% CAGR through 2031.
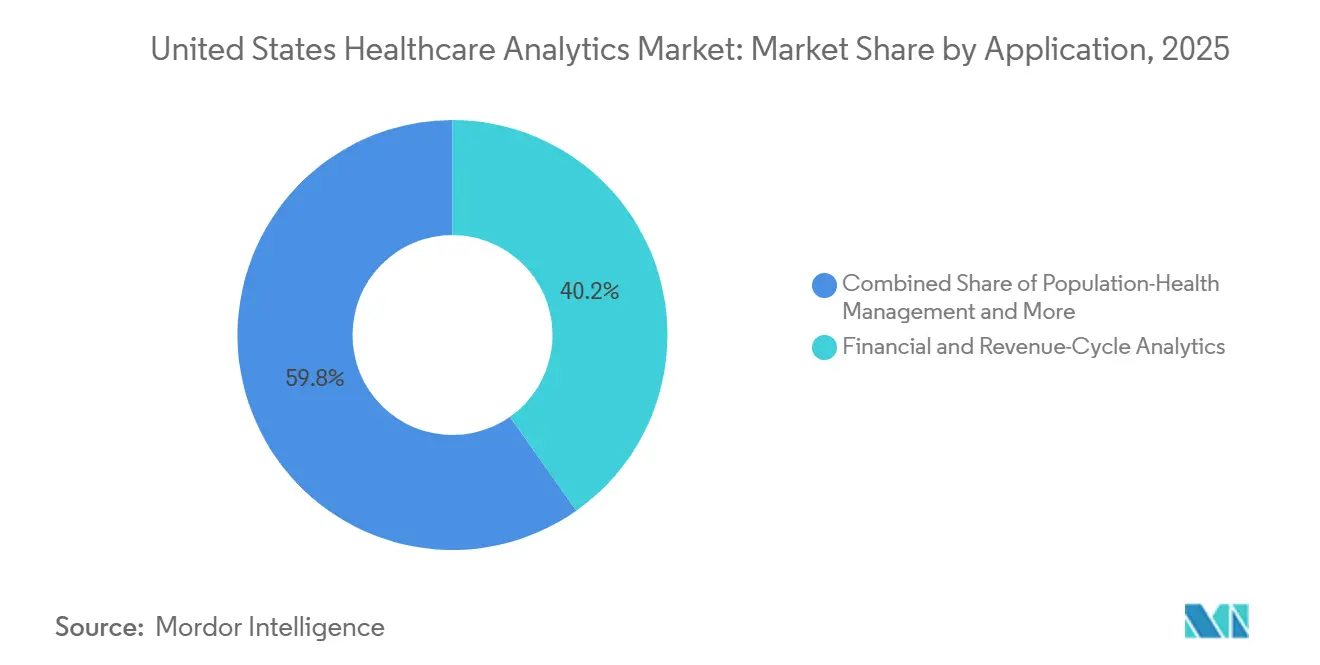
- By application, financial and revenue-cycle analytics captured a 40.24% share in 2025, while population-health management is forecast to grow at a 25.83% CAGR through 2031.
- By end user, life-science companies accounted for a 45.44% share in 2025, while healthcare providers are expected to expand at a 26.53% CAGR through 2031.
Note: Market size and forecast figures in this report are generated using Mordor Intelligence’s proprietary estimation framework, updated with the latest available data and insights as of January 2026.
United States Healthcare Analytics Market Trends and Insights
Drivers Impact Analysis*
| Driver | (~) % Impact on CAGR Forecast | Geographic Relevance | Impact Timeline |
|---|---|---|---|
| Value-Based Reimbursement And Quality-Measure Accountability | +4.5% | US-wide, highest in states with mature Medicare Advantage penetration, including CA, FL, TX, and NY | Medium term (2-4 years) |
| Rising Clinical, Claims, Imaging, And Operational Data Volumes | +3.8% | US-wide, acute care and academic medical centers leading data volume growth | Short term (≤ 2 years) |
| Margin Pressure And Revenue-Cycle Optimization Demand | +3.5% | US-wide, most acute in safety-net hospitals and rural health systems | Short term (≤ 2 years) |
| Cloud-Native AI And Self-Service Analytics Maturity | +4.2% | US-wide, concentrated in metro health systems with strong IT infrastructure | Short term (≤ 2 years) |
| Electronic Prior-Authorization API And Digital Quality Workflow Buildout | +2.8% | US-wide, mandated for CMS-regulated payers under CMS-0057-F effective January 2026 | Medium term (2-4 years) |
| TEFCA/FHIR-Based Cross-Enterprise Data Liquidity | +2.5% | US-wide, with early gains in states with stronger regional HIE maturity, including CA, MN, NY, and MA | Medium term (2-4 years) |
| Source: Mordor Intelligence | |||
Value-Based Reimbursement and Quality-Measure Accountability
The US healthcare analytics market is being pushed forward by payment reform that now requires more visible proof of cost and quality performance across Medicare programs. The CMS 2026 Physician Fee Schedule Final Rule makes clinician-level performance measurement more central to reimbursement design, which increases the practical need for platforms that can aggregate data across organizations and support provider reporting at a more granular level[1]Centers for Medicare & Medicaid Services, “Calendar Year (CY) 2026 Medicare Physician Fee Schedule Final Rule (CMS-1832-F),” CMS, cms.gov. This demand is not limited to providers because payers are also preparing for more value-based contract activity, with 70% of health plan respondents in the AHIP-CMS February 2026 survey expecting APM activity to increase during the next 24 months and 55% expecting the greatest growth in Category 3B shared-risk models. That dual pressure means the same contract now creates analytics demand on both sides of the healthcare payment chain. In the US healthcare analytics market, this is turning reimbursement compliance into a recurring software, services, and data integration opportunity instead of a one-time reporting exercise.
Cloud-Native AI and Self-Service Analytics Maturity
The US healthcare analytics market is also benefiting from technology shifts that lower the cost and skill threshold for deployment. Pre-trained clinical language models, low-code orchestration tools, and FHIR-native APIs are allowing mid-sized health systems to launch use cases that previously depended on dedicated data science teams. This has started to erode the protection that older platform incumbents once had, because hospitals with fewer than 400 beds can now access predictive and prescriptive capabilities without building a large in-house analytics function. The ONC 2026 Annual Meeting Report stated that 80% of US hospitals now use AI from EHR-developed tools for predicting health trajectories and 58% use AI to simplify billing, which was 15 percentage points higher than in 2023[2]Office of the National Coordinator for Health Information Technology, “2026 Annual Meeting, Progress on Interoperability and Ongoing Improvements,” HealthIT.gov, healthit.gov. In the US healthcare analytics market, that faster adoption is redirecting competition toward workflow fit, governance quality, and interoperability depth rather than broad claims about feature count.
Electronic Prior-Authorization API and Digital Quality Workflow Buildout
The US healthcare analytics market is receiving another push from the digital redesign of payer workflow infrastructure. The CMS Interoperability and Prior Authorization Final Rule required impacted payers, including Medicare Advantage, Medicaid FFS, CHIP, and Qualified Health Plan issuers, to implement FHIR R4 Prior Authorization APIs with near-real-time decision support effective January 1, 2026. This requirement creates a growing stream of structured data on coverage decisions, supporting clinical content, and denial patterns that can be reused in operational analytics. As those records accumulate, payer analytics teams gain more usable inputs for utilization review, exception management, fraud detection, and dispute analysis. In the US healthcare analytics market, organizations that connect these API feeds into enterprise data platforms earlier will hold a meaningful advantage in payer-provider workflow optimization.
TEFCA/FHIR-Based Cross-Enterprise Data Liquidity
The US healthcare analytics market is also gaining from a more standardized exchange environment across care settings. ONC reported that 80% of US hospitals either participated in TEFCA or planned to participate in 2025, including 43% already active and 37% planning, while 93% of hospitals had implemented FHIR-based APIs by 2024. This level of FHIR coverage reduces the need for custom interface work and allows vendors to deploy against more predictable data structures. It also shortens implementation cycles for health systems that need linked claims, clinical, and operational data across multiple institutions. A key gap remains in behavioral health, where only 31% of facilities were connected to a health information organization in 2024, and that leaves blind spots in longitudinal risk scoring for patients with mental health comorbidities.
Restraints Impact Analysis*
| Restraint | (~) % Impact on CAGR Forecast | Geographic Relevance | Impact Timeline |
|---|---|---|---|
| Cybersecurity And PHI Exposure Across Connected Ecosystems | -2.8% | National, with highest breach exposure in CA, GA, CT, FL, and TX | Short term (≤ 2 years) |
| Legacy Integration And Semantic Interoperability Gaps | -2.5% | National, most pronounced in rural health systems and behavioral health facilities | Medium term (2-4 years) |
| Patchwork State Privacy Rules Limiting Secondary Data Use | -1.8% | Multi-state analytics deployments, with CA, WA, TX, and CO among the most restrictive | Long term (≥ 4 years) |
| AI Validation And Governance Burden In Regulated Clinical Workflows | -2.2% | US-wide, with FDA Software as a Medical Device pathways adding compliance overhead for clinical AI | Medium term (2-4 years) |
| Source: Mordor Intelligence | |||
Cybersecurity and PHI Exposure Across Connected Ecosystems
The US healthcare analytics market faces a direct growth constraint from cyber exposure because every new data pipeline adds another point of vulnerability. Analytics environments now combine clinical, claims, imaging, and operational records from many systems, and that interconnected design widens the attack surface faster than many organizations can harden it. In 2025, 710 large breaches were reported to HHS-OCR and affected 61.5 million individuals, while 61.5% of exposed records were stored on network servers rather than in electronic medical records, which shows how often the breach path runs through data and middleware layers[3]HIPAA Journal, “2025 Healthcare Data Breach Report,” HIPAA Journal, hipaajournal.com. IBM reported that the average healthcare breach cost reached USD 7.42 million in 2025 and required a mean of 279 days to identify and contain, which was 38 days longer than the cross-industry average. In the US healthcare analytics market, this risk is delaying deployments, raising compliance costs, and favoring vendors that can prove stronger governance at the business-associate level.
AI Validation and Governance Burden in Regulated Clinical Workflows
The US healthcare analytics market is also slowed by the governance demands attached to clinical AI in regulated settings. AI-driven decision support in patient-facing workflows often requires longer validation cycles because safety review, model monitoring, and change control are more demanding than in administrative use cases. The problem is worsened by shadow AI adoption, since IBM reported that 1 in 5 healthcare organizations experienced a breach tied directly to unsanctioned AI tools and 97% of organizations with AI-model compromises lacked proper AI access controls. When clinical teams adopt stand-alone tools outside the formal governance stack, data lineage becomes less reliable and downstream model validation becomes harder. In the US healthcare analytics market, this shifts a larger share of spending toward governance tooling and away from faster production rollout of advanced clinical applications.
*Our forecasts treat driver/restraint impacts as directional, not additive. The impact forecasts reflect baseline growth, mix effects, and variable interactions.
Segment Analysis
By Analytics Type: Descriptive Dominance Signals a Latent Predictive Demand Pool
Descriptive analytics held 46.31% of US healthcare analytics market size in 2025, which shows that many organizations are still building reliable retrospective reporting before moving into more advanced model-led workflows. In the US healthcare analytics market, this concentration does not show a lack of ambition as much as it reflects the practical sequence of analytics maturity across providers and payers. Standardized reporting and dashboarding still form the operational base for quality measurement, utilization review, cost management, and executive decision support. Diagnostic and prescriptive tools remain less scaled because their value depends on cleaner source data, stronger governance, and higher trust in model outputs.
Predictive analytics is the fastest-growing segment at a 25.38% CAGR through 2031, and that growth is tied more to reimbursement and risk exposure than to pure technology novelty. The US healthcare analytics industry is moving toward earlier identification of high-cost cohorts, care gaps, and utilization risk because descriptive reporting alone cannot support mandatory risk contracting. Cognitive and augmented analytics adds another layer to this shift because peer-reviewed work in 2026 showed growing capability for multi-step clinical reasoning and enterprise-scale pattern detection. The DxDirector framework published in Nature Communications in April 2026 demonstrated full-process clinical diagnosis across multi-step reasoning chains, while npj Precision Oncology published evidence that EHR-based predictive models achieved clinical-grade early cancer detection performance across 26 cancer types. As these validations accumulate, the US healthcare analytics market is likely to reward vendors that offer cognitive capability as part of an enterprise platform instead of a disconnected group of point solutions.


By Component: Software Consolidation Masks a Services Inflection
Software commanded a 58.24% share in 2025, reflecting how enterprise buyers continue to prefer integrated suites with pre-built EHR connectors over fragmented point tools. In the US healthcare analytics market, that pattern has favored vendors with deeper Epic and Oracle Health alignment because integration friction remains a major buying criterion. Hardware represented a smaller part of spending as more mid-tier organizations shifted away from local compute-heavy architectures and reduced incremental investment in physical infrastructure. The US healthcare analytics industry therefore shows a component mix where platform ownership matters, but surrounding enablement work still shapes realized value.
Services is the fastest-growing component at a 25.52% CAGR through 2031 because many health systems have data but still lack the internal teams needed to operationalize it at scale. This is not only a talent issue, because the regulatory burden attached to data normalization, interoperability, and workflow compliance is also creating recurring service demand. ONC’s 2026 materials noted that USCDIv3 requirements effective January 1, 2026 covered 94 data elements, which increases the ongoing need for implementation, mapping, and governance work beyond initial software deployment. In the US healthcare analytics market, service providers that combine managed analytics operations with compliance automation are likely to retain clients more effectively than firms that rely on project consulting alone. This keeps software in the lead today, but it also explains why services is becoming a faster growth engine inside the broader market.
By Delivery Mode: On-Premise Holdout Creates a Cloud Migration Opportunity Asymmetry
On-premise deployments held 46.52% of US healthcare analytics market share in 2025, and that position remained strongest in government-linked facilities, academic medical centers, and large delivery networks with legacy investments. In the US healthcare analytics market, this was less a sign of simple IT caution and more a result of data sovereignty rules, institutional control preferences, and substantial sunk costs in existing analytics environments. Hybrid delivery has been gaining ground because it allows organizations to keep sensitive data local while shifting more compute-intensive model training and scaling tasks to the cloud. Cloud-based delivery is the fastest-growing mode at a 26.25% CAGR through 2031, supported by cloud-native clinical data lake designs and wider use of FHIR-compliant APIs.
The competitive pressure on on-premise models is growing because cloud platforms now offer direct access to adjacent services that are difficult and costly to recreate internally. Natural language processing, large language model inference, streaming analytics, and shared development environments fit more easily inside hyperscale ecosystems than in isolated local deployments. That advantage matters in the US healthcare analytics market because organizations increasingly want one environment that can support administrative automation, clinical modeling, and longitudinal data integration together. The result is a widening gap between systems that can adopt cloud extensions quickly and systems that remain constrained by older infrastructure choices. This does not remove on-premise demand, but it does make cloud migration a more urgent strategic decision over the forecast period.
By Application: Revenue-Cycle Dominance Conceals a Population-Health Investment Lag
Financial and revenue-cycle analytics accounted for 40.24% of US healthcare analytics market size in 2025, showing that buyers still respond fastest to use cases with clear and auditable financial returns. In the US healthcare analytics market, billing disputes, denial management, coding accuracy, and payment recovery generate a direct spending pull that many clinical analytics programs still struggle to match. This spending pattern reflects financial pressure across the provider base, especially where margins are thin and cash collection speed matters. It also shows that many organizations continue to prioritize immediate operational gains before making broader investments in long-horizon clinical transformation.
Population-health management is the fastest-growing application at a 25.83% CAGR through 2031, and that growth reflects the widening need to manage risk across chronic care populations under value-based arrangements. As providers take on more accountability for utilization, outcomes, and care coordination, analytics investment is shifting toward cohort identification, care gap closure, and longitudinal monitoring. Fraud detection and risk analytics is also drawing renewed attention as linked data environments make it easier to identify abnormal billing and utilization patterns across enterprises. Clinical analytics continues to trail financial analytics in realized budget share, but the reporting demands attached to clinician-level quality measurement are likely to narrow that gap over time. In the US healthcare analytics market, application demand is therefore moving from pure revenue protection toward a broader blend of financial control, clinical accountability, and population management.
By End User: Life-Science Sophistication Sets the Benchmark That Providers Must Now Match
Life-science companies held 45.44% of US healthcare analytics market share in 2025, reflecting their longer history with real-world evidence, launch analytics, pharmacovigilance, and data-intensive regulatory processes. In the US healthcare analytics market, life-science buyers remain more mature than most provider groups because they have operated with complex evidence requirements for many years. Datavant’s AWS-powered Connect platform, which became broadly available in November 2025, expanded this environment by linking 4 top-20 pharmaceutical companies with 15 leading real-world data sources inside a cloud-first, privacy-preserving architecture. Payers remained another major end-user group because risk stratification, care gap management, and contract performance measurement are now central to value-based economics.
Healthcare providers are the fastest-growing end-user category at a 26.53% CAGR through 2031 as reimbursement design makes analytics a contractual requirement rather than an optional support tool. The US healthcare analytics industry is therefore entering a phase where providers must close part of the analytics maturity gap that separated them from life-science buyers for years. Public health agencies remain a smaller segment, but they still provide important disease-burden and surveillance datasets that other buyer groups use for normalization and benchmarking. Provider growth will depend heavily on how quickly mid-tier and rural systems improve platform integration, governance practice, and internal analytics skills. In the US healthcare analytics market, that change will decide how far advanced capabilities spread beyond large IDNs and academic medical centers.
Geography Analysis
The US healthcare analytics market shows strong regional variation, and the Northeast remains one of the most data-rich environments because Massachusetts, New York, and Connecticut combine academic medical centers, large payers, and life-science real-world evidence activity. In this part of the US healthcare analytics market, vendors benefit from dense institutional networks and stronger exchange maturity, which supports multi-modal analytics linking clinical, claims, and genomic records. New York and Connecticut together accounted for more than 12.6 million individuals affected by healthcare data breaches in 2025, which shows how advanced data exchange also raises exposure when governance controls do not keep pace. The Northeast also benefits from stronger regional health information exchange participation and TEFCA-linked connectivity, which improves data liquidity for enterprise analytics deployments. That makes the region attractive for vendors selling higher-value platforms that depend on cross-institution integration.
The South and Southeast represent another important zone in the US healthcare analytics market because Florida, Texas, and Georgia combine rapid APM expansion with large insured populations and high operational complexity. This region is drawing strong population-health and contract analytics demand because Medicare Advantage enrollment is large and value-based reimbursement pressure is rising. At the same time, breach exposure has been elevated, with Georgia alone accounting for more than 16 million affected individuals in 2025, largely because of the Aflac incident. That pairing of demand growth and cyber vulnerability gives vendors with embedded HIPAA-compliant governance tools a clearer advantage than firms offering stand-alone analytics layers. In the US healthcare analytics market, buyers in the South are therefore more likely to evaluate analytics and security readiness together.
The Midwest and West present different maturity patterns across the US healthcare analytics market. Midwestern health systems in states such as Ohio, Illinois, and Michigan are dealing with consolidation, which increases demand for platforms that can standardize data models and performance benchmarks across merged entities. The West Coast, especially California and the San Francisco Bay Area, functions as a development center for cloud-native healthcare analytics tools because of its concentration of digital health companies, academic computing capacity, and investment capital. California reported 69 breaches in 2025, the highest state count, which reflects a highly connected healthcare data environment where advanced analytics activity and regulatory scrutiny continue to rise together. In practical terms, the US healthcare analytics market remains national in scale, but vendor strategy still needs to reflect these regional differences in data maturity, payment models, security exposure, and policy environment.
Competitive Landscape
The US healthcare analytics market is moderately concentrated, and no single vendor controls the full space across providers, payers, and life-science customers. EHR-linked incumbents such as Epic Systems and Oracle Health retain an advantage because they can extend analytics into clinical workflows that are already deeply embedded inside customer operations. In the US healthcare analytics market, that creates bundle economics that can pressure pure-play platforms on total ownership cost even when functionality looks comparable. Pure-play vendors such as Health Catalyst, Innovaccer, and MedeAnalytics compete by offering faster deployment across mixed EHR environments and deeper specialization in specific analytics workflows. Data-network players such as Datavant and Komodo Health compete differently because their value grows as more organizations connect to the same data ecosystem.
A major strategic pattern in the US healthcare analytics market is the shift toward integrated clinical, financial, and administrative capabilities rather than isolated analytics tools. Datavant strengthened that position in November 2025 when it expanded its AWS-backed Connect platform to support privacy-preserving health data discovery across pharmaceutical and real-world data partners. GeneDx and Komodo Health also partnered in January 2026 to build a longitudinal rare-disease dataset that links genomic and patient-journey data, which shows how strategic value is moving toward linked, reusable evidence environments. Truveta added another competitive signal in April 2026 when it introduced Truveta Intelligence, reinforcing the push toward scaled AI-enabled analytics applications built on large clinical data assets.
Advanced AI is becoming more relevant inside the US healthcare analytics market, but buyers are still weighing utility against governance demands. A March 2026 paper in the Proceedings of the AAAI Conference on Artificial Intelligence reported that the Delphi neuro-symbolic framework achieved a 10.4% safety advantage over historical physician treatment decisions in critical care and reached an 86.8% adoption rate in blinded physician evaluations. That type of clinical validation raises the ceiling for future contract value, especially for vendors that can connect model output directly to workflow action. At the same time, white-space opportunities remain strongest in behavioral health, rural health systems, and cross-enterprise fraud analytics because these areas still have weaker data infrastructure or lower connection rates. The US healthcare analytics market therefore remains competitive, but the strongest positions are forming around integrated workflow coverage, scalable data networks, and credible governance rather than stand-alone analytics claims.
United States Healthcare Analytics Industry Leaders
Optum, Inc.
Oracle Health
Epic Systems Corporation
IQVIA Holdings Inc.
Inovalon, Inc.
- *Disclaimer: Major Players sorted in no particular order

Recent Industry Developments
- March 2026: Milliman MedInsight (MedInsight) announced a series of ongoing enhancements to its Value-Based Care (VBC) Platform, reinforcing its commitment to helping payers, providers, and accountable care organizations navigate the increasing complexity of value-based payment models.
- January 2026: GeneDx and Komodo Health partner to build the most comprehensive longitudinal rare-disease dataset, linking GeneDx's Infinity genomic data with Komodo's Healthcare Map to deliver full patient-journey visibility across rare-disease diagnosis, treatment, and outcomes.


United States Healthcare Analytics Market Report Scope
As per the scope of the report, healthcare Analytics is the systematic analysis of data related to healthcare services, providers, and patients to improve health outcomes, enhance healthcare delivery, optimize operational efficiency, and support decision-making. It involves collecting, processing, and analyzing large volumes of healthcare data to identify patterns, trends, and insights that can inform clinical, financial, and administrative strategies.
The segmentation for the United States healthcare analytics market is categorized by analytics type, component, delivery mode, application, and end user. By analytics type, the market includes descriptive analytics, diagnostic analytics, predictive analytics, prescriptive analytics, and cognitive/augmented analytics. By component, it is segmented into hardware, software, and services. By delivery mode, the market is divided into on-premise, cloud-based, and hybrid. By application, it covers clinical analytics, financial and revenue-cycle analytics, operational and administrative analytics, population-health management, fraud detection and risk analytics, and life-sciences/R&D analytics. By end user, the market includes healthcare providers, healthcare payers, life-science companies, and public health agencies. For each segment, the market size and forecast are provided in terms of value (USD).
| Descriptive Analytics |
| Diagnostic Analytics |
| Predictive Analytics |
| Prescriptive Analytics |
| Cognitive / Augmented Analytics |
| Hardware |
| Software |
| Services |
| On-Premise |
| Cloud-Based |
| Hybrid |
| Clinical Analytics |
| Financial & Revenue-Cycle Analytics |
| Operational & Administrative Analytics |
| Population-Health Management |
| Fraud Detection & Risk Analytics |
| Life-Sciences / R&D Analytics |
| Healthcare Providers |
| Healthcare Payers |
| Life-Science Companies |
| Public Health Agencies |
| By Analytics Type | Descriptive Analytics |
| Diagnostic Analytics | |
| Predictive Analytics | |
| Prescriptive Analytics | |
| Cognitive / Augmented Analytics | |
| By Component | Hardware |
| Software | |
| Services | |
| By Delivery Mode | On-Premise |
| Cloud-Based | |
| Hybrid | |
| By Application | Clinical Analytics |
| Financial & Revenue-Cycle Analytics | |
| Operational & Administrative Analytics | |
| Population-Health Management | |
| Fraud Detection & Risk Analytics | |
| Life-Sciences / R&D Analytics | |
| By End User | Healthcare Providers |
| Healthcare Payers | |
| Life-Science Companies | |
| Public Health Agencies |


Key Questions Answered in the Report
What is the 2031 value forecast for US healthcare analytics?
The US healthcare analytics market is projected to reach USD 80.14 billion by 2031, rising from USD 28.18 billion in 2026 at a 23.25% CAGR.
Which analytics type leads current demand in the United States?
Descriptive analytics led in 2025 with a 46.31% share because many healthcare organizations are still standardizing reporting and dashboard foundations before scaling predictive use cases.
Which part of the value chain is adopting fastest?
Healthcare providers are expanding fastest among end users, with a projected 26.53% CAGR through 2031 as CMS-linked accountability and risk contracting make analytics more necessary.
Why is cloud delivery gaining traction so quickly?
Cloud-based delivery is forecast to grow at a 26.25% CAGR through 2031 because it reduces deployment barriers and gives buyers easier access to AI, interoperability tools, and scalable compute.
What is the biggest application area today?
Financial and revenue-cycle analytics held the largest application share at 40.24% in 2025 because denial management, billing optimization, and payment accuracy deliver direct and measurable ROI.
What is the main risk slowing adoption across healthcare organizations?
Cybersecurity remains the most immediate drag because 710 large breaches affected 61.5 million individuals in 2025, and IBM placed the average healthcare breach cost at USD 7.42 million.
Page last updated on:


