Healthcare Prescriptive Analytics Market Size and Share
Market Overview
| Study Period | 2020 - 2031 |
|---|---|
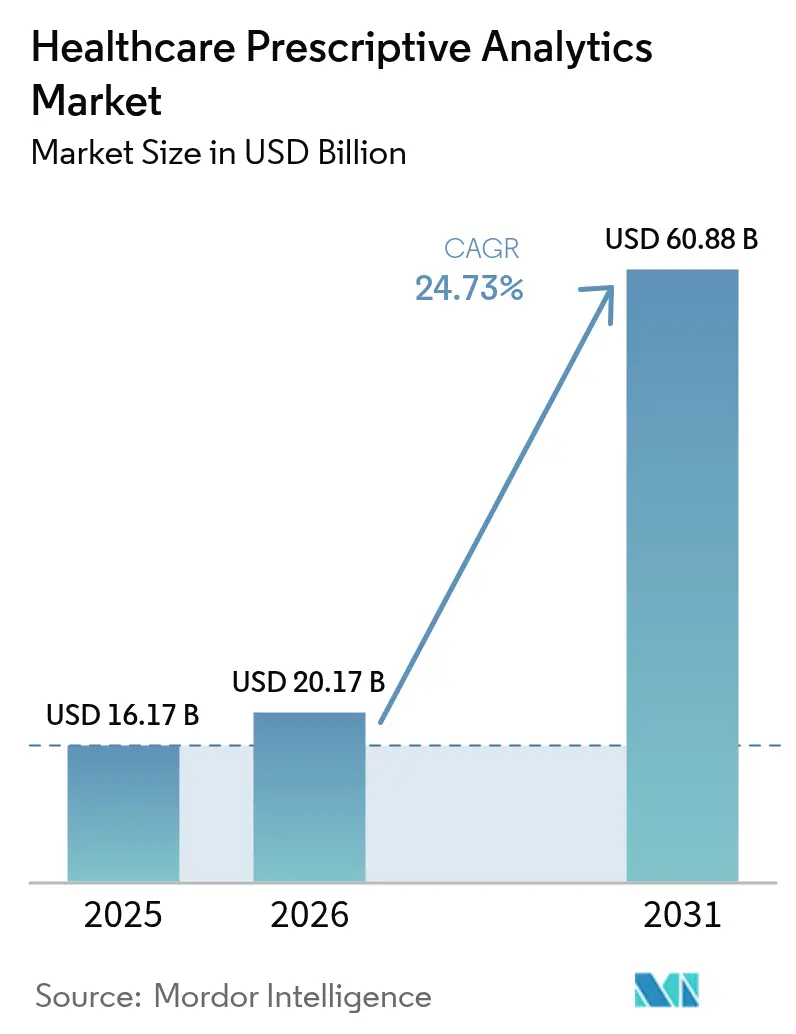
| Market Size (2026) | USD 20.17 Billion |
| Market Size (2031) | USD 60.88 Billion |
| Growth Rate (2026 - 2031) | 24.73% CAGR |
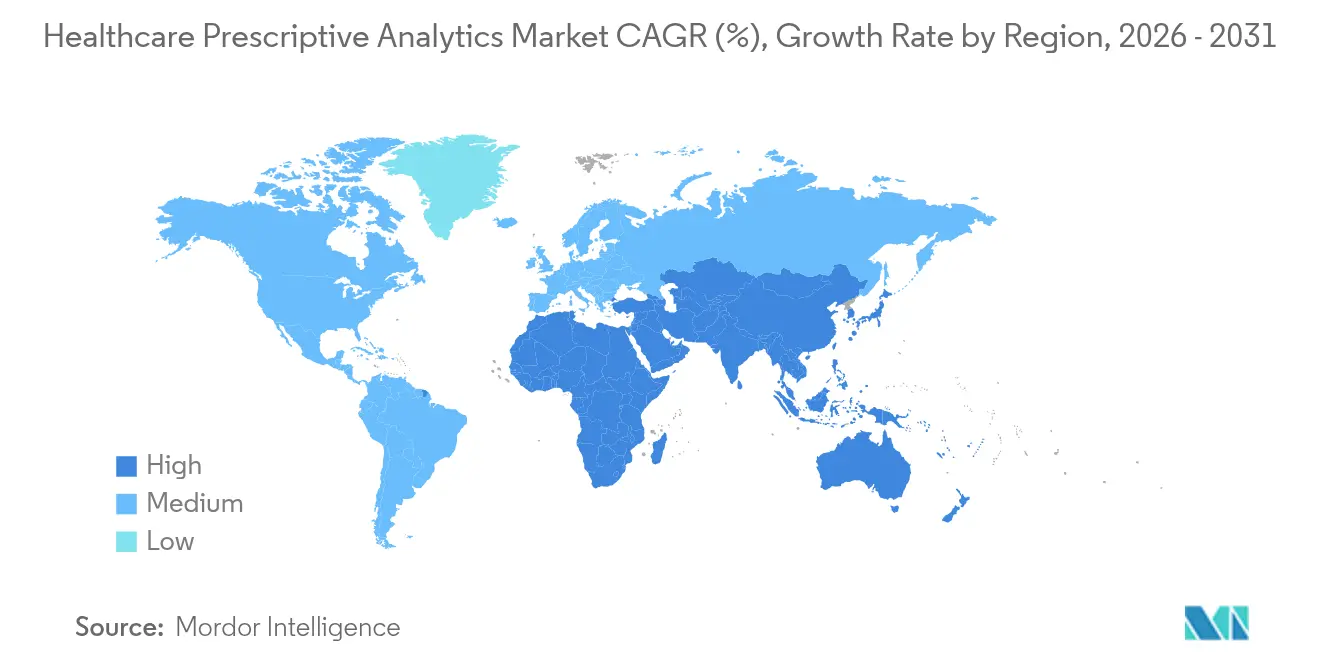
| Fastest Growing Market | Asia Pacific |
| Largest Market | North America |
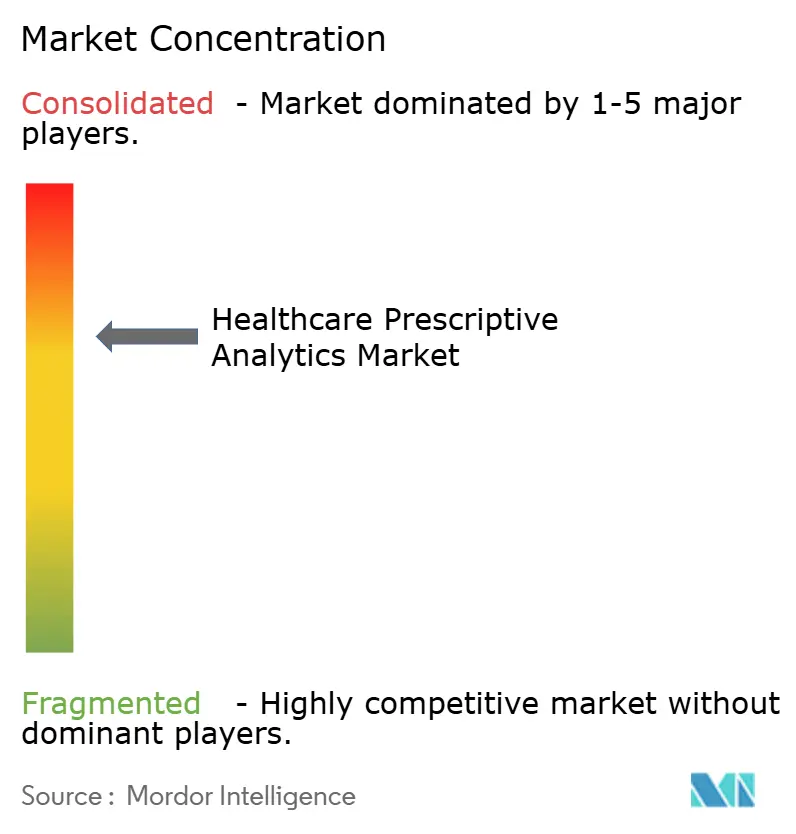
| Market Concentration | Medium |
Major Players *Disclaimer: Major Players sorted in no particular order Image © Mordor Intelligence. Reuse requires attribution under CC BY 4.0. | |
Healthcare Prescriptive Analytics Market Analysis by Mordor Intelligence
Healthcare Prescriptive Analytics market size in 2026 is estimated at USD 20.17 billion, growing from 2025 value of USD 16.17 billion with 2031 projections showing USD 60.88 billion, growing at 24.73% CAGR over 2026-2031.
Growth is propelled by real-time prescription benefit mandates, the rapid uptake of patient digital twins, and the integration of artificial intelligence into everyday clinical workflows. Vendors that pair advanced algorithms with deep clinical workflow knowledge gain an edge, while cloud scalability, hybrid deployment options, and robust security frameworks shape purchasing decisions. Competitive activity intensifies as established electronic health record (EHR) providers race against cloud-native newcomers, and acquisition momentum signals a shift toward integrated analytics platforms.
Key Report Takeaways
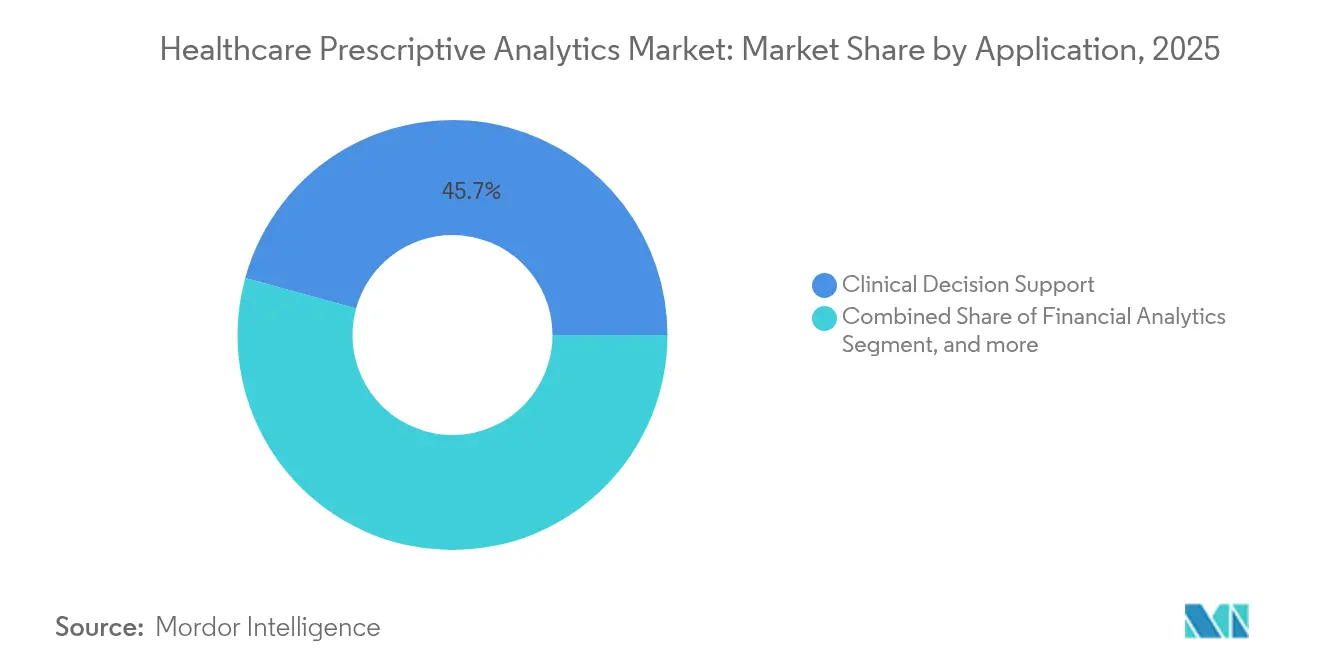
- By application, clinical decision support held 45.72% of the healthcare prescriptive analytics market share in 2025; research & population health analytics is projected to expand at a 26.31% CAGR through 2031.
- By product, services accounted for 63.77% of the healthcare prescriptive analytics market size in 2025 and are advancing at a 26.03% CAGR to 2031.
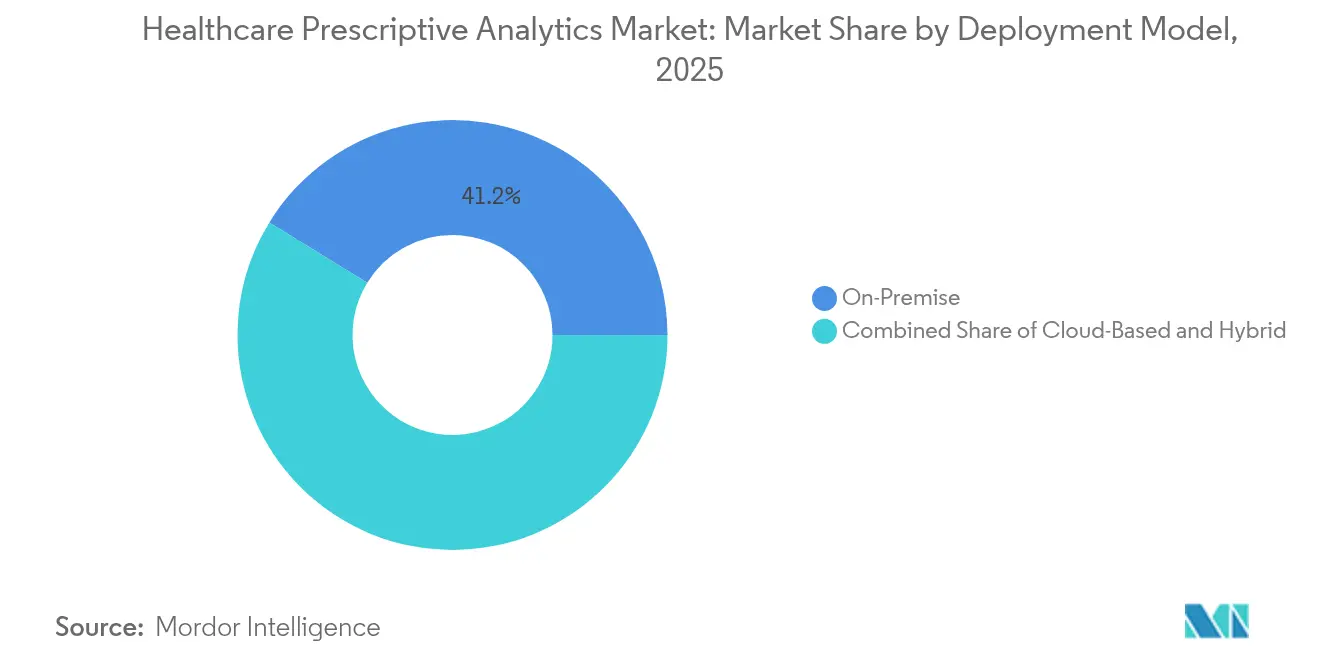
- By deployment model, on-premise solutions led with 41.23% revenue share in 2025, while cloud-based platforms post the highest projected CAGR of 28.33% through 2031.
- By end user, healthcare providers commanded 64.78% of 2025 revenue; pharmaceutical and life-sciences companies recorded the fastest growth, at a 24.93% CAGR.
- By geography, North America contributed 40.45% of total revenue in 2025, yet Asia-Pacific is forecast to grow at 29.70% CAGR through 2031.
Note: Market size and forecast figures in this report are generated using Mordor Intelligence’s proprietary estimation framework, updated with the latest available data and insights as of 2026.
Global Healthcare Prescriptive Analytics Market Trends and Insights
Drivers Impact Analysis*
| Driver | (~) % Impact on CAGR Forecast | Geographic Relevance | Impact Timeline |
|---|---|---|---|
| Integration of big data and AI in healthcare | +8.2% | North America and Europe | Medium term (2-4 years) |
| Cost containment and operational efficiency needs | +6.8% | North America | Short term (≤ 2 years) |
| Incentives for value-based care and outcome reimbursement | +5.4% | North America, expanding in Europe | Medium term (2-4 years) |
| Rise of patient digital twins for therapy optimization | +3.7% | North America and Europe | Long term (≥ 4 years) |
| Real-time prescription benefit mandates | +2.9% | United States, spillover to Canada | Short term (≤ 2 years) |
| Growing chronic disease burden | +4.1% | Developed markets worldwide | Long term (≥ 4 years) |
| Source: Mordor Intelligence | |||
Integration of Big Data and AI in Healthcare
Health systems recognize that traditional analytics cannot process the velocity and complexity of genomic data, continuous monitoring feeds, and unstructured clinical notes. Platforms that fuse large-scale data pipelines with artificial intelligence now deliver prescriptive recommendations in real time. Epic Systems’ 2024 release of its AI Trust and Assurance Suite gives hospitals tools to test and monitor algorithm performance before clinical deployment. As these capabilities mature, clinicians transition from retrospective reporting to point-of-care interventions that personalize treatment based on patient-specific risk signals. Early adopters report higher diagnostic accuracy and targeted therapeutic selection, provided data quality and workflow integration hurdles are addressed.
Growing Need for Cost Containment and Operational Efficiency
Labor costs approach 50% of total hospital expenses while patient volumes remain volatile. Prescriptive analytics models shorten revenue-cycle timelines, optimize staffing rosters, and reduce supply chain waste. The American Hospital Association estimates that 25% of U.S. healthcare spending is lost to administrative inefficiencies.[1]American Hospital Association, “Administrative Simplification Studies,” aha.org Real-time location systems coupled with analytics dashboards keep track of beds, clinicians, and high-value equipment, enabling dynamic resource allocation that lowers operational expenses and frees capacity for higher-acuity cases.
Incentives for Value-Based Care and Outcome-Focused Reimbursement
By 2030, the Centers for Medicare & Medicaid Services aims to place every Medicare beneficiary in an accountable care relationship. Organizations in such models already report 30.1% fewer inpatient admissions compared with fee-for-service cohorts.[2]Centers for Medicare & Medicaid Services, “Strategic Plan 2025–2030,” cms.gov To meet stringent quality benchmarks, providers are embedding prescriptive analytics that stratify risk, surface care gaps, and recommend targeted interventions based on social determinants of health. The global expansion of value-based contracts accelerates demand for platforms that couple financial incentives with measurable clinical outcomes.
Rise of Patient Digital Twins for Therapy Optimization
Digital twin technology synthesizes EHR data, wearable sensor feeds, and genomic profiles to create virtual replicas of individual patients. Mayo Clinic’s digital twin pilots illustrate how oncologists can simulate multiple treatment regimens and select the course with the highest projected efficacy.[3]Mayo Clinic Platform, “Digital Twin Initiative,” mayoclinicplatform.org As regulatory confidence in model accuracy increases, digital twins are poised to transform cardiology, oncology, and chronic disease management by forecasting therapy response before initiating treatment.
Restraints Impact Analysis*
| Restraint | (~) % Impact on CAGR Forecast | Geographic Relevance | Impact Timeline |
|---|---|---|---|
| Data security and HIPAA/GDPR compliance | -4.3% | Europe and North America | Short term (≤ 2 years) |
| Analytics talent shortage in clinical settings | -3.8% | Worldwide, acute in developing markets | Medium term (2-4 years) |
| Model explainability limits physician trust | -2.9% | Europe | Medium term (2-4 years) |
| High up-front investment costs | -2.1% | Emerging markets, small providers | Short term (≤ 2 years) |
| Source: Mordor Intelligence | |||
Data Security and Compliance Challenges
The European Union’s Artificial Intelligence Act now classifies clinical AI as high-risk, mandating transparency and oversight. Simultaneously, the European Health Data Space regulation approved in March 2025 introduces cross-border sharing rules while preserving patient privacy. These frameworks raise compliance hurdles, forcing vendors to hard-wire audit trails, consent engines, and de-identification modules into analytics platforms. Hospitals that lack robust privacy controls face implementation delays and potential penalties.
Shortage of Analytics Talent in Clinical Settings
Healthcare organizations compete with technology firms for data scientists capable of blending statistical expertise with clinical knowledge. Smaller hospitals often rely on external managed services, elevating deployment costs and slowing internal capability building. Healthcare organizations increasingly compete with technology companies for data science talent, driving up compensation costs and creating retention challenges. The shortage particularly affects smaller healthcare systems that cannot offer competitive packages or advanced analytics career paths. This talent gap forces organizations to rely heavily on external consultants and managed services, increasing implementation costs and creating dependency on third-party expertise. The constraint becomes more pronounced as analytics requirements become more sophisticated, requiring specialized knowledge of clinical workflows, regulatory requirements, and healthcare-specific data challenges that traditional data scientists may lack.
*Our forecasts treat driver/restraint impacts as directional, not additive. The impact forecasts reflect baseline growth, mix effects, and variable interactions.
Segment Analysis
By Application: Clinical Workflows Drive Market Leadership
Clinical Decision Support applications generated the most significant revenue in 2025, capturing 45.72% of the healthcare prescriptive analytics market. Hospitals prioritize decision support to reduce medication errors and standardize evidence-based protocols, while funding initiatives such as the U.S. real-time prescription benefit program stimulate adoption at the point of care. Research & Population Health Analytics is the fastest-growing application, expanding at a 26.31% CAGR as payers and providers shift toward proactive, community-level interventions. Population-scale datasets such as Epic Cosmos, which holds de-identified records for more than 246 million individuals, illustrate the scale required to model disease patterns and inform public-health actions.
The convergence of individual-level decision support with population analytics lets organizations derive insights across macro and micro lenses. Integrated platforms that map care pathways for single patients and entire cohorts are increasingly favored, supporting both treatment personalization and regional health-planning efforts.


By Product: Services Dominate Implementation Landscape
Services accounted for 63.77% of the healthcare prescriptive analytics market size in 2025 and are forecast to post a 26.03% CAGR through 2031. Complex regulatory frameworks, legacy EHR environments, and clinician adoption hurdles make implementation know-how more valuable than the underlying software. Software licenses remain essential yet are frequently bundled with long-term advisory and managed services agreements. Hardware spending focuses on high-performance storage and GPUs that support training and inference workloads.
Health systems such as Duke Health have entered multi-year partnerships with analytics vendors to access specialized expertise while reducing internal burdens. These service-oriented models provide hospitals with sustained guidance on model governance, workflow redesign, and change management.
By Deployment Model: Cloud Migration Accelerates Despite Security Concerns
On-premise installations held 41.23% revenue share in 2025, reflecting ongoing anxiety about clinical data security. Yet cloud-based solutions exhibit a 28.33% CAGR as pay-for-use compute, elastic storage, and continuous updates outweigh perceived risks. Hybrid architectures, where sensitive identifiers stay in local data centers while de-identified information processes in the cloud, are now standard. PwC highlights that modernizing electronic health records through cloud services bolsters scalability and enables advanced analytics applications.
Hospitals balancing performance with privacy increasingly adopt zero-trust frameworks and bring-your-own-key encryption to satisfy regulatory mandates while still benefiting from cloud economics.
By End User: Pharma Drives Innovation While Providers Dominate Volume
Providers represented 64.78% of 2025 revenue thanks to extensive patient volumes and the clinical urgency of timely decision support. Pharmaceutical and life-sciences firms, however, achieve a 24.93% CAGR through 2031 as they apply AI to accelerate drug-discovery pipelines and generate real-world evidence. Accenture calculates that AI-enabled discovery can shave several years off traditional timelines, generating profound cost savings. Payers focus on fraud detection and risk adjustment analytics, whereas public-health agencies harness large-scale data to monitor outbreaks and guide policy.
The overlap between clinical and research analytics deepens as pharma uses provider-generated real-world data to validate therapeutic effectiveness, creating symbiotic data-sharing models that amplify demand for secure, interoperable platforms.
Geography Analysis
North America generated 40.45% of global sales in 2025. The United States sets the pace with mandatory real-time prescription benefit implementation scheduled for full rollout by 2027, which embeds analytic rules directly into e-prescribing workflows. Over 620,000 U.S. prescribers already use real-time prescription benefit tools. Canada’s provincial health programs invest in data interoperability, and Mexico’s private hospital chains deploy analytics-enabled revenue cycle platforms to counterbalance rising operating expenses.
Europe prioritizes data privacy and model transparency. The European Health Data Space allocates EUR 810 million to create a secure environment for secondary data use, enabling researchers and clinicians to exchange anonymized datasets across borders. Germany, the United Kingdom, and France devote national funding to hospital digitalization and AI pilots. Compliance with the EU Artificial Intelligence Act spurs demand for audit-ready platforms that log every algorithmic recommendation.
Asia-Pacific is the quickest-expanding region, advancing at a 29.70% CAGR. China’s local governments subsidize AI-enhanced hospital systems, Japan’s aging population drives telemedicine and analytics investment, and India’s National Digital Health Mission underwrites data-exchange infrastructure. Australia and South Korea fund precision-medicine projects that rely on longitudinal datasets, while Singapore acts as a test-bed for regional AI governance frameworks. Brazil’s 2024 Clinical Research Law accelerates approvals for digital health studies, drawing analytics vendors into Latin America.

Competitive Landscape
The healthcare prescriptive analytics market contains a mix of incumbent health-IT providers, cloud hyperscalers, and focused analytics specialists. Epic Systems leverages its dominant EHR footprint to embed AI models inside clinician workflows, while IBM Merative applies natural-language processing to unstructured data. Cloud-native entrants emphasize elastic scalability and microservice architectures, differentiating through rapid deployment cycles and pay-as-you-grow pricing.
Strategic alliances are common. Duke Health’s collaboration with SAS showcases health system–vendor partnerships that combine domain expertise with advanced analytical tooling. Private equity activity signals confidence in scalability: KKR’s USD 11 billion investment in Cotiviti funds expansion into multi-payer analytics solutions. M&A momentum continues as Oracle explores a USD 1 billion purchase of Veradigm and McKesson finalizes its USD 850 million acquisition of PRISM Vision Holdings.
Product roadmaps now focus on model explainability dashboards, synthetic-data generation, and low-code authoring tools to let clinicians craft bespoke rules without programming skills. Vendors that secure robust data-ingestion pipelines, comply with evolving regulations, and embed prescriptive insights into native clinical workflows are positioned to capture long-term share.
Healthcare Prescriptive Analytics Industry Leaders
Allscripts Healthcare Solutions
Oracle Corporation
IBM
McKesson Corporation
Epic Systems Corporation
- *Disclaimer: Major Players sorted in no particular order

Recent Industry Developments
- May 2025: Epic Systems launched 20 AI-powered programs, including MyChart agents that guide patients through self-care tasks and automated insurance eligibility checks that cut administrative processing times.
- April 2025: McKesson completed its USD 850 million acquisition of an 80% stake in PRISM Vision Holdings, expanding analytics capabilities for biopharma partnerships.
- September 2024: Oracle Health enhanced its platform with voice commands for patient-record access and facial-recognition logins, underscoring its full-suite AI approach.
- May 2024: Health Catalyst introduced Ignite, a healthcare-focused data ecosystem featuring advanced governance and modular analytics services.
- February 2024: Cotiviti closed a recapitalization led by KKR and Veritas Capital to accelerate innovation in payment accuracy and quality analytics.


Research Methodology Framework and Report Scope
Market Definitions and Key Coverage
Our study defines the healthcare prescriptive analytics market as the revenue generated from software, hardware accelerators, and managed services that turn multifaceted clinical, financial, and operational data into step-by-step recommendations that improve outcomes and efficiency across providers, payers, and life-science organizations. According to Mordor Intelligence, this span covers decision-support modules, financial optimization engines, and workflow tools delivered through on-premise, cloud, and hybrid deployments worldwide.
Scope Exclusion: Point solutions that only visualize trends or run retrospective predictive models without recommending concrete next steps are outside the baseline.
Segmentation Overview
- By Application
- Clinical Decision Support
- Financial Analytics
- Administrative / Operational Analytics
- Research & Population Health Analytics
- By Product
- Hardware
- Software
- Services
- By Deployment Model
- On-Premise
- Cloud-Based
- Hybrid
- By End User
- Healthcare Providers
- Healthcare Payers
- Pharmaceutical & Life-Sciences Companies
- Government & Public-Health Agencies
- By Geography
- North America
- United States
- Canada
- Mexico
- Europe
- Germany
- United Kingdom
- France
- Italy
- Spain
- Rest of Europe
- Asia-Pacific
- China
- Japan
- India
- Australia
- South Korea
- Rest of Asia-Pacific
- Middle East & Africa
- GCC
- South Africa
- Rest of Middle East & Africa
- South America
- Brazil
- Argentina
- Rest of South America
- North America
Detailed Research Methodology and Data Validation
Primary Research
Mordor analysts interviewed hospital CTOs, payer actuarial leads, and health-IT channel partners across North America, Europe, Asia-Pacific, and the Middle East to validate uptake drivers, average selling prices, and typical deployment depths. Follow-up web surveys captured emerging use cases and near-term budget intentions that closed information gaps identified during desk work.
Desk Research
We mapped the global care-delivery and insurance landscape through open datasets such as CMS Cost Reports, OECD Health Statistics, WHO Global Health Expenditure, and draft European Health Data Space regulations, which supplied spending pools, bed counts, and EHR penetration clues. Trade bodies like HIMSS, the American Hospital Association, and the International Federation of Health Plans revealed adoption ratios, while Questel patent abstracts signaled algorithmic innovation velocity. Company filings on D&B Hoovers and news archives on Dow Jones Factiva let us benchmark vendor revenue splits between prescriptive and broader analytics lines. The sources noted are illustrative, and many additional public records and industry portals were used to cross-verify figures and narratives.
Market-Sizing & Forecasting
We begin with a top-down translation of regional health-IT spending into a prescriptive analytics addressable pool using indicators such as inpatient admissions, cloud workload share, value-based reimbursement penetration, and average license cost per bed, which are then balanced against sampled vendor revenue to tighten totals. Unit prices vary by deployment and region, so sampled ASP × volume checks adjust the first pass. Multivariate regression anchored on electronic health record coverage, AI-ready data-lake growth, and regulatory push scores feeds the five-year forecast, while scenario analysis handles policy or funding shocks. Data gaps in smaller countries are bridged through proximate economic or digital-health proxies agreed upon with interviewees.
Data Validation & Update Cycle
Every dataset and assumption runs through multi-pass triangulation and variance flags before senior review. Reports refresh annually, and material events such as major funding bills trigger interim model tweaks. Before publication, an analyst reconfirms key ratios so clients receive the freshest baseline.
Why Mordor's Healthcare Prescriptive Analytics Baseline Earns Trust
Published estimates often diverge because firms differ on component mix, base-year currency conversion, and how deeply they segment services versus licenses. Mordor's disciplined scope definition and yearly refresh reduce those swings.
Key gap drivers include some studies counting only software revenue, anchoring numbers on 2023 spending snapshots, or lifting untested vendor claims, whereas our model layers service revenue, adjusts for deferred cloud billing, and converts local currencies at period-average rates validated with central-bank data.
Benchmark comparison
| Market Size | Anonymized source | Primary gap driver |
|---|---|---|
| USD 16.17 B (2025) | Mordor Intelligence | |
| USD 12.90 B (2024) | Regional Consultancy A | Excludes service revenue and applies constant 2019 exchange rates |
| USD 3.60 B (2023) | Global Consultancy B | Considers only software sold to hospitals and assumes flat payer demand |
These comparisons show that when scope breadth, currency logic, and refresh cadence align, Mordor delivers a balanced, transparent baseline clients can replicate and defend with confidence.


Key Questions Answered in the Report
What is the current size of the healthcare prescriptive analytics market?
The market is valued at USD 20.17 billion in 2026.
How fast will the market grow through 2031?
Revenue is projected to reach USD 60.88 billion by 2031, representing a 24.73% CAGR.
Which application contributes the most revenue?
Clinical Decision Support led with 45.72% of 2025 revenue.
Which region is expanding the quickest?
Asia-Pacific is forecast to grow at 29.70% CAGR through 2031.
Why are services so dominant in spending?
Successful deployments hinge on domain expertise, change management, and regulatory compliance, making services the preferred investment.
What major regulatory trend affects adoption?
The EU Artificial Intelligence Act classifies clinical AI as high-risk, driving demand for transparent, explainable analytics platforms.
Page last updated on:


