
Healthcare Clinical Analytics Market Size and Share
Market Overview
| Study Period | 2022 - 2031 |
|---|---|
| Market Size (2026) | USD 19.57 Billion |
| Market Size (2031) | USD 49.46 Billion |
| Growth Rate (2026 - 2031) | 20.37 % |
| Fastest Growing Market | Asia Pacific |
| Largest Market | North America |
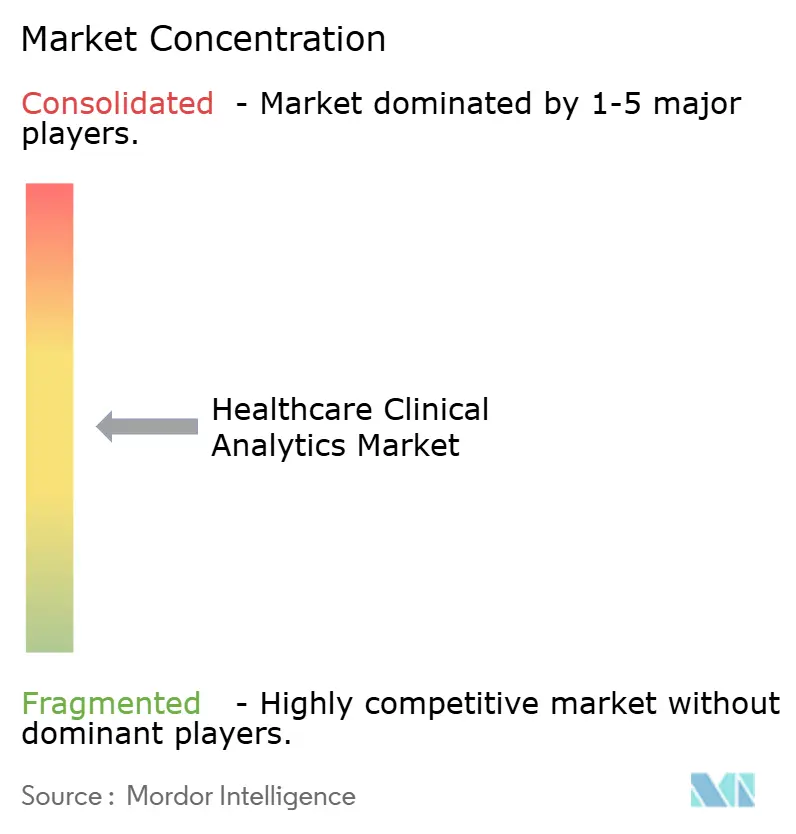
| Market Concentration | Medium |
Major Players *Disclaimer: Major Players sorted in no particular order Image © Mordor Intelligence. Reuse requires attribution under CC BY 4.0. | |
Healthcare Clinical Analytics Market Analysis by Mordor Intelligence
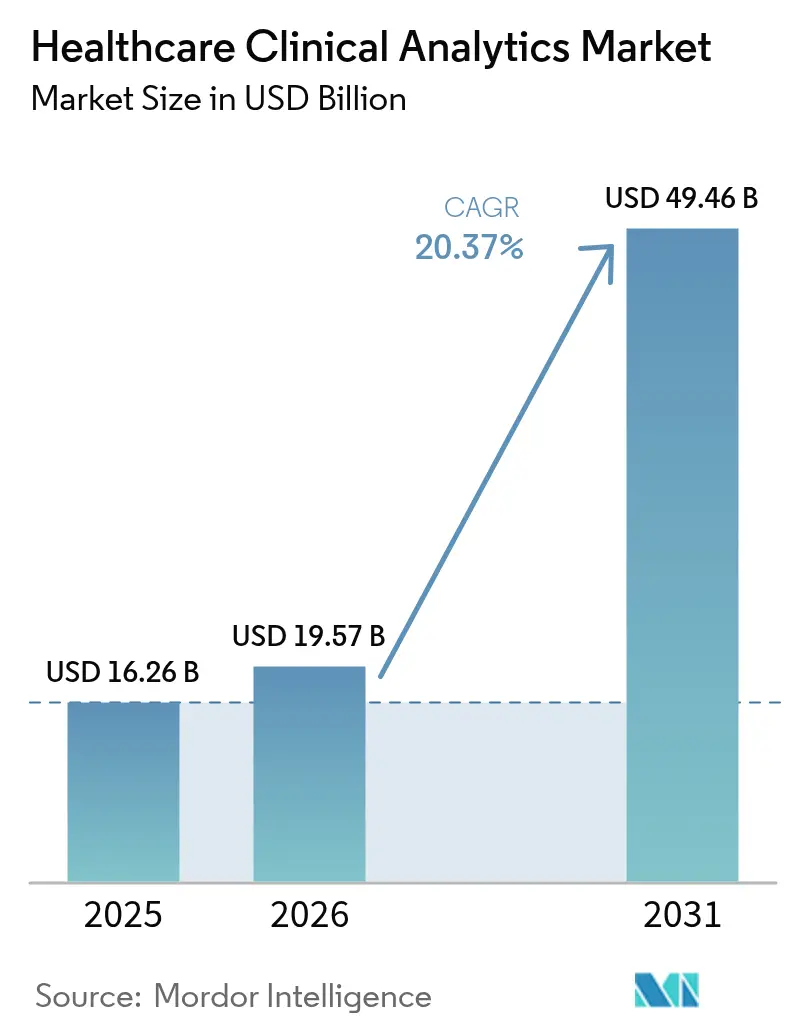
The healthcare clinical analytics market size was valued at USD 16.26 billion in 2025 and estimated to grow from USD 19.57 billion in 2026 to reach USD 49.46 billion by 2031, at a CAGR of 20.37% during the forecast period (2026-2031). Surge in electronic health record (EHR) maturity, rapid progress in artificial intelligence (AI) techniques, and the global shift to value-based reimbursement are catalyzing demand for real-time, data-driven decision support. Providers increasingly need to convert the exploding volume of structured and unstructured health data into actionable insights that improve outcomes while containing costs. Intensifying cost-reduction pressures, the search for operational efficiency amid workforce shortages and fresh regulatory clarity for AI-enabled software as a medical device further accelerate uptake across care settings. Regionally, North America maintains clear leadership because of entrenched EHR penetration and favorable reimbursement rules, whereas Asia-Pacific posts the fastest growth on the back of large-scale digitization programs and widening access to cloud infrastructure. Descriptive analytics still account for the lion’s share of spending, yet cognitive analytics is expanding the addressable healthcare clinical analytics market by automating higher-order reasoning tasks and reducing clinician workload.
Key Report Takeaways
- By technology type, descriptive analytics led with 44.65% revenue share in 2025; cognitive analytics is projected to expand at a 26.85% CAGR through 2031.
- By application, financial analytics held 34.15% of the healthcare clinical analytics market size in 2025, while population health management is forecast to grow at a 25.6% CAGR to 2031.
- By mode of delivery, on-premise deployment accounted for 62.85% of the healthcare clinical analytics market share in 2025; cloud and SaaS alternatives are expected to rise at a 26.2% CAGR to 2031.
- By product, services commanded 54.20% of revenue in 2025 and remain the fastest-growing segment with a 22.1% CAGR over the forecast horizon.
- By end user, healthcare providers contributed 35.95% of 2025 revenue and are expanding at a 23.9% CAGR on the strength of enterprise-wide analytics initiatives.
- By geography, North America dominates current spending, whereas Asia-Pacific is predicted to post the highest regional CAGR through 2031.
Note: Market size and forecast figures in this report are generated using Mordor Intelligence’s proprietary estimation framework, updated with the latest available data and insights as of 2026.
Global Healthcare Clinical Analytics Market Trends and Insights
Drivers Impact Analysis*
| Driver | (~) % Impact on CAGR Forecast | Geographic Relevance | Impact Timeline |
|---|---|---|---|
| High Adoption Of Electronic Health Records (EHR) | +4.20% | Global, with North America leading | Medium term (2-4 years) |
| AI / ML-Powered Analytics Platforms Mature | +5.80% | North America & EU, expanding to APAC | Long term (≥ 4 years) |
| Value-Based-Care & Reimbursement Mandates | +3.70% | North America core, spill-over to EU | Medium term (2-4 years) |
| Cost-Containment Pressure On Providers | +2.90% | Global | Short term (≤ 2 years) |
| Real-World-Evidence Feeds From Decentralised & Virtual Trials | +2.10% | North America & EU | Long term (≥ 4 years) |
| Synthetic Data & Privacy-Preserving Computation Unlock Multi-Institution Studies | +1.90% | Global, with regulatory focus in EU | Long term (≥ 4 years) |
| Source: Mordor Intelligence | |||
High Adoption of Electronic Health Records
The installation of certified EHR systems across hospitals and ambulatory practices unlocks machine-readable, longitudinal patient data that fuels the healthcare clinical analytics market. Kaiser Permanente’s Advanced Alert Monitor reduced inpatient mortality by 20% after embedding predictive algorithms inside its EHR workflow. Vendor roadmaps now center on clinically embedded AI agents, such as Oracle Health’s next-generation platform, slated for broad release in 2025, which incorporates voice-enabled automation and ambient documentation to minimize charting time. Standardization efforts such as FHIR further ease data interoperability, encouraging multi-institution outcome benchmarking and care-gap analysis. With regulators continuing to reward digital-quality reporting, the result is a snowball effect in EHR-driven analytics purchasing decisions.
AI / ML-Powered Analytics Platforms Mature
The U.S. Food and Drug Administration has cleared more than 1,000 AI-enabled medical devices, a milestone signaling regulatory confidence in machine learning for clinical use.[1]U.S. Food and Drug Administration, “Artificial Intelligence and Machine Learning (AI/ML)-Enabled Medical Devices,” fda.govReal-world deployments mirror this optimism, for instance, ChristianaCare’s simplified predictive model achieves 78% accuracy in flagging 90-day readmission risk while preserving clinician trust through transparent feature weighting. Generative AI front-ends such as Stanford Health Care’s ChatEHR allow physicians to interrogate charts with natural language, cutting information-retrieval time and curbing burnout.[2]Vijay Pande, “ChatEHR Lets Doctors Talk to the Medical Record,” med.stanford.edu The ability to fuse multimodal data, such as images, notes, and genomics, underpins precision therapy selection and drives longer-range demand across the healthcare clinical analytics market.
Value-Based-Care & Reimbursement Mandates
Public payers now peg reimbursement to documented outcome improvement, intensifying demand for risk stratification and cost-of-care insights. Aetna reported USD 660 million in savings after scaling value-based contracts supported by analytic dashboards that spotlight high-risk members and optimize care pathways. CMS’s revised Risk Adjustment Model V28 pivots from volume to severity scoring, prompting providers to deploy granular coding analytics that surface co-morbidities and protect revenue integrity. As pay-for-performance expands, payers and providers converge around shared data utilities, lifting adoption across every segment of the healthcare clinical analytics market.
Cost-Containment Pressure on Providers
Rising labor costs and persistent clinician shortages make operational efficiency non-negotiable. Texas Children’s Hospital added USD 20 million in physician-services margin by pairing daily productivity metrics with predictive workload balancing. Data-driven scheduling tools at MU Health Care reduced premium overtime through rules-based staffing scenarios, demonstrating how even modest organizations extract hard dollar savings from analytics. As inflation compresses operating margins, ROI-backed business cases accelerate enterprise-wide analytics rollouts, bolstering growth in the healthcare clinical analytics market.
Restraints Impact Analysis*
| Restraint | (~) % Impact on CAGR Forecast | Geographic Relevance | Impact Timeline |
|---|---|---|---|
| Data Privacy & Cyber-Security Breaches | -2.80% | Global, with heightened focus in EU | Short term (≤ 2 years) |
| High Up-Front Integration & Change-Management Costs | -1.90% | Global, particularly impacting smaller providers | Medium term (2-4 years) |
| Algorithmic Bias & Lack Of Explainability In Clinical Settings | -1.40% | North America & EU | Medium term (2-4 years) |
| Regulatory Ambiguity Around AI/ML SaMD Classification | -1.10% | Global, with varying regional approaches | Long term (≥ 4 years) |
| Source: Mordor Intelligence | |||
Data Privacy & Cyber-Security Breaches
Ransomware attacks on hospitals surged again in 2024, with adversaries weaponizing double-extortion tactics that threaten both downtime and regulatory fines. Ninety percent of life-sciences firms raised cybersecurity budgets in 2024, underscoring the scale of vigilance now required to protect personal health information. Compliance frameworks such as the EU’s GDPR impose tough breach-notification timelines and stiff penalties that dissuade open data exchanges, limiting algorithm training breadth. Forward-leaning providers are adopting privacy-preserving technologies, such as federated learning and homomorphic encryption, to strike a balance between analytics depth and confidentiality mandates. Yet, these measures add latency and cost overhead.
High Up-Front Integration & Change-Management Costs
Enterprise analytics rollouts entail multi-year integration of live clinical feeds, legacy billing systems, and external claims warehouses. Smaller hospitals often lack the capital buffer to absorb implementation fees or the internal expertise to modernize workflows. Consulting and managed-service expenses can exceed initial software license costs, lengthening payback periods and compressing ROI targets. Without executive-level sponsorship, clinician adoption lags and predictive tools sit idle, reinforcing skepticism and delaying follow-on investments. Vendors now bundle outcome-based contracts and phased deployments, but the financing hurdle still curbs addressable demand inside the healthcare clinical analytics market.
*Our forecasts treat driver/restraint impacts as directional, not additive. The impact forecasts reflect baseline growth, mix effects, and variable interactions.
Segment Analysis
By Technology Type: Cognitive Analytics Gains Ground on Descriptive Dominance
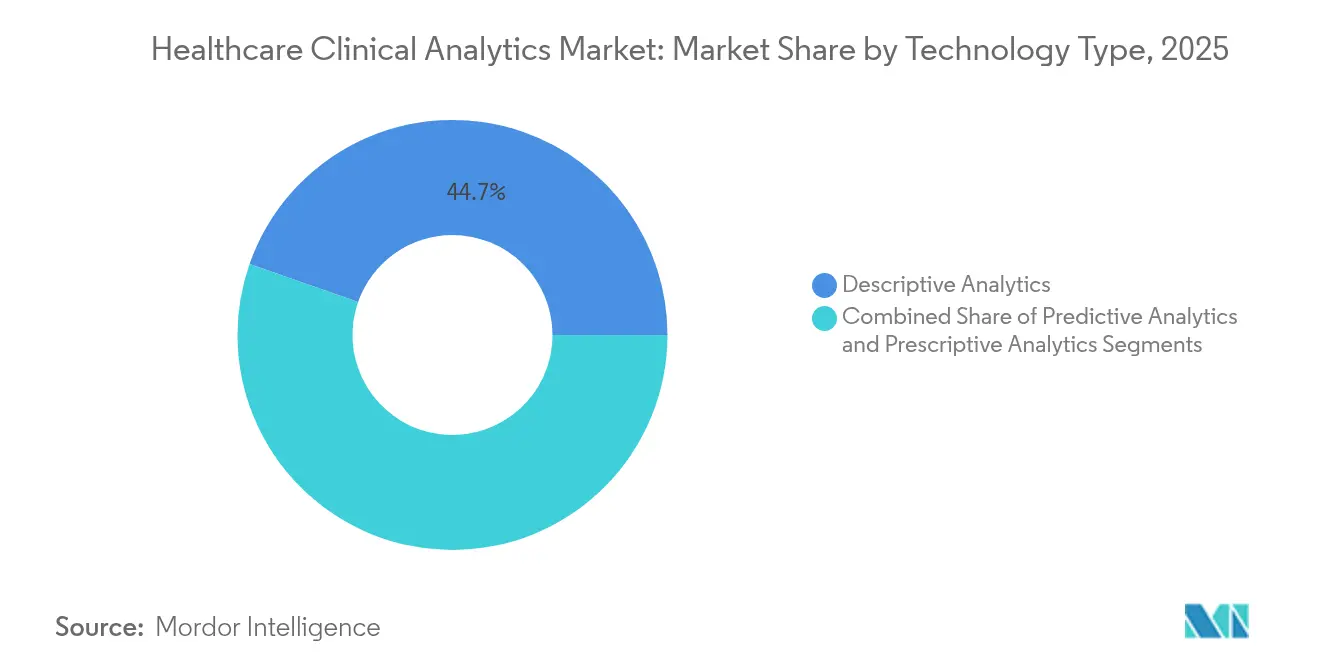
Descriptive analytics accounted for 44.65% of revenue in 2025, confirming that most organizations still need retrospective visibility into performance baselines before tackling higher-order tasks. Cognitive analytics, however, is forecast to expand at a 26.85% CAGR, validating its pivotal role in raising the overall healthcare clinical analytics market size for technology vendors. Fueled by natural-language processing and generative reasoning, cognitive engines autonomously synthesize lab values, imaging studies, and clinical notes to suggest differential diagnoses. Stanford Health Care’s ChatEHR pilot showcases how conversational interfaces can compress chart review time and elevate diagnostic confidence. The FDA’s evolving total product life-cycle guidance encourages this trajectory by clarifying pre-market documentation requirements for adaptive algorithms.
Momentum also reflects time savings for over-burdened clinicians. When algorithms pre-populate structured fields and surface guideline-concordant orders, providers regain face-to-face minutes with patients. Platform incumbents such as Epic embed large-language-model copilots directly inside their workflow canvas, rather than forcing clinicians to toggle between disparate analytics portals. As cognitive outputs move from dashboard-level alerts to inline nudges within order sets, downstream users multiply, expanding the installed base of the healthcare clinical analytics market. Vendors that layer explainability onto model outputs, heat maps, and contributing features help contain medical-legal risk and accelerate institutional sign-off.



By Application: Population Health Management Outpaces Financial Analytics
Financial analytics continues to supply the largest revenue block at 34.15% in 2025 because revenue-cycle teams must defend reimbursement under shifting payer rules. Yet population health management is accelerating at a 25.6% CAGR, providing the sharpest uplift to the healthcare clinical analytics market. Predictive risk scoring pinpoints COPD, diabetes, and CHF outliers long before expensive exacerbations unfold. Accenture and CCS’s PropheSee model hits 85% predictive accuracy and yields USD 2,200 annual savings per diabetic patient through proactive outreach.
Medicare Advantage penetration tops 70% of eligible seniors, incentivizing capitated entities to shoulder downstream cost risk. Quality-of-care improvement dashboards dovetail with CMS’s star-rating bonus payments, turbo-charging analytics modules that track readmissions, HCAHPS scores and medication compliance. As datasets integrate social determinants and home-based device feeds, segmentation deepens from “high cost” to personalized next-best-action orchestration, widening the healthcare clinical analytics market size and reinforcing first-mover advantage for cloud-native platforms.
By Mode of Delivery: Cloud Uptake Climbs on Security Assurances
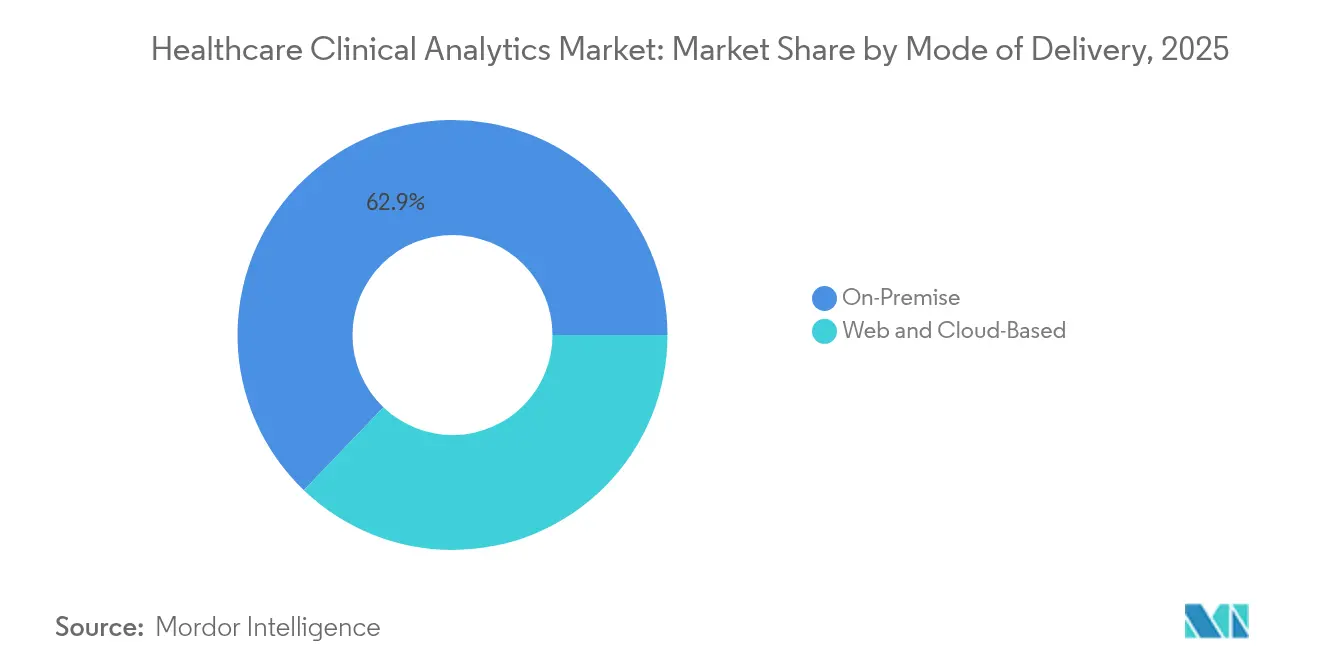
On-premises installations still command 62.85% of 2025 revenue, illustrating entrenched concerns around data custody and uptime guarantees. Cloud alternatives are, however, pacing at a 26.2% CAGR and will absorb a growing slice of the healthcare clinical analytics market share by decade’s end. Clinicians value always-on access to AI compute that scales elastically during flu season surges, while IT leaders appreciate reduced capital expense and faster model-refresh cycles. Hospitals migrating Epic to Amazon Web Services report improved batch-processing times and simplified disaster recovery, although mixed experiences with rival clouds underline the need for dedicated healthcare support teams.
Hybrid blueprints increasingly dominate RFPs as sensitive patient identifiers remain in a protected enclave, yet de-identified, feature-engineered datasets flow seamlessly to cloud AI workbenches. Such partitioned architectures unlock algorithm breadth without breaching HIPAA or GDPR. As shared-responsibility models mature, certifications such as HITRUST CSF assuage board-level risk concerns. Consequently, the elastic, pay-as-you-go model becomes a budgetary bridge for mid-tier hospitals previously priced out of the healthcare clinical analytics market.
By Product: Services Anchor Revenue as Complexity Multiplies
Services captured 54.20% of 2025 spending and continue to grow at 22.1% CAGR, highlighting the hands-on expertise needed to operationalize advanced analytics. Implementation roadmaps encompass data-quality audits, HL7 feed normalization, and clinician adoption workshops, tasks rarely solved by software alone. Innovaccer’s category-leading Best in KLAS scores 94.5 for CRM and 95.9 for risk adjustment, such as stemming from bundled advisory services that shepherd clients from pilot to scale. Hardware accounts for a modest slice of the healthcare clinical analytics market. Yet, compute-intensive AI models renew demand for GPU-accelerated nodes and high-speed storage in radiology, pathology, and genomics labs.
Recurring managed-service contracts lock in long-term margins, covering model retraining, security patching, and KPI benchmarking. Vendors that align fee schedules with outcome milestones (for example, reduced sepsis LOS) create a virtuous cycle of shared success, tightening customer retention. Meanwhile, pure-play software providers counter low-code configurability, but many still rely on partner networks for last-mile integration. These dynamics ensure the services line will remain the principal revenue engine and barrier to entry across the healthcare clinical analytics market.
By End User: Provider Momentum Sustains Ecosystem Expansion
Providers delivered 35.95% of 2025 revenue and outpaced all other buyers with a 23.9% CAGR, reinforcing their primacy in shaping functional roadmaps. Bedside staff witness direct patient impact, so they quickly champion AI-assisted triage and deterioration alerts that avert ICU transfers. Texas Children’s productivity gains exemplify how surgical block utilization and ambulatory throughput improve when dashboards translate raw data into relatable action items.
Payers now seek parity, turning to member-centric analytics that minimize avoidable admissions and flag gaps in preventive screenings. Medicare Advantage bids hinge on accurate risk coding and star-rating uplift, outcomes impossible without granular, near-real-time data. Life sciences companies pursue real-world evidence partnerships, licensing de-identified clinical repositories to speed trial recruitment and post-marketing surveillance. These multi-stakeholder collaborations swell the total addressable healthcare clinical analytics market while also encouraging common data models that streamline cross-industry insight exchange.
Geography Analysis
North America remains the most significant regional contributor, propelled by advanced IT infrastructure, widespread EHR penetration, and well-defined reimbursement incentives. Epic’s capture of 42.3% of U.S. acute-care beds underscores the scale advantages that accrue to technology leaders able to bundle analytics seamlessly inside existing workflows. Simultaneously, federal payment reform and cybersecurity grant funding sustain ongoing capital allocation toward AI upgrades that grow the healthcare clinical analytics market.
Europe accelerates behind landmark digital-health regulations such as the European Health Data Space and the EU AI Act, each mandating interoperability and algorithm transparency. Germany’s Health Data Use Act and France’s reinforced clinical-validation pathways are fueling cross-border research networks, albeit with strict GDPR safeguards that shape vendor deployment models. These initiatives encourage standardized data lakes that power population-scale analytics, reinforcing the region’s medium-term contribution to global growth.
Asia-Pacific posts the steepest CAGR as governments in China, India, and Japan bankroll cloud infrastructure, AI talent pipelines, and national health-ID schemes. Public-sector modernization, such as Saudi Arabia’s Vision 2030 health component, is illustrative. It establishes baseline data liquidity, expanding the healthcare clinical analytics market across both public and private hospitals. Challenges remain around disparate legacy systems and workforce upskilling, but targeted investment corridors and local-language AI interfaces are closing readiness gaps at pace.


Regulatory Landscape
In the United States, the regulatory framework affecting clinical analytics is tightening on interoperability and AI-enabled clinical decision support. The Office of the National Coordinator for Health Information Technology (ONC) finalized Health Data, Technology, and Interoperability updates (HTI-1) to elevate algorithm transparency and information-blocking compliance within certified health IT. It also reinforces procurement requirements for analytics features embedded in EHR workflows. For clinical decision support, the US Food and Drug Administration (FDA) issued revised final guidance for Clinical Decision Support (CDS) software in January 2026, clarifying when CDS functions fall under FDA oversight using the FD&C Act section 520(o)(1)(E) framework. This guidance shapes documentation, validation, and change-control practices for AI-enabled analytics used at the point of care.
In Europe, policy is converging on interoperability and accountable AI governance. The EU AI Act (Regulation 2024/1689) sets enforceable obligations for high-risk AI systems used in clinical settings, with an enforcement deadline referenced for August 2026, pushing vendors and providers toward stronger risk management, transparency, and technical documentation for clinical deployment. Alongside AI governance, eHealth and cross-border data-sharing initiatives referenced by the European Commission (including MyHealth@EU and related digital-health programs) raise expectations for standardized data exchange, which affects how multi-country analytics programs design consent, privacy controls, and auditability under GDPR.
Competitive Landscape
The competitive arena shows moderate consolidation. Incumbent EHR vendors integrate analytics, while pure-play specialists court partnerships to amplify distribution. Epic continues to translate scale into share gains, aided by an API ecosystem and cross-client benchmarking assets. Oracle Health invests heavily in next-gen AI modules yet faces a shrinking U.S. footprint after several high-profile contract losses, illustrating execution risk even with robust R&D. InterSystems, Google, and GE HealthCare have each introduced generative AI extensions, emphasizing workflow-embedded experiences rather than bolt-on dashboards.
Acquisitions illustrate a flight to end-to-end platforms, like Arcadia’s purchase of CareJourney, which adds payer claims granularity to provider-centric population analytics. Innovaccer’s Humbi AI buyout strengthens actuarial insight for risk-bearing entities. Venture investment has cooled relative to 2021 peaks, but capital still flows to niche areas such as oncology analytics, remote-patient-monitoring signal fusion, and bias-mitigation toolkits. Vendors that surface explainable AI artifacts and prove measurable clinical impact gain procurement preference, especially where CIOs seek to mitigate regulatory scrutiny.
White-space opportunities persist in under-served domains such as community-hospital revenue-cycle automation, low-resource setting data interoperability, and regulatory intelligence engines that auto-compile algorithm change logs for FDA submissions. Barriers to entry include health-system data fragmentation and prolonged sales cycles. Still, network effects will intensify as more providers participate in shared learning networks that benchmark outcomes and propagate best-practice models across the healthcare clinical analytics market.
Healthcare Clinical Analytics Industry Leaders
IBM
Cerner corporation
Allscripts Healthcare Solutions
Oracle
McKesson (Ontada)
- *Disclaimer: Major Players sorted in no particular order

Market Opportunities and Future Outlook
Interoperability updates are expanding the deployment space for workflow-embedded clinical analytics that can scale across health systems without bespoke interfaces. ONC published 2026 updates through the Standards Version Advancement Process (SVAP), including USCDI v6 and updated HL7 Da Vinci FHIR Implementation Guides (for example, versions 2.2.1 and 2.2.0) that support automated prior authorization and payer-provider data exchange. This creates a clearer technical runway for analytics vendors to package decision support and operational insights on standardized APIs, rather than relying on custom integrations. In parallel, HL7 work on CPG-on-FHIR STU3 is advancing standardized patterns for interactive CDS, supporting product strategies that connect analytics outputs directly to guideline-driven actions inside clinician workflows.
A second opportunity lies in governed, large-scale de-identified data assets used for patient-journey analytics, population risk stratification, and real-world evidence programs for life sciences. In January 2026, Fujitsu Japan and JMDC linked anonymized DPC hospital data with insurer records to form a 20-million-record database for patient journey analysis, underscoring demand for curated longitudinal datasets and the associated tooling stack (data curation, privacy-preserving computation, and traceable model governance). These developments align with value-based care operations where payer-provider data exchange and documentation automation benefit from analytics that are auditable and interoperable, while also supporting cloud and hybrid architectures that keep identifiers separate from feature-engineered datasets to meet privacy requirements.
Recent Industry Developments
- June 2026: Oracle Health partnered with Theator to extend AI into the operating room by integrating surgical intelligence and video analytics into documentation workflows. The collaboration uses Oracle Cloud Infrastructure to process high-definition surgical data, expanding clinical analytics beyond EHR dashboards into procedure-level decision support and operational insight.
- January 2026: Alrajhi Medicine selected Oracle Health Foundation EHR and Oracle Fusion Cloud Applications to digitize and integrate clinical operations, enabling real-time, AI-driven analytics across its network. The program highlights how large provider groups bundle EHR modernization with embedded analytics to standardize workflows and improve cross-site performance monitoring.
- May 2025: Oracle, Cleveland Clinic, and G42 announced a strategic partnership to develop a global AI-based healthcare delivery platform combining Oracle Cloud Infrastructure with clinical applications and sovereign AI capabilities. The initiative underscores the role of cloud-scale compute and data-residency controls in expanding clinical analytics programs across geographies with differing privacy and governance requirements.


Research Methodology Framework and Report Scope
Market Definition and Coverage
This market covers clinical analytics tools and related services that turn clinical data into insights used in care delivery and quality improvement, including analytics embedded into clinical workflows and reporting for providers.
Scope exclusions: Stand-alone payer fraud analytics and broad, horizontal BI tools that are not built for clinical use cases are not counted.
Segmentation Overview
- By Technology Type
- Predictive Analytics
- Prescriptive Analytics
- Descriptive Analytics
- By Application
- Quality of Care Improvement
- Customer Relationship Management
- Workforce Performance Evaluation
- Hospital/Clinical Data Management & Curation
- By Mode of Delivery
- On-Premise
- Web & Cloud-Based
- By Product
- Hardware
- Software
- Services
- By End User
- Healthcare Providers
- Healthcare Payers
- Life-Science & CROs
- Government/ Public Health Agencies
- Geography
- North America
- United States
- Canada
- Mexico
- Europe
- Germany
- United Kingdom
- France
- Italy
- Spain
- Rest of Europe
- Asia Pacific
- China
- Japan
- India
- South Korea
- Australia
- Rest of Asia Pacific
- Middle East and Africa
- GCC
- South Africa
- Rest of Middle East and Africa
- South America
- Brazil
- Argentina
- Rest of South America
- North America
Data Sources, Market Sizing, and Validation
Desk Research
Desk research was used to build the basic market map and to anchor the model with public signals that can be checked year over year. We mainly relied on official health statistics and digital health adoption indicators from sources such as the World Health Organization, OECD health data, the US CDC, CMS publications, and national health ministry releases in major countries.
To tighten assumptions around demand and spend direction, we also reviewed provider and health system annual reports, public earnings decks, peer-reviewed journal articles on clinical decision support and outcomes, and reputable press coverage on EHR modernization and AI deployment. Paid subscriptions were used only for company financials and for patent landscaping to identify product focus areas and the timing of new capability launches. These desk research sources are illustrative, and other public references were also used for data collection, cross-checking, and clarification.
Primary Interviews and Surveys
Primary work focused on validating what is actually purchased and deployed for clinical analytics, and how pricing and contracting are typically structured across different provider settings. We spoke with a mix of solution leaders, implementation partners, provider IT and clinical operations roles, and data and analytics teams across APAC, EMEA, and the Americas, then used follow-up outreach when desk signals and field feedback did not match.
Distribution of primary research fieldwork respondents
| Company type | Respondent position | Region |
|---|---|---|
| Top tier: 31% | CXOs: 14% | APAC: 46% |
| Mid tier: 51% | Functional/Unit leaders: 38% | EMEA: 35% |
| Smaller Players: 18% | Managers: 48% | Americas: 19% |
Market-Sizing & Forecasting
Sizing starts with a top-down build where healthcare digital spend and provider IT investment signals are reconstructed into an addressable pool, and then filtered using adoption and usage rates for clinical analytics within care delivery workflows. To avoid over-counting, results are corroborated with selective bottom-up approximations, mainly sampled vendor revenue disclosure patterns, channel checks, and an ASP times deployment volume view for key provider cohorts, followed by adjustments where the checks disagree.
Key model inputs include EHR adoption and maturity, the pace of value-based care programs, provider digitization budgets, cloud migration rates for clinical systems, implementation cycle times, and the mix shift toward predictive and AI-supported use cases (which tends to change pricing). For forecasting, we used scenario analysis supported by simple regression-based sensitivities on these drivers, and then aligned the scenarios to what primary respondents expect for budget headroom, regulatory push, and data availability. Where bottom-up signals were patchy in smaller countries or smaller provider groups, we handled the gaps using proxy indicators such as hospital count, bed capacity, and digital health readiness, then normalized to regional totals.
Data Validation & Update Cycle
Outputs are validated through triangulation across desk indicators, primary feedback, and internal consistency checks, so the final number does not depend on a single source. Variances are flagged when growth appears inconsistent with provider budget signals, adoption rates, or deployment timelines, and then assumptions are revisited. If needed, we re-contact respondents to resolve the conflict.
Before sign-off, a second analyst reviews the logic, the math flow, and the key assumptions, followed by a final sense-check against independent market signals. Reports are refreshed annually, and interim updates are made when material events occur, such as policy shifts, major product changes, or demand shocks. Right before delivery, an analyst performs a fresh pass so clients receive the most current view available.
Mordor Intelligence's Global Healthcare Clinical Analytics Market Market Size Versus Other Published Estimates
Published values for healthcare clinical analytics can vary because firms often draw the line differently on what counts as clinical versus enterprise analytics, and because they apply different pricing progressions and adoption timing. Differences also show up when one study assumes faster cloud migration or counts broader analytics categories that sit outside day-to-day clinical workflows.
The main gap comes from scope expansion into adjacent healthcare analytics categories, where Mordor Intelligence counts only clinical analytics tied to provider clinical data use cases and excludes stand-alone payer fraud tools and horizontal BI suites, which some estimates may include to reach larger totals.
Benchmark comparison
| Source | Market Size | Gaps in Research Methodology |
|---|---|---|
| Mordor Intelligence | USD 16.26 B (2025) | |
| Industry Publisher A | USD 19.90 B (2025) | This estimate appears to use a wider component scope that can include hardware and broader clinical analytics spending lines, which can pull in adjacent analytics budgets not strictly tied to clinical workflow usage. |
| Industry Publisher B | USD 65.64 B (2025) | This figure is for the broader healthcare analytics space and can include clinical, financial, and operational analytics across payers and providers, so it is not limited to clinical analytics demand drivers and purchase patterns. |
The table shows that the spread is mainly explained by what is counted, not only by math differences. By keeping the demand pool tied to provider clinical workflow analytics, and then cross-checking adoption, pricing, and deployment timing with field feedback, the sizing stays traceable and repeatable when the market is updated.


Key Questions Answered in the Report
What is the projected size of the healthcare clinical analytics market by 2031?
The market is forecast to reach USD 49.46 billion by 2031, growing at 20.37% CAGR.
Which analytics technology is expanding the fastest?
Cognitive analytics is expected to grow at a 26.85% CAGR, reflecting rising demand for AI-powered clinical reasoning tools.
Why are healthcare providers the largest buyers of analytics platforms?
Providers capture immediate clinical and financial benefits, accounting for 35.95% of 2025 revenue while advancing at a 23.9% CAGR through 2031.
How quickly are cloud-based deployments growing?
Cloud and SaaS models are on track for a 26.2% CAGR as security certifications and elastic compute make them increasingly attractive.
What key restraint could slow future adoption?
Data-privacy and cybersecurity threats weigh heavily, imposing extra compliance costs and reducing willingness to share sensitive data.
Which region offers the fastest growth outlook?
Asia Pacific leads on CAGR because national digitization programs are scaling EHR infrastructure and cloud capacity across emerging markets.
Page last updated on:


 Your data is secure and never sold or shared.


