Market Overview
| Study Period | 2020 - 2031 |
|---|---|
| Forecast Data Period | 2026 - 2031 |
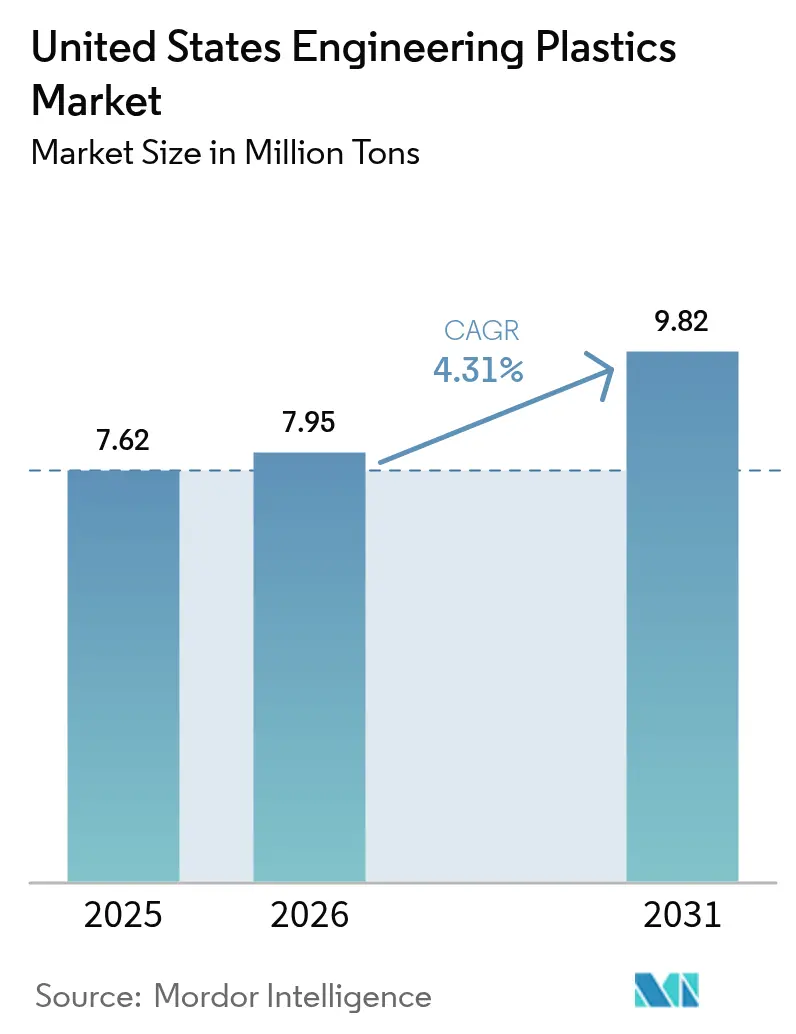
| Base Year Market Size (2025) | 7.62 Million tons |
| Market Volume (2026) | 7.95 Million tons |
| Market Volume (2031) | 9.82 Million tons |
| Growth Rate (2026 - 2031) | 4.31% CAGR |
| Market Concentration | Medium |
Major Players *Disclaimer: Major Players sorted in no particular order Image © Mordor Intelligence. Reuse requires attribution under CC BY 4.0. | |
United States Engineering Plastics Market Analysis by Mordor Intelligence
The United States Engineering Plastics market size is expected to grow from 7.62 million tons in 2025 to 7.95 million tons in 2026 and is forecast to reach 9.82 million tons by 2031 at 4.31% CAGR over 2026-2031. Sustained momentum comes from electric-vehicle lightweighting programs, 5G infrastructure roll-outs, and federal as well as state recycling mandates that favor recyclable or bio-based grades over legacy materials. Automakers are substituting glass-fiber-reinforced polyolefins and high-temperature nylons for traditional metals to achieve weight, cost, and energy-consumption targets. Electronics makers are rapidly scaling fluoropolymer use to meet low-dielectric requirements in millimeter-wave devices, while tariff-driven onshoring of compounding capacity secures domestic supply. Meanwhile, petrochemical feedstock volatility and elevated capital costs for super-engineering polymers constrain margin expansion, encouraging producers to rationalize capacity and pivot toward circular economy portfolios.
Key Report Takeaways
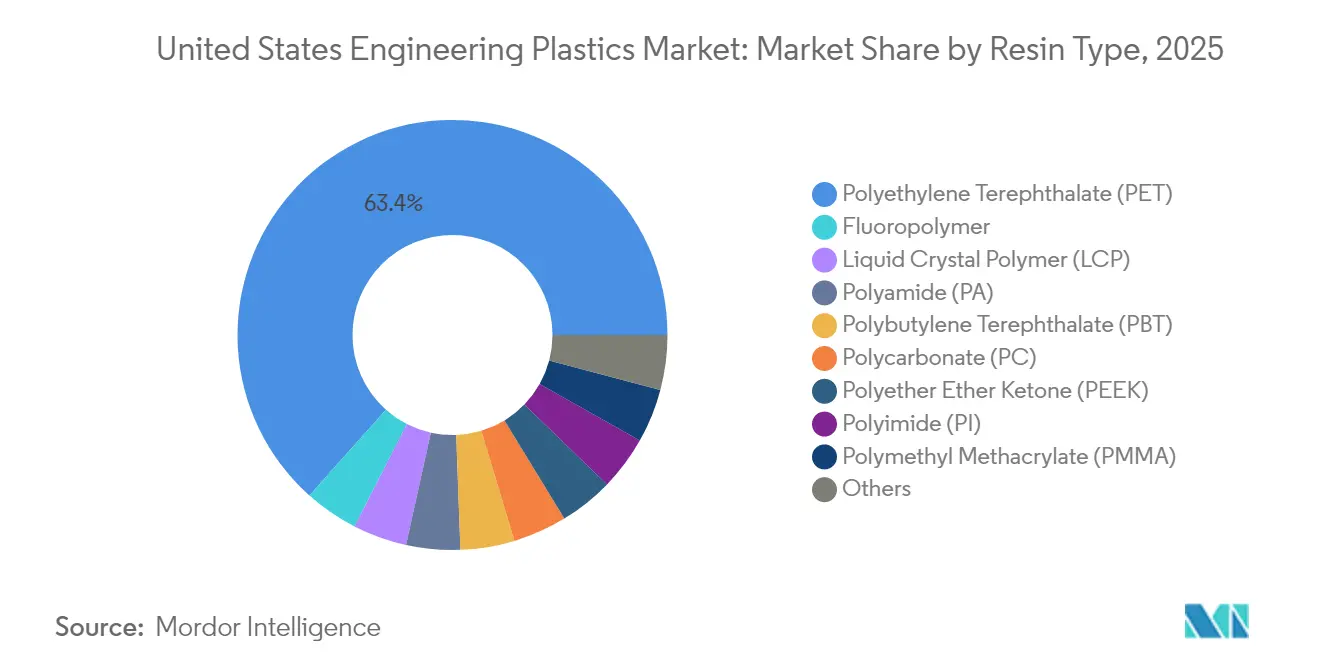
- By resin type, polyethylene terephthalate held 63.41% of the United States engineering plastics market share in 2025; fluoropolymers are forecast to register a 7.99% CAGR through 2031.
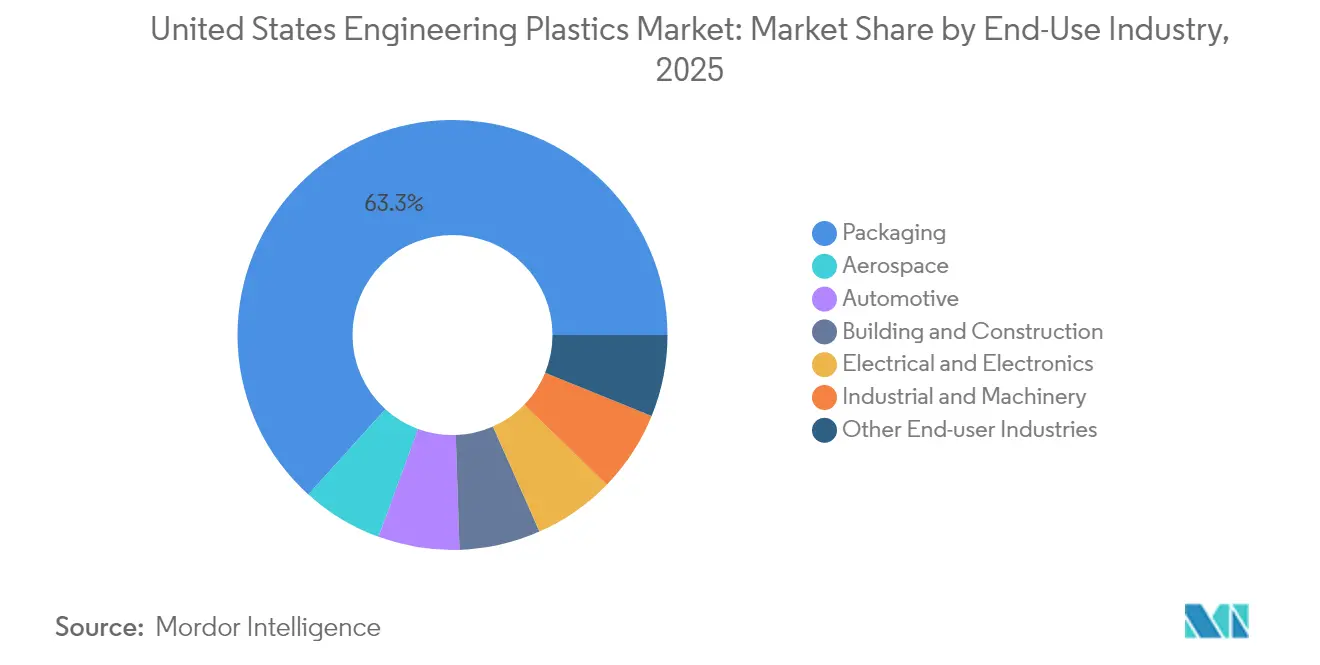
- By end-user industry, packaging commanded 63.30% of the United States engineering plastics market size in 2025, while electrical and electronics is projected to grow at a 6.95% CAGR through 2031.
Note: Market size and forecast figures in this report are generated using Mordor Intelligence’s proprietary estimation framework, updated with the latest available data and insights as of 2026.
United States Engineering Plastics Market Trends and Insights
Drivers Impact Analysis*
| Driver | (~) % Impact on CAGR Forecast | Geographic Relevance | Impact Timeline |
|---|---|---|---|
| Automotive lightweighting & EV adoption | +1.20% | Michigan–Ohio–Tennessee corridor | Medium term (2-4 years) |
| 5G-enabled miniaturization in E&E hardware | +0.80% | California, Texas, North Carolina tech hubs | Short term (≤ 2 years) |
| Regulatory demand for recyclable/bio-based resins | +0.60% | California, New York | Long term (≥ 4 years) |
| Tariff-driven onshoring of high-performance compounding | +0.40% | Gulf Coast petrochemical belt | Medium term (2-4 years) |
| 3-D printable PEEK/PEKK certifications in aerospace | +0.30% | Washington, California, Texas | Long term (≥ 4 years) |
| Source: Mordor Intelligence | |||


Automotive Lightweighting & EV Adoption Drive Material Innovation
Electric-vehicle programs are reshaping material requirements as OEMs seek thermal-management and structural solutions that lower curb weight without compromising safety. Ford’s F-150 Lightning uses Celanese Celstran long-glass-fiber polypropylene, cutting 16 lb per vehicle while eliminating painting steps and trimming cycle times. The same design priorities extend to battery enclosures requiring electromagnetic-interference shielding and thermal-runaway protection, positions where engineering plastics deliver geometry freedom and cost advantages over aluminum. Continued federal zero-emission vehicle credits further incentivize material substitution. Suppliers have responded with glass- and mineral-reinforced polypropylene, high-temperature nylon, and polycarbonate-blend grades that meet FMVSS crashworthiness, chemical resistance, and end-of-life recyclability benchmarks. As volumes scale, unit costs fall, reinforcing the shift toward lighter, multifunctional polymer solutions that support higher EV range targets.
5G Infrastructure Accelerates Electronics Miniaturization
Nationwide 5G deployment is propagating demand for ultra-compact base-station and handset components that operate at millimeter-wave frequencies. Fluoropolymers register the fastest growth among all engineering resins at 8.15% CAGR because their low dielectric constant (less than or equal to 2.1) and resistance to high-frequency signal loss make them indispensable for antenna substrates. Surface-mount packages must survive multiple reflow cycles at greater than or equal to 260 °C while holding tolerances below 10 µm, forcing a migration from epoxy-glass laminates to high-temperature polyphenylene sulfide and liquid-crystal polymer (LCP). Adoption is further buoyed by thermal-interface materials formulated from silicone-modified polyimide that dissipate heat without creepage. Rising bandwidth consumption, cloud-edge relocation, and integration of phased-array antennas in consumer devices ensure entrenched growth throughout the forecast horizon.
Regulatory Mandates Reshape Resin Selection Criteria
The Environmental Protection Agency’s National Strategy for a Circular Economy promotes federal procurement of high-recycled-content products, directing immediate uptake for certified recycled engineering plastics. California’s Advanced Clean Cars II mirrors the momentum, imposing recycled-content thresholds in automotive trim and under-the-hood parts. Covestro has allocated EUR 100 million for ISCC PLUS mass-balance certification across its U.S. sites, enabling seamless replacement of fossil-based raw materials with bio-attributed alternatives without requalifying parts. Original-equipment manufacturers now request life-cycle-assessment data at the RFQ stage, shifting negotiation leverage toward suppliers with audited, circular-ready portfolios. Such transparency requirements motivate peers to accelerate chemical recycling ventures and advanced depolymerization technology roll-outs.
Tariff Policies Accelerate Domestic Compounding Investments
Section 301 tariffs impose a 25% duty on many Chinese engineering plastics imports, creating a protective pricing umbrella that spurred U.S. capacity expansion[1]Office of the U.S. Trade Representative, “Section 301 Report Update,” ustr.gov . BASF’s USD 1.1 billion Geismar project and similar Gulf Coast ventures capitalize on advantaged shale-based ethylene and propylene feedstock. Domestic converters benefit from shorter lead times, lower logistics risk, and assured intellectual-property protection, prompting automotive and electronics OEMs to localize tool builds and validation programs. Simultaneously, resin producers offer co-development services that streamline grade selection and part qualification, reinforcing near-shoring momentum.
Restraints Impact Analysis*
| Restraint | (~) % Impact on CAGR Forecast | Geographic Relevance | Impact Timeline |
|---|---|---|---|
| Petrochemical feedstock price volatility | -0.70% | Gulf Coast production hubs | Short term (≤ 2 years) |
| High processing cost of super-engineering polymers | -0.50% | Specialized manufacturing clusters | Medium term (2-4 years) |
| FAA traceability bottlenecks for aerospace grades | -0.20% | Washington, California, Texas | Long term (≥ 4 years) |
| Source: Mordor Intelligence | |||
Petrochemical Feedstock Volatility Constrains Margin Expansion
Spot benzene prices fluctuated over 40% during 2024 amid refinery outages and shipping disruptions, compressing spreads for styrenic and polyester-based engineering plastics. Chinese ethylene additions tons through 2028 perpetuate global oversupply, limiting North American cost-pass-through latitude. Producers respond by hedging via long-term feedstock contracts and by trimming under-utilized assets, but persistent price swings complicate budgeting for converters and discourage longer-run commitments.
Processing Cost Barriers Limit Super-Engineering Polymer Adoption
PEEK, PEI, and polyphenylene sulfide demand processing windows above 350 °C and precise residence-time control, necessitating corrosion-resistant screws and torque-capable extruders that can cost 200-300% more than standard equipment. Smaller molders often lack capital budgets to install such lines, impeding wider adoption except where performance premiums justify the outlay. Limited closed-loop recycling pathways impose additional end-of-life surcharges, further constraining penetration outside aerospace, medical, and oil-and-gas niches.
*Our forecasts treat driver/restraint impacts as directional, not additive. The impact forecasts reflect baseline growth, mix effects, and variable interactions.
Segment Analysis
By Resin Type: PET Dominance Drives Volume While Fluoropolymers Lead Innovation
Polyethylene terephthalate accounted for a commanding 63.41% share of the United States engineering plastics market in 2025, supported by its well-established bottle-to-bottle recycling ecosystem that aligns with emerging circular economy mandates. PET’s low cost-to-performance ratio enables substitution into interior automotive trim and laptop casings, broadening its consumption base. The resin’s glycol-modified grades meet FDA food-contact requirements, ensuring continued packaging leadership. Over the forecast horizon, polyester suppliers are blending chemically recycled feedstocks at up to 30% content without sacrificing clarity or mechanical integrity, reinforcing PET’s entrenched position.
Fluoropolymers, in contrast, represent the innovation frontier, expanding at a 7.99% CAGR as 5G antenna substrates, high-frequency cables, and semiconductor-lithography components demand exceptional thermal and electrical stability. While supply remains capacity-constrained and subject to fluorine raw-material price dynamics, multi-source qualification programs led by electronics OEMs are smoothing volatility. PTFE-free melt-processable grades simplify high-volume fabrication, unlocking applications in automotive advanced-driver-assistance radar and aerospace wire insulation. Polycarbonate retains relevance in glazing and interior assemblies despite Chinese oversupply that forced European capacity reductions. Adoption of UV-stabilized blends sustains demand in sunroof modules and transparent electronic housings. Polyamide consumption is challenged by reinforced polypropylene that delivers comparable mechanical performance at lower price, yet high-temperature nylon 6T/66 copolymers remain irreplaceable for turbo-charger ducts and high-heat connectors.


Electrical and Electronics Segment in US Engineering Plastics Market
Packaging held 63.30% of the United States engineering plastics market size in 2025, leveraging FDA approvals, drop-in recyclability, and lower greenhouse-gas footprints relative to glass or metal. State mandates such as California’s SB 54 compel minimum recycled-content thresholds, prompting converters to adopt chemically recycled PET to maintain clarity and barrier performance. Dual-barrier multilayer bottles combining EVOH and nano-clay maintain carbonation shelf life while cutting wall thickness by 20%, preserving volume leadership.
Electrical and electronics is the fastest-expanding end-user at a 6.95% CAGR through 2031, propelled by densification of 5G macro and small-cell sites across metropolitan corridors. Engineering plastics with dielectric constants below 3 and comparative tracking index above 600 V facilitate miniaturized connectors, MEMS packages, and battery-management-system housings. Reflow-capable LCPs and halogen-free flame-retardant polyesters meet RoHS and WEEE directives, allowing OEMs to scale production without redesigning assembly lines. Concurrent demand for advanced semiconductor packaging—chiplet architectures and heterogeneous integration—further elevates polymer content per unit, offsetting slowing consumer handset sales. Automotive stands at a strategic crossroads: internal-combustion-engine intake manifolds are declining, but battery-electric-vehicle enclosures, lightweight seat frames, and laser-transparent welding housings support renewed polymer demand. Aerospace growth stays tempered by multi-year certification pipelines, yet additive-manufactured PEEK brackets for cabin interiors seed longer-term upside. Building and construction applications benefit from energy-efficiency codes mandating high-performance window frames and insulated panels using glass-fiber-reinforced PET, widening market exposure beyond consumer goods.
Geography Analysis
The United States engineering plastics market displays pronounced regional clustering rooted in feedstock availability, end-use demand patterns, and regulatory landscapes. Gulf Coast states dominate production owing to integrated ethylene, propylene, and benzene streams. BASF’s Geismar, Louisiana, MDI expansion will lift regional output capacity from 380,000 tons to 600,000 tons by 2026, cementing the area’s status as the primary isocyanate hub. Low-cost shale-derived feedstock ensures global cost leadership even amid Asian oversupply cycles.
The Great Lakes corridor—Michigan, Ohio, and Tennessee—concentrates automotive consumption. Ford, General Motors, and Stellantis leverage local injection-molding clusters to source lightweighting materials, while battery-module assembly investments in Kentucky and Tennessee intensify engineering plastics uptake in thermal-management and structural components.
California and the Pacific Northwest anchor electronics and aerospace demand. Silicon Valley drives high-frequency substrate and interposer use, whereas Boeing’s Washington facilities continue qualifying thermoplastic composite brackets that replace legacy aluminum. California’s aggressive circularity statutes foster early adoption of mass-balance-certified and chemically recycled grades, creating a regulatory pull distinct from other regions.
The Northeast corridor—including New York, New Jersey, and Massachusetts—emerges as a 5G deployment hotspot where base-station installations fuel fluoropolymer and LCP demand. Proximity to research universities accelerates material innovation, particularly in advanced semiconductor packaging.
Tariff-induced reshoring amplifies Mid-South and Central Plains investment in compounding facilities that supply automotive and appliance OEMs with custom formulations. Shorter lead times and robust IP protection entice medical-device manufacturers in Minnesota and Illinois to source domestically, reinforcing regional diversity in consumption profiles.
Competitive Landscape
Top Companies in United States Engineering Plastics Market
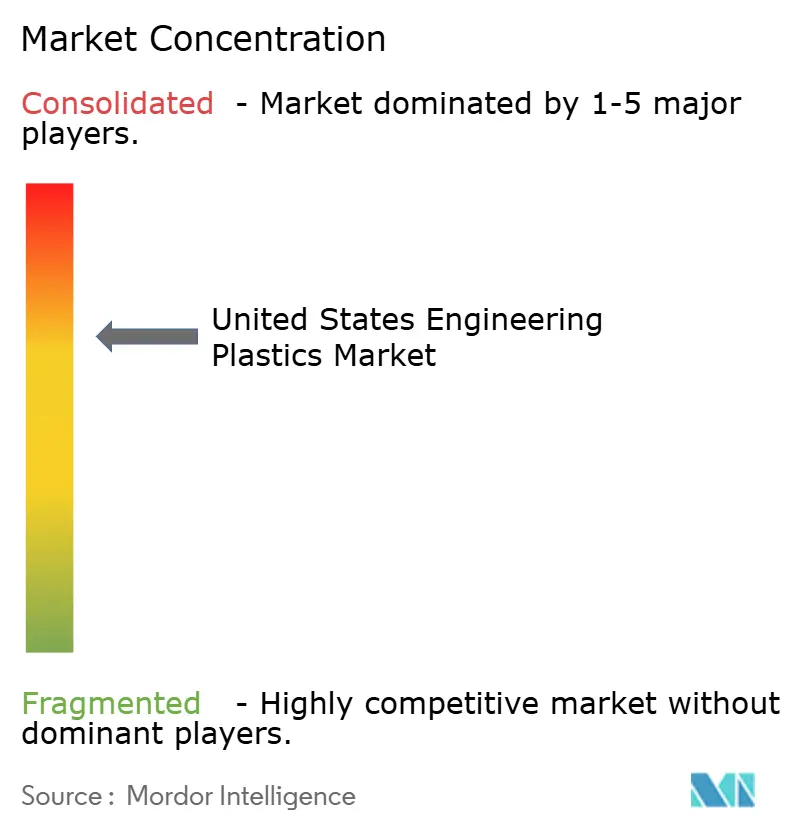
The United States engineering plastics market is moderately consolidated. BASF’s USD 28 billion divestiture program redirects capital into high-margin specialty polymers, including engineering thermoplastics, catalyzing portfolio realignment across the industry[2]Alex Scott, “BASF Readies a Massive Restructuring,” cen.acs.org . Covestro’s EUR 15 billion acquisition by ADNOC integrates renewable feedstock streams and accelerates circular-economy positioning, while Celanese’s USD 11 billion Mobility & Materials acquisition from DuPont creates the sector’s broadest resin lineup spanning 20 polymer families.
Capacity rationalization continues: INEOS closed its Ohio ABS plant, shifting output to lower-cost Mexican operations; SABIC shuttered European polycarbonate capacity to counter Chinese oversupply. Strategic differentiation now rests on sustainability credentials. Celanese launched Vectra|Zenite LCP ECO-B, featuring up to 60% renewable carbon content via mass balance, targeting 5G board-to-board connectors. BASF and Eastman are piloting depolymerization plants to close PET and PA 6 loop gaps, supported by federal Department of Energy grants.
R&D investment focuses on high-temperature, carbon-fiber-reinforced polyphenylene sulfide for battery enclosures and conductive carbon-nanotube-filled polyamide for EMI shielding. Companies leverage digital formulation platforms to shorten application-development cycles and integrate life-cycle data into customer dashboards. M&A pipelines suggest further specialization as conglomerates shed non-core businesses and equity investors seek circular-economy growth themes.
United States Engineering Plastics Industry Leaders
Ascend Performance Materials
BASF
Celanese Corporation
Covestro AG
SABIC
- *Disclaimer: Major Players sorted in no particular order

Recent Industry Developments
- March 2025: BASF has announced an increase in prices for its Engineering Plastics compounded products across North America. This price adjustment is expected to influence the United States engineering plastics market by potentially driving up production costs for manufacturers and impacting the overall pricing dynamics within the market.
- October 2024: Covestro is investing approximately EUR 100 million in its global R&D infrastructure and assets over three years, concluding in 2025. This move reinforces its competitiveness and supports innovation in the United States engineering plastics market by advancing material development to meet industry demands.


United States Engineering Plastics Market Report Scope
Aerospace, Automotive, Building and Construction, Electrical and Electronics, Industrial and Machinery, Packaging are covered as segments by End User Industry. Fluoropolymer, Liquid Crystal Polymer (LCP), Polyamide (PA), Polybutylene Terephthalate (PBT), Polycarbonate (PC), Polyether Ether Ketone (PEEK), Polyethylene Terephthalate (PET), Polyimide (PI), Polymethyl Methacrylate (PMMA), Polyoxymethylene (POM), Styrene Copolymers (ABS and SAN) are covered as segments by Resin Type.By Resin Type
| Fluoropolymer | Ethylenetetrafluoroethylene (ETFE) |
| Fluorinated Ethylene-propylene (FEP) | |
| Polytetrafluoroethylene (PTFE) | |
| Polyvinylfluoride (PVF) | |
| Polyvinylidene Fluoride (PVDF) | |
| Other Sub Resin Types | |
| Liquid Crystal Polymer (LCP) | |
| Polyamide (PA) | Aramid |
| Polyamide (PA) 6 | |
| Polyamide (PA) 66 | |
| Polyphthalamide | |
| Polybutylene Terephthalate (PBT) | |
| Polycarbonate (PC) | |
| Polyether Ether Ketone (PEEK) | |
| Polyethylene Terephthalate (PET) | |
| Polyimide (PI) | |
| Polymethyl Methacrylate (PMMA) | |
| Polyoxymethylene (POM) | |
| Styrene Copolymers (ABS, SAN) |
By End-User Industry
| Aerospace |
| Automotive |
| Building and Construction |
| Electrical and Electronics |
| Industrial and Machinery |
| Packaging |
| Other End-user Industries |
| By Resin Type | Fluoropolymer | Ethylenetetrafluoroethylene (ETFE) |
| Fluorinated Ethylene-propylene (FEP) | ||
| Polytetrafluoroethylene (PTFE) | ||
| Polyvinylfluoride (PVF) | ||
| Polyvinylidene Fluoride (PVDF) | ||
| Other Sub Resin Types | ||
| Liquid Crystal Polymer (LCP) | ||
| Polyamide (PA) | Aramid | |
| Polyamide (PA) 6 | ||
| Polyamide (PA) 66 | ||
| Polyphthalamide | ||
| Polybutylene Terephthalate (PBT) | ||
| Polycarbonate (PC) | ||
| Polyether Ether Ketone (PEEK) | ||
| Polyethylene Terephthalate (PET) | ||
| Polyimide (PI) | ||
| Polymethyl Methacrylate (PMMA) | ||
| Polyoxymethylene (POM) | ||
| Styrene Copolymers (ABS, SAN) | ||
| By End-User Industry | Aerospace | |
| Automotive | ||
| Building and Construction | ||
| Electrical and Electronics | ||
| Industrial and Machinery | ||
| Packaging | ||
| Other End-user Industries | ||


Market Definition
- End-user Industry - Packaging, Electrical & Electronics, Automotive, Building & Construction, and Others are the end-user industries considered under the engineering plastics market.
- Resin - Under the scope of the study, consumption of virgin resins like Fluoropolymer, Polycarbonate, Polyethylene Terephthalate, Polybutylene Terephthalate, Polyoxymethylene, Polymethyl Methacrylate, Styrene Copolymers, Liquid Crystal Polymer, Polyether Ether Ketone, Polyimide, and Polyamide in the primary forms are considered. Recycling has been provided separately under its individual chapter.
| Keyword | Definition |
|---|---|
| Acetal | This is a rigid material that has a slippery surface. It can easily withstand wear and tear in abusive work environments. This polymer is used for building applications such as gears, bearings, valve components, etc. |
| Acrylic | This synthetic resin is a derivative of acrylic acid. It forms a smooth surface and is mainly used for various indoor applications. The material can also be used for outdoor applications with a special formulation. |
| Cast film | A cast film is made by depositing a layer of plastic onto a surface then solidifying and removing the film from that surface. The plastic layer can be in molten form, in a solution, or in dispersion. |
| Colorants & Pigments | Colorants & Pigments are additives used to change the color of the plastic. They can be a powder or a resin/color premix. |
| Composite material | A composite material is a material that is produced from two or more constituent materials. These constituent materials have dissimilar chemical or physical properties and are merged to create a material with properties unlike the individual elements. |
| Degree of Polymerization (DP) | The number of monomeric units in a macromolecule, polymer, or oligomer molecule is referred to as the degree of polymerization or DP. Plastics with useful physical properties often have DPs in the thousands. |
| Dispersion | To create a suspension or solution of material in another substance, fine, agglomerated solid particles of one substance are dispersed in a liquid or another substance to form a dispersion. |
| Fiberglass | Fiberglass-reinforced plastic is a material made up of glass fibers embedded in a resin matrix. These materials have high tensile and impact strength. Handrails and platforms are two examples of lightweight structural applications that use standard fiberglass. |
| Fiber-reinforced polymer (FRP) | Fiber-reinforced polymer is a composite material made of a polymer matrix reinforced with fibers. The fibers are usually glass, carbon, aramid, or basalt. |
| Flake | This is a dry, peeled-off piece, usually with an uneven surface, and is the base of cellulosic plastics. |
| Fluoropolymers | This is a fluorocarbon-based polymer with multiple carbon-fluorine bonds. It is characterized by high resistance to solvents, acids, and bases. These materials are tough yet easy to machine. Some of the popular fluoropolymers are PTFE, ETFE, PVDF, PVF, etc. |
| Kevlar | Kevlar is the commonly referred name for aramid fiber, which was initially a Dupont brand for aramid fiber. Any group of lightweight, heat-resistant, solid, synthetic, aromatic polyamide materials that are fashioned into fibers, filaments, or sheets is called aramid fiber. They are classified into Para-aramid and Meta-aramid. |
| Laminate | A structure or surface composed of sequential layers of material bonded under pressure and heat to build up to the desired shape and width. |
| Nylon | They are synthetic fiber-forming polyamides formed into yarns and monofilaments. These fibers possess excellent tensile strength, durability, and elasticity. They have high melting points and can resist chemicals and various liquids. |
| PET preform | A preform is an intermediate product that is subsequently blown into a polyethylene terephthalate (PET) bottle or a container. |
| Plastic compounding | Compounding consists of preparing plastic formulations by mixing and/or blending polymers and additives in a molten state to achieve the desired characteristics. These blends are automatically dosed with fixed setpoints usually through feeders/hoppers. |
| Plastic pellets | Plastic pellets, also known as pre-production pellets or nurdles, are the building blocks for nearly every product made of plastic. |
| Polymerization | It is a chemical reaction of several monomer molecules to form polymer chains that form stable covalent bonds. |
| Styrene Copolymers | A copolymer is a polymer derived from more than one species of monomer, and a styrene copolymer is a chain of polymers consisting of styrene and acrylate. |
| Thermoplastics | Thermoplastics are defined as polymers that become soft material when it is heated and becomes hard when it is cooled. Thermoplastics have wide-ranging properties and can be remolded and recycled without affecting their physical properties. |
| Virgin Plastic | It is a basic form of plastic that has never been used, processed, or developed. It may be considered more valuable than recycled or already used materials. |


Research Methodology
Mordor Intelligence follows a four-step methodology in all our reports.
- Step-1: Identify Key Variables: The quantifiable key variables (industry and extraneous) pertaining to the specific product segment and country are selected from a group of relevant variables & factors based on desk research & literature review; along with primary expert inputs. These variables are further confirmed through regression modeling (wherever required).
- Step-2: Build a Market Model: In order to build a robust forecasting methodology, the variables and factors identified in Step-1 are tested against available historical market numbers. Through an iterative process, the variables required for market forecast are set and the model is built on the basis of these variables.
- Step-3: Validate and Finalize: In this important step, all market numbers, variables and analyst calls are validated through an extensive network of primary research experts from the market studied. The respondents are selected across levels and functions to generate a holistic picture of the market studied.
- Step-4: Research Outputs: Syndicated Reports, Custom Consulting Assignments, Databases & Subscription Platforms


